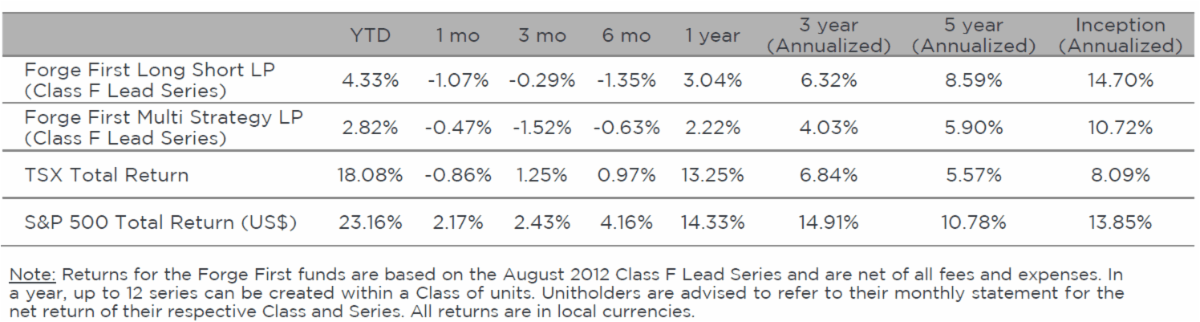
Forge First Asset Management commentary for the month ended October 31, 2019.
October 2019 marked the 2nd consecutive month that value stocks beat growth stocks yet the broader FANG index, largely not representative of value, was the key driver of the strong performance in U.S. equity indices, gaining more than 6%. Hence, while a growing group of traders push the reflation story that sees large fiscal stimulus reaccelerating global growth and boosting the relative performance of the value factor and non-US equities, it’s largely the degree of tape action and the anticipation of this forward change in fundamentals that to date supports this pitch.

Q3 2019 hedge fund letters, conferences and more
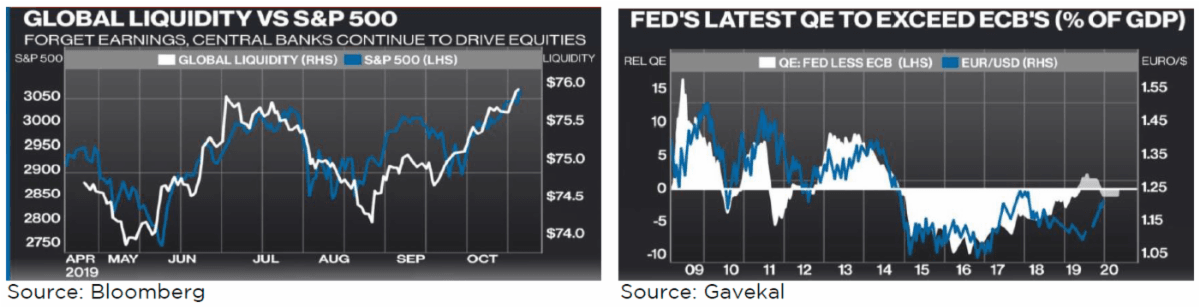
In fact, for now perhaps it's merely reaccelerating global liquidity that has pushed non-Canadian equity indices to record highs. The graph on the below left highlights the strong positive correlation between global liquidity (white line) and equity prices (blue line). During the past six months, 51 central banks, including the Fed, have cut rates, reversing 100% of the rate hikes seen during 2018.
Then last week, on behalf of the FOMC, Jerome Powell announced almost $1T in annualized QE over the next 5 months! As a result, the Fed is now expected to grow its balance sheet (as a % of GDP) faster than the ECB. This forecast is illustrated by the white area on the graph on the above right rising above the horizontal line. The 'reflationists' believe this shift in the relative magnitude of growth in US dollar liquidity will push the USD lower (shown in terms of the € via the blue line), further easing financial conditions and adding more fuel to the pro-cyclical rotation.
While U.S. equity indices had a strong October, and bond yields were relatively flat from the start to the finish of the month, Canada's TSX suffered a 0.86% decline in total return. Gold and bank shares rose while consumer, various sub-indices of equities categorized as bond proxies, and E&P sectors lost value. The 7.82% decline in E&P stocks was the principal reason why the two funds at Forge First declined during October.
The Canadian oil companies we own in our portfolios, including Cenovus Energy (CVE.CA), MEG Energy (MEG.CA), Suncor Energy (SU.CA) and Whitecap Resources (WCP.CA), continue to generate material amounts of free cash flow, much of which is being returned to shareholders through dividends and share buybacks. In contrast, and in line with our long Canada, short U.S. oil company thesis, the story has been different for U.S. energy producers that we're short. One example of this trend is heavily leveraged OccidentalPetroleum (OXY.US). These U.S. producers' burn cash as their business model is vastly inferior to that of western Canadian producers at US$50-$55 WTI oil.
However, being net long this energy trade in October was a losing proposition thanks to the apathy displayed towards these Canadian cash machines. More recently, our energy theme has performed back in our favour as investors have noticed our Canadian companies are trading at free cash flow yields in the mid-teens and higher, realized the Federal election is now in the rear view mirror & noticed that Permian players such as Diamondback (FANG.US) are imploding. Also, despite profits from our gold book, the funds suffered a modest loss in materials, along with small losses in real estate, ETFs, and communications. Leading the charge on the winning side of the ledger was our exposure in technology, fuelled by the strong performance in long time holding VISA Inc. (V.US). In addition, the funds made money in the industrials, utilities, consumer and financial sectors.
Mid-way through October the funds began a substantive shift towards 'value' and away from 'growth'. While we're known as being free cash flow not "factor" investors, we noticed a significant tilt in sentiment and fund flows away from 'risk off' portions of equity markets, think growth, and certain types of bond proxies, in favour of deep value opportunities. These deep value segments of the market are typically associated with cyclically sensitive industries including energy, materials and manufacturing. However, as implied by the discussion about performance earlier, this shift was painful prior to it beginning to pay off during the last week of October, and so far, continuing during the first several days of November.
It's too early to judge whether or not this style rotation will be substantiated by active government stimulus that results in improving economic data, ensuring the sustainability of this shift. However, to date we've noticed several telling characteristics supporting our recent moves. For example, a diverse selection of cyclical (and very cheap) stocks, i.e., Caterpillar Inc. (CAT.US), Union Pacific Corp (UNP.US), JP Morgan Chase & Co. (JPM.US) and Polaris Inc (PII.US) all rallied despite delivering ho-hum financial results and forward guidance. While cyclical industries can only rally so far without commensurate cyclical economic improvement, for now it appears that these cyclical equities, ones featuring extreme valuation discounts vis-à-vis their "growth" peers are sniffing out a modest economic recovery from the near recessionary conditions that have dominated 2019.
A great example is our recent purchase of two U.S. refiners, Marathon Petroleum Corp (MPC.US) and PBF Energy Inc. (PBF.US), operators providing exposure to the coasts and processors of heavy crude, hence positioned to benefit handsomely from the upcoming shifts in sulphur requirements in maritime shipping. This portfolio repositioning also saw us make three additional moves. First, we reduced our short position in transportation stocks. Second, we modestly increased our net long position in base metals with the purchase of First Quantum Minerals (FM.CA) and finally, to optimize the bond proxy/defensive portion of our portfolios we sold Boralex Inc. (BLX.CA) but maintained our REIT units, albeit with a slightly reduced weight.
Further it's our view that given the S&P 500 was trading at 17.6X forward 12 month EPS as of November 1st (see graph below on the top left), for stocks to go higher, it's the 'out of favour', value stocks that need to work, as market sentiment reflects an expectation that Powell's mid-cycle slowdown will reverse during 2020. And while it's possible that Q3 EPS could mark the 3rd consecutive decline in year-over-year earnings for the first time since Q4 2015 through Q2 2016, we acknowledge that equities are priced based on future expectations.
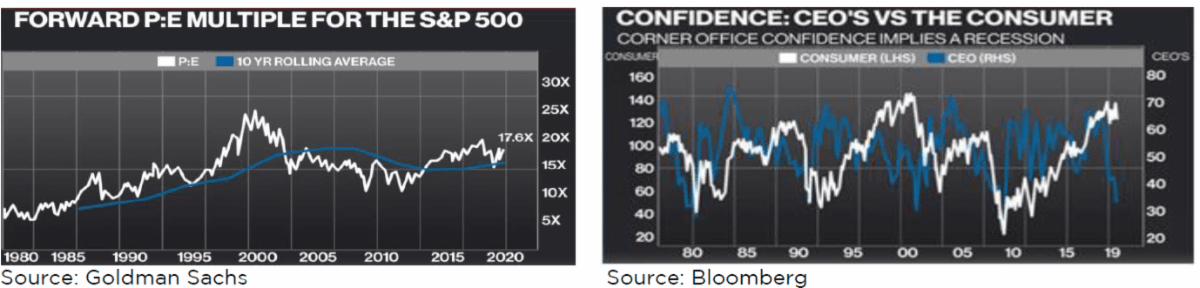
Further rationale for our tactical shift is that we're likely to get some near term good news including a Phase 1 China-U.S. trade deal, the delay of tariffs on EU auto exports, the potential reversal of existing tariffs on Chinese goods, and the signal that the expected imposition of further tariffs against Chinese goods in December gets delayed. In addition, the white line on the graph on the above right illustrates that our concern that Trump's trade rhetoric could cause the U.S. consumer to retrench has yet to be realized.
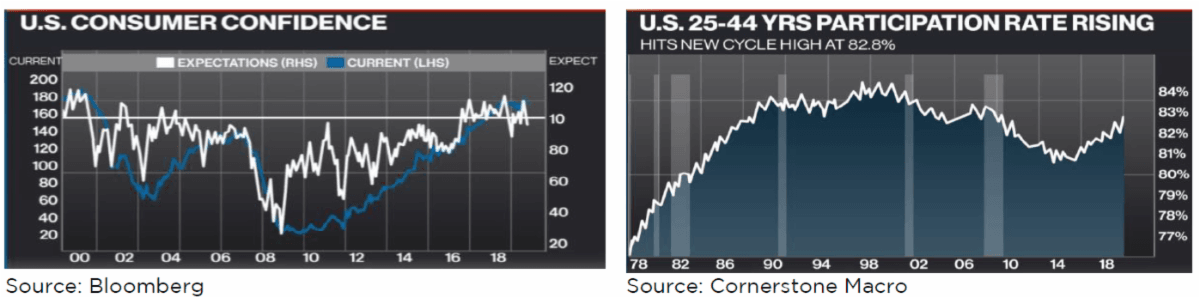
While it's true that the graph on the below left shows consumer expectations towards the future are less rosy than they used to be, the fact is, any impact from this negative shift has been dwarfed by the recent strength in U.S. labour markets. With October's data, the 3 month average increase in U.S. nonfarm payrolls was revised to 176,000 (up from 136,000), roughly in line with the expected revision for H2 2018. In addition, the rising trend in the prime age labour force (25-54 years) participation rate to 82.8%, seen in the graph on the below right, keeps unit labor costs tame and helps extend this already record long expansion.
However, for the rate of increase in global GDP to truly reaccelerate, we need to see better growth in the EU or China and/or stronger capital spending in the U.S. You sure can't say the Chinese government isn't trying to catalyze faster rates of growth, as Cornerstone Macro has counted 102 easing moves by Beijing. However, concern towards heated housing prices continues to prevent China from tabling a full-on growth boost.
Shifting to the EU, the hope that fiscal stimulus will be forthcoming has pushed long yields higher, but this hype needs to be substantiated with coordinated action. Recently, we've seen some improvement in the less export dependent, more service oriented French economy, to complement solid improvement in Spain and Portugal. However, Italy hasn't improved and the largest EU economy, Germany continues to deteriorate.
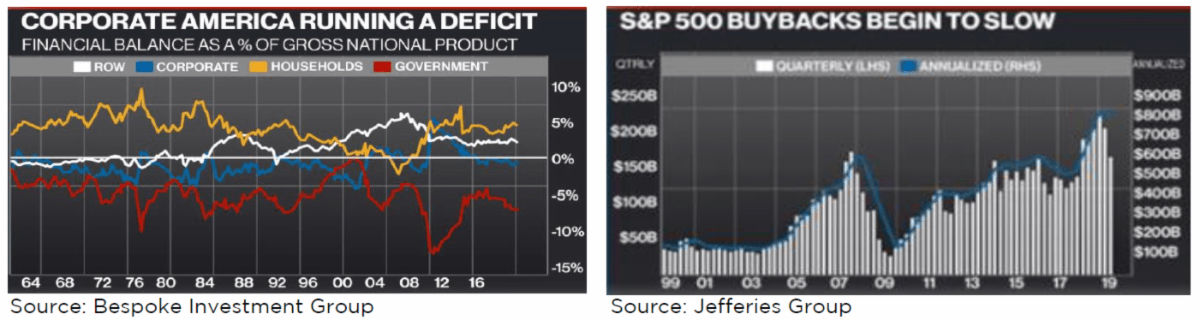
As for U.S. capital spending, it's our sense that corporate America remains suspicious towards the sustainability of any near term trade truce and remains reticent to open up their wallets (please see CEO confidence on the top right graph). However, having said that the blue line on the graph on the below left shows that for all the talk of the cash generative capability of corporate America, this sector of the U.S. economy remains a net user of cash. A key reason for this deficit is the level of share buybacks shown on the below right graph.
Here at home our economy remains bipolar, with strong, structural growth in the greater Toronto area (20% of Canada's GDP) driven by immigration, financial services, and the tech sector. It should also be pointed out that Montreal and the lower mainland of B.C. also continue to make positive contributions. In contrast, the provinces in the Prairie and Maritimes are in rough shape. Given this two faced environment, it remains difficult to find high conviction domestic economy focused investment opportunities.
In summary, while our defensive positioning late last year was a virtue, year to date it's been a bit of a curse. 'Safe' growth, value, a sprinkle of resources, including the insurance element of gold plus the intended offence of our net oil (long Canadian oil sands, short U.S. shale) position, has been too conservative. Naturally that fueled the great dialogues among the investment team at Forge First that catalyzed the positioning changes discussed in this commentary.
We will remain vigilant as to whether the multiplier effect from the unending and unprecedented level of stimulus (monetary everywhere, to date, fiscal confined to the U.S. and China) that we're continuing to witness will accelerate global growth. However, when the Chair of the world's dominant Central Bank indicates they would need to see a sustained and significant uptick in price pressures to consider future rate hikes, we realized it would be imprudent to not heed the message that the Fed is throwing caution to the wind.
Consequently, while the same macro ills that existed a few months ago remain today, during the last few weeks we tactically increased the net exposure of our two funds to their highest levels of the year and made the discussed shift in style within the portfolios. I hasten to add that we continue to own both puts and put spreads on equity indices to complement our diversified short book.
For now markets appear to have the best of all worlds, specifically accommodative Central banks, a strong U.S. consumer and the hype that big fiscal stimulus is coming. As for what the future might bring, one item that's top of mind is the potential for Elizabeth Warren to be the Democratic candidate for President next November. Who knows whether she wins or loses, but in a few months we'll know if she's won the nomination and we suspect markets may not like that development.
As always, thank you for your consideration. Please visit our website at www.forgefirst.com for information on our funds. Should you have any questions, please contact us.
Thank you,
Daniel Lloyd
Portfolio Manager
Andrew McCreath, CFA
President and CEO


