After months of speculation, Middle Market companies show signs of slowing growth
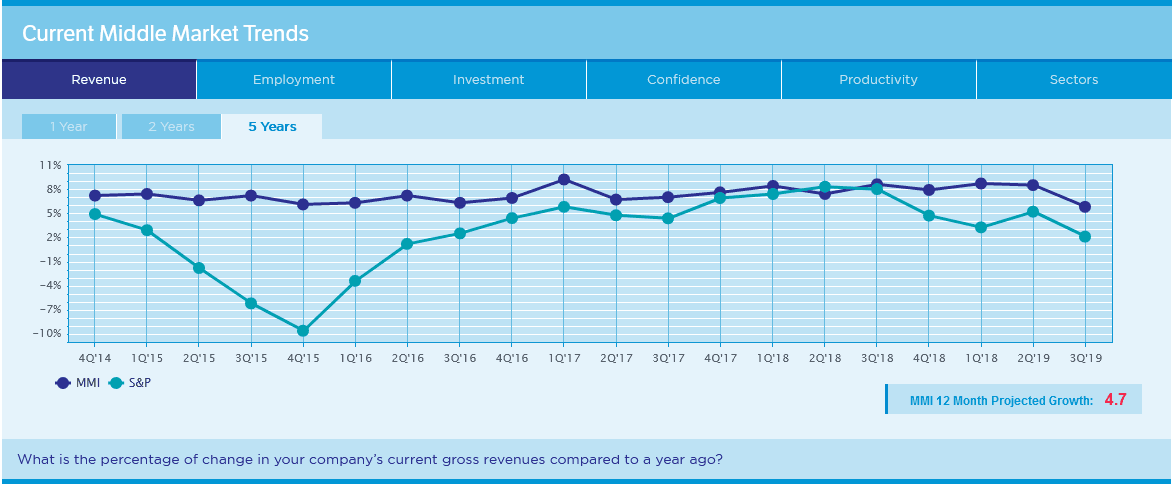
COLUMBUS, OH — The National Center for the Middle Market (NCMM) released its 3Q Middle Market Indicator (MMI) today with data showing a decrease in growth rate for middle market companies. At 5.8 percent, it fell nearly three points from the Q2 report.

Q3 2019 hedge fund letters, conferences and more
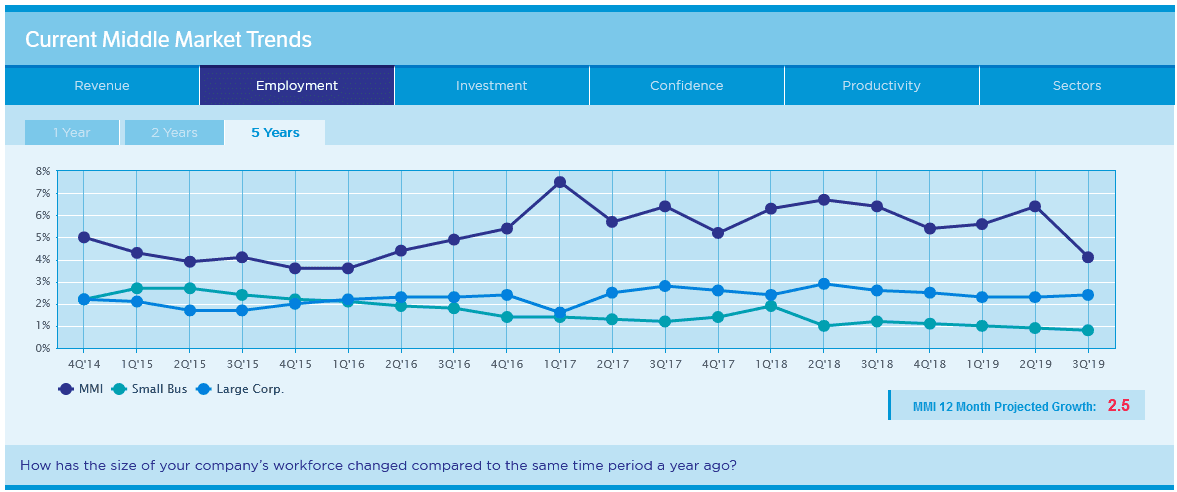
The proportion of firms that grew 10 percent or more in the last 12 months declined from 38 percent in Q2 to 28 percent in Q3, and the rate of employment growth has slowed from 6.4 percent to 4.1 percent. As with revenue growth, fewer companies are adding workers at a fast pace (10 percent or more). That figure stands at 23 percent, down from 30 percent three months ago.
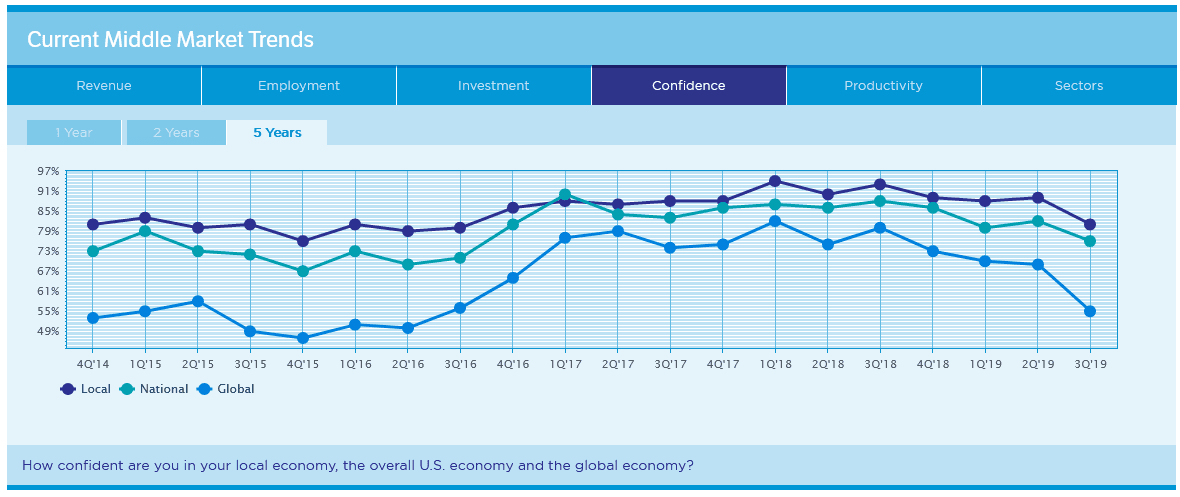
Though growth has slowed, it is still strongly positive, and a majority of middle market executives say their companies’ overall performance is better today than it was one year ago. However, this number is declining, too, from 68 percent last quarter to 60 percent currently. The all-time high of 73 percent was recorded less than one year ago at the close of 2018. The Short Term Index, which is calculated based on business climate perceptions and expected sales and demand for the three months ahead, has been on a downward trajectory since mid-2018. The index now sits at its all-time low at 49.
A slight majority of businesses expect continued top-line growth in the year ahead. However, just 35 percent expect to add people. Those that do plan to hire say they will do so at the significantly slower rate of 2.5 percent, the lowest projection since 2014. While middle market leaders tend to underestimate forecasts of future growth and hiring, the gap between projected revenue growth and actual performance closed notably this quarter, and the actual hiring rate fell below what had been projected a year ago for only the second time in MMI history.
“For the last few quarters, our data have been predicting that growth would cool off, and now it has.” said Thomas A. Stewart, executive director of the NCMM. “But we can’t leap to conclusions about what it means — is this a single-quarter anomaly, or the first of a coming trend?”
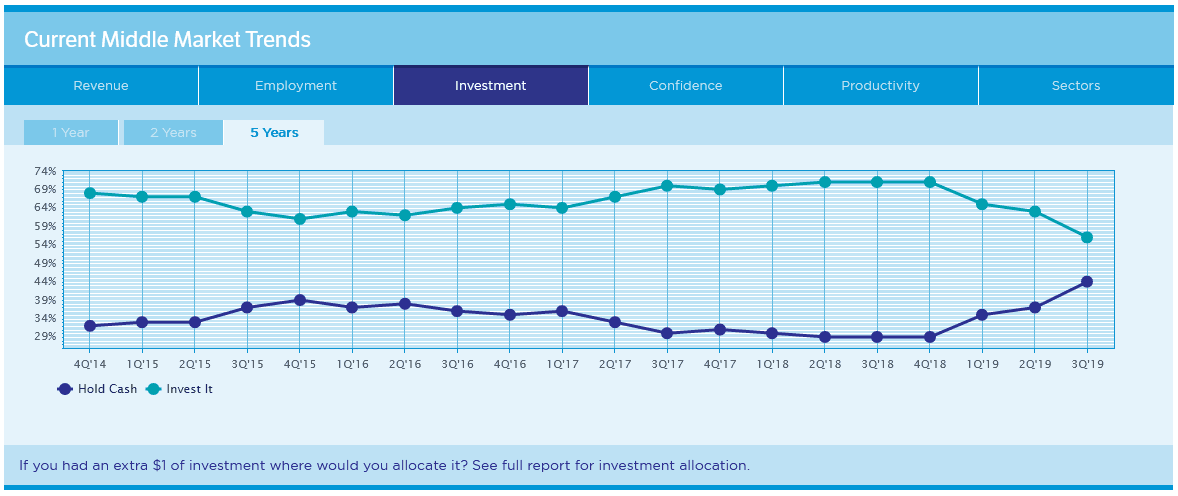
Compared to the end of 2018, more middle market leaders now say they would save an extra dollar rather than put it immediately to work. Last quarter saw the first notable change in the savings-to-investment ratio since mid-2015. This quarter, the proportion of savers rose once again, from 35 percent three months ago to 37 percent.
“As we know, middle market leaders tend to under promise and over deliver,” said Doug Farren, managing director of the NCMM. “However, we’ll certainly be watching future quarters closely for signs of further softening growth.”
The middle market continues to grow significantly faster than both big and small business, and a majority of executives expect company growth to continue, albeit at slower rates. At the same time, middle market companies appear to be building cash positions and putting greater emphasis on cost and efficiency measures to ensure they are prepared for whatever the coming months bring.
For additional survey data and infographics, including in-depth looks at regional variations, hiring/talent acquisition efforts and other business concerns among middle market companies, visit http://www.middlemarketcenter.org.
About the Middle Market Indicator (MMI)
The MMI, which was created in 2012, surveys 1,000 executives (CEOs, CFOs and other financial decision makers) from the middle market each quarter to examine topics related to business capabilities, performance, growth drivers and economic outlook among other topics. This quarter's MMI was fielded during the first two weeks of June 2018. It is weighted to accurately reflect the size, industry-wide and geographic distribution of this sector, which includes companies ranging from $10 million to $1 billion in annual revenue. The survey is conducted by RTi Research on behalf of the National Center for the Middle Market.
About the National Center for the Middle Market (NCMM)
The National Center for the Middle Market is a collaboration between The Ohio State University Fisher College of Business and Chubb. It exists for a single purpose: to ensure that the vitality and robustness of Middle Market companies are fully realized as fundamental to our nation's economic outlook and prosperity. The Center is the leading source of knowledge, leadership, and innovative research on the middle market economy, providing critical data analysis, insights, and perspectives for companies, policymakers, and other key stakeholders, to help accelerate growth, increase competitiveness and create jobs in this sector.
Housed at The Ohio State University Fisher College of Business, the National Center for the Middle Market is the first center of its kind in the nation. The Center enthusiastically serves middle market firms, students, academic researchers, policy makers, the media and other key stakeholders with interests in the health and well-being of the middle market. The Center is fully committed to funding and distributing the most credible open-sourced research, dynamically creating new knowledge, providing programs that drive value for middle market companies, and offering a well-informed outlook on the health and future of the middle market via the Middle Market Indicator.


