Something peculiar has been happening in the United States labor market. Hiring has been strong, but wages are growing more slowly than previous business cycles. Let’s look at the data:
- The official unemployment rate has fallen to 3.7%. This is near the lowest level of unemployment in the last 50 years.
- There are 7.2 million job openings, near an all-time record.
- There are only 6.0 million unemployed workers.
- Even though there are more job openings than unemployed workers, real wages grew just 1.5% over the last year.

Q2 hedge fund letters, conference, scoops etc
Many people are familiar with the unemployment rate, but not with how it’s put together. This article will walk through who gets counted in the unemployment rate, why it matters, and how investors can incorporate this data into their outlook.
Who Is Counted in the U.S. Unemployment Rate?
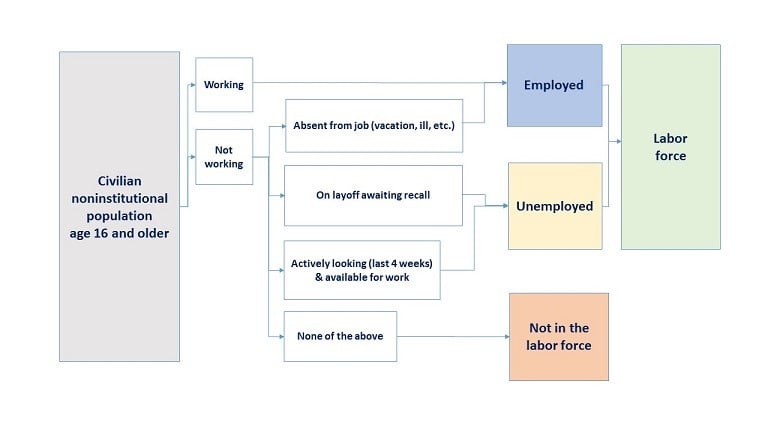
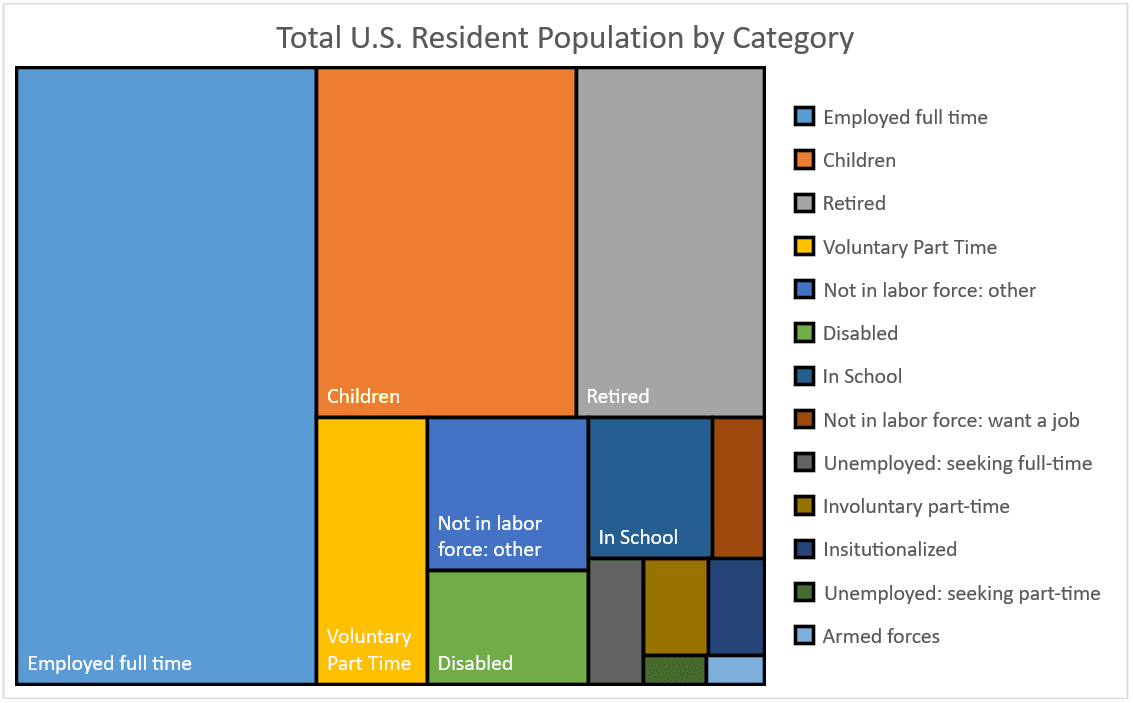
The Census Bureau’s Population Clock currently measures the US resident population at 329,600,000, yet not all of these individuals are counted in the unemployment rate. To be counted, an individual must be considered to be in the “labor force”. The labor force includes individuals either working or seeking work. Note the following groups are excluded from the labor force.
- Those in the armed forces and people who are institutionalized (currently about 5.1 million people)
- Children under the age of 16 and those who are not in the labor force are subtracted to get to the current labor force (See table titled “Civilian Noninstitutional Population”)
Source: https://www.bls.gov/cps/definitions.htm
Civilian Noninstitutional Population
| Resident Population | 329,600,000 |
| (-) Resident Armed Forces | 1,200,000 |
| Civilian Population | 328,400,000 |
| (-) Institutionalized Population | 3,900,000 |
| Civilian Noninstitutional Population | 324,500,000 |
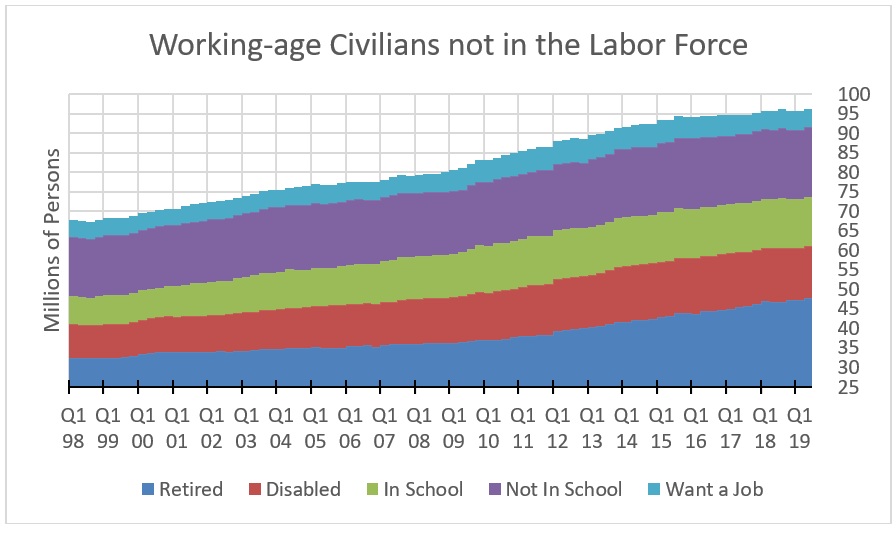
Next, we can take a look at civilians who are not in the labor force broken down by category. While retirees make up a large cohort of people not participating in the labor force, there is still a large pool of potential workers across this population. In fact, there are 5.3 million who want a job but have not sought work in the past 4 weeks or more. These people are not included in the unemployment rate and are nearly equivalent in number to the 6.0 million of officially unemployed people. After excluding these civilians, we reach the total labor force.
Total Labor Force
| Civilian Noninstitutionalized Population | 324,500,000 |
| (-) Children under age 16 | 65,000,000 |
| (-) Not in labor force: Retired | 47,100,000 |
| (-) Not in labor force: Disabled | 13,100,000 |
| (-) Not in labor force: In school | 12,400,000 |
| (-) Not in labor force: Do not want a job, not retired, not disabled, not in school | 17,600,000 |
| (-) Not in labor force: Want a job | 5,300,000 |
| Total Labor Force (rounded) | 164,000,000 |
The number of unemployed persons as a percentage of the total labor force is how economists calculate the unemployment rate.
Total Employed and Unemployed
| (+) Employed full time | 132,200,000 |
| (+) Employed part time: economic reasons | 4,500,000 |
| (+) Employed part time: noneconomic reasons | 21,100,000 |
| Total Employed | 157,800,000 |
| (+) Unemployed: looking for full-time work | 4,900,000 |
| (+) Unemployed: looking for part-time work | 1,300,000 |
| Total Unemployed | 6,200,000 |
| Total Labor Force | 164,000,000 |
Where are all the workers?
So, does an economy with a 3.7% unemployment rate mean 96.3% of people are working? No! Out of a resident population of almost 330 million, only 132 million are full-time, civilian workers, or about 40% of the population. That means if you are reading this article at your desk, at your full-time job, you are not in the majority in the US!
Broader Measures of Employment
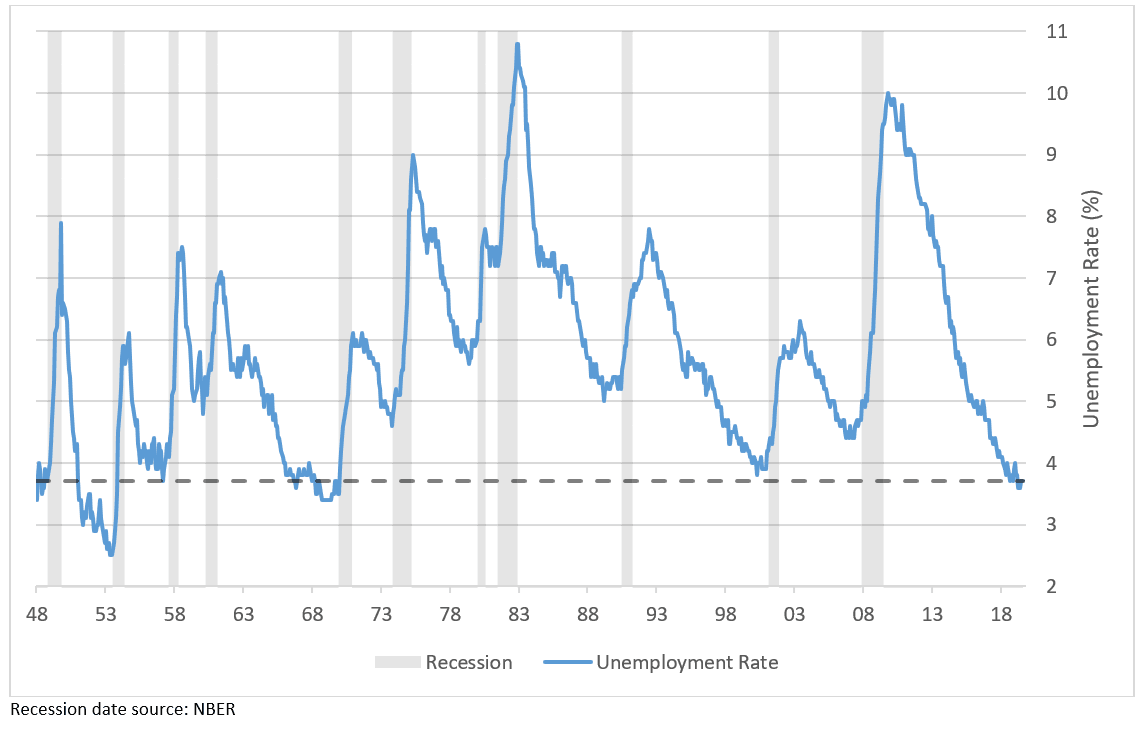
While the current unemployment rate, 3.7%, registers near 50-year lows, broader measures of employment paint a slightly different picture of the labor market. Participation rates remain below recent highs. This means businesses may be able to find new hires without raising wages as significantly as they have in the past.
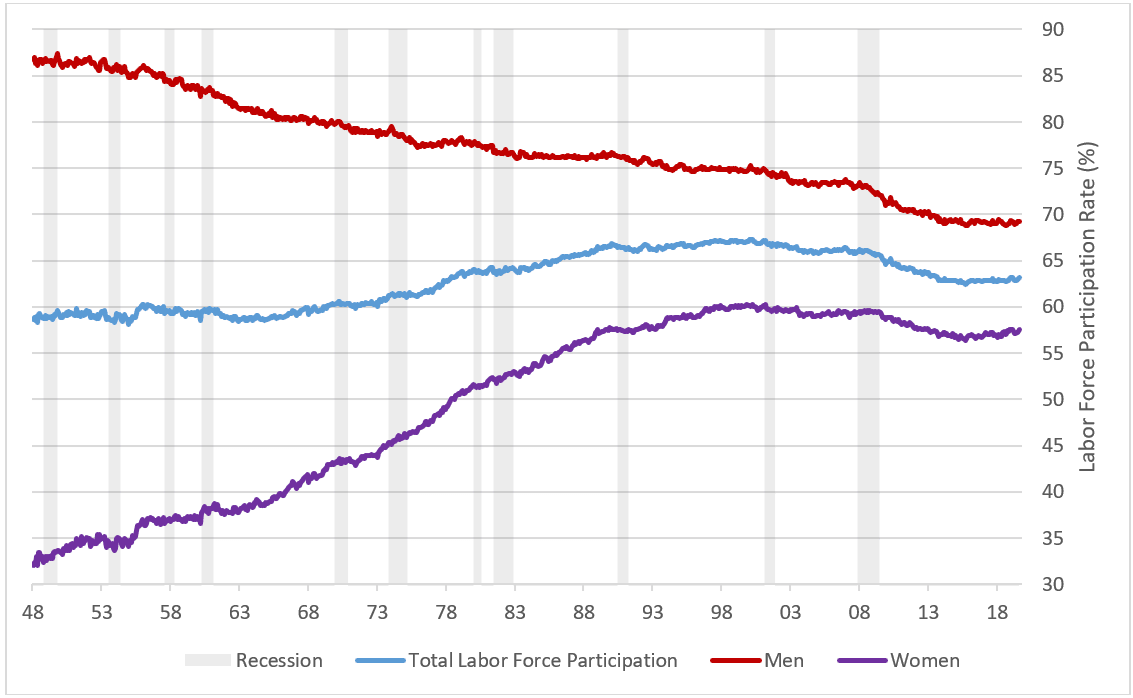
Recession date source: NBER
One broader measure of employment is the Labor Force Participation Rate, or the number of people in the labor force divided by the total working-age population (people 16 years and older). While the unemployment rate has fallen from 10% following the financial crisis down to 3.7% today, the labor force participation rate actually peaked back in 2000. This means fewer people age 16 and older are actively seeking jobs than over the past two decades.
Recession date source: NBER
Analyzing this decline shows that the change is attributable to three dynamics:
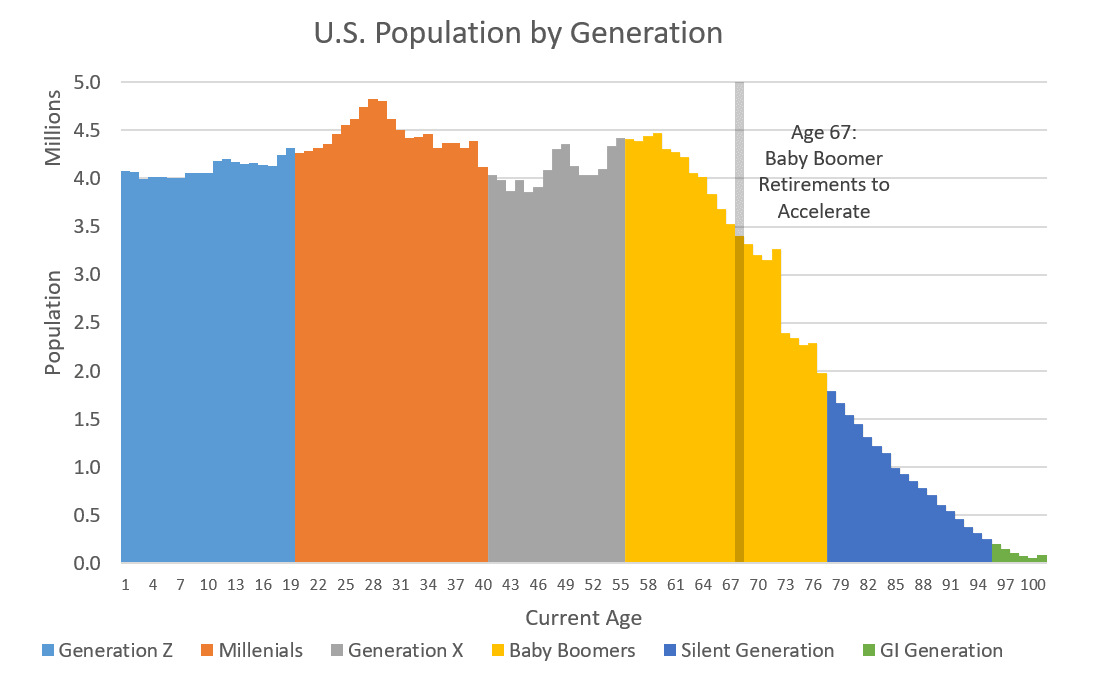
(1) Baby Boomers retiring,
(2) more people attending school, and
(3) more people classified as disabled.
Looking Forward:
Broader measures of employment like the Labor Force Participation Rate or the Employment-to-Population ratio offer clues to explain the puzzling dynamics recently observed in the labor markets. Hiring may continue to be strong without rapid wage acceleration. The oncoming Baby Boomer retirees may pressure the Labor Force Participation rate lower. Investors that allocate capital with these dynamics in mind may give themselves and advantage in successfully navigating the changing labor markets.
Conclusion:
The unemployment rate has rarely been this low. Historically, a labor market this tight has generated real wage gains of 2.5-3.0% for workers. Today, real wages are growing only 1.5%. Slower wage growth has implications for the length of the business cycle, for the magnitude of inflation, and for the pace of economic growth. Investors who understand how the unemployment rate is calculated and contemplate the broader labor market dynamics described in this article will have an advantage now and in the future. The demographic trends driving slower growth and inflation are just beginning, and are set to continue for at least the next decade.
Karen Baldwin, Vice President and Director of Human Resources at Greenleaf Trust, also contributed to this article.
About Chris Burns
As an investment strategist and senior fixed income analyst at Greenleaf Trust, Chris contributes to portfolio construction and asset allocation and is responsible for development and implementation of fixed income strategies. He holds a bachelor’s degree in economics from the University of Michigan and a master of accounting degree from the University of Michigan Ross School of Business. Chris is a CFA® charterholder and a licensed CPA.


