The use of numbers to make sense of the world and solve problems long predates modern data collection from websites, applications, devices, and sensors. Florence Nightingale used coxcomb diagrams to identify and reduce the causes of hospital mortality during the Crimean War. More than a century ago, William Sealy Gosset, Chief Brewer at the Guinness Brewery, devised the t–test to assure beer quality. In World War II, Abraham Wald used the principles of survivorship bias to help Allied aviators survive bombing raids over Western Europe. In the 90s and early oughts, Billy Beane and Paul DePodesta used sabermetrics to build a top baseball team on a shoestring budget.
Your organization, too, can benefit from:
- Understanding associations and causal relationships between variables
- Identifying attrition/retention between stages of a process
- Pinpointing inputs that produce disproportionate outputs
- Detecting and predicting trends
- Designing experiments and Interpreting their results

Q2 hedge fund letters, conference, scoops etc
You can encapsulate these findings in reports and dashboards, giving your entire organization access to informed decision-making. With some technical chops, you can even build systems to automatically make time-sensitive decisions in response to data. Let’s walk through a few principles with practical applications for the business world.
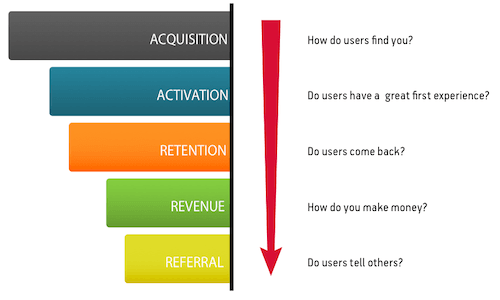
Funnel Analysis
One of the most common frameworks for setting metrics is known as AARRR – Acquisition, Activation, Retention, Referral, Revenue.
Source: https://www.product-frameworks.com/AARRR-Metrics.html
This approach is more generally referred to as funnel analysis. It represents the progression of prospects from initial interest to spending money as customers and even evangelizing on your behalf. Each step in the funnel involves some rate of attrition and retention, as people lose interest.
Typically, organizations use data from marketing automation and customer relationship management applications such as Marketo and Salesforce to track the progression of people through various stages of the marketing and sales process. Pinpointing the main sources of leakage in your process allows you to more effectively dedicate training and other resources to make sure your prospects become customers.
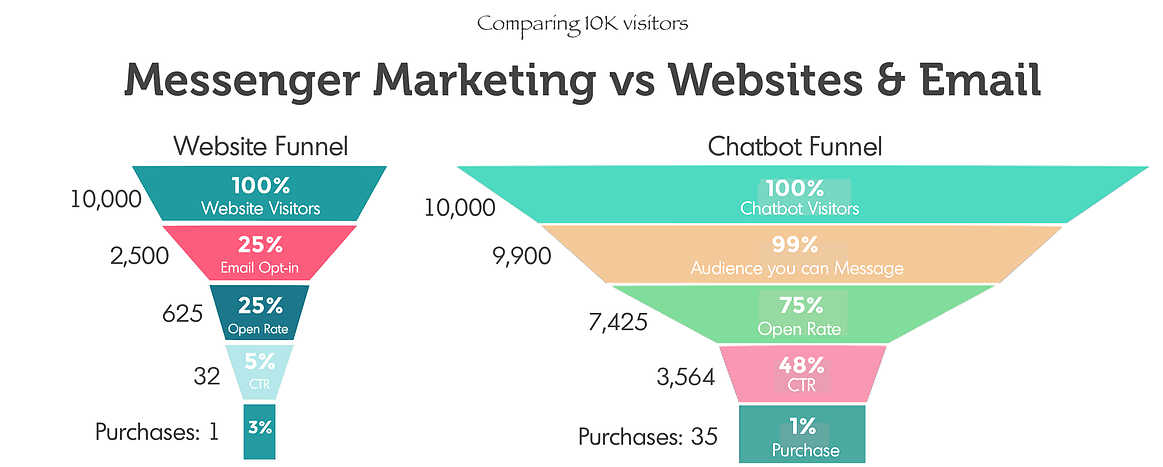
Similarly, you can track the progression of customers on your eCommerce platform or through any number of user flows. The funnel approach is useful whenever multiple steps in a sequence are involved.
Source: https://chatbotslife.com/how-to-get-10x-sales-using-messenger-marketing-d3bda6c6b77a
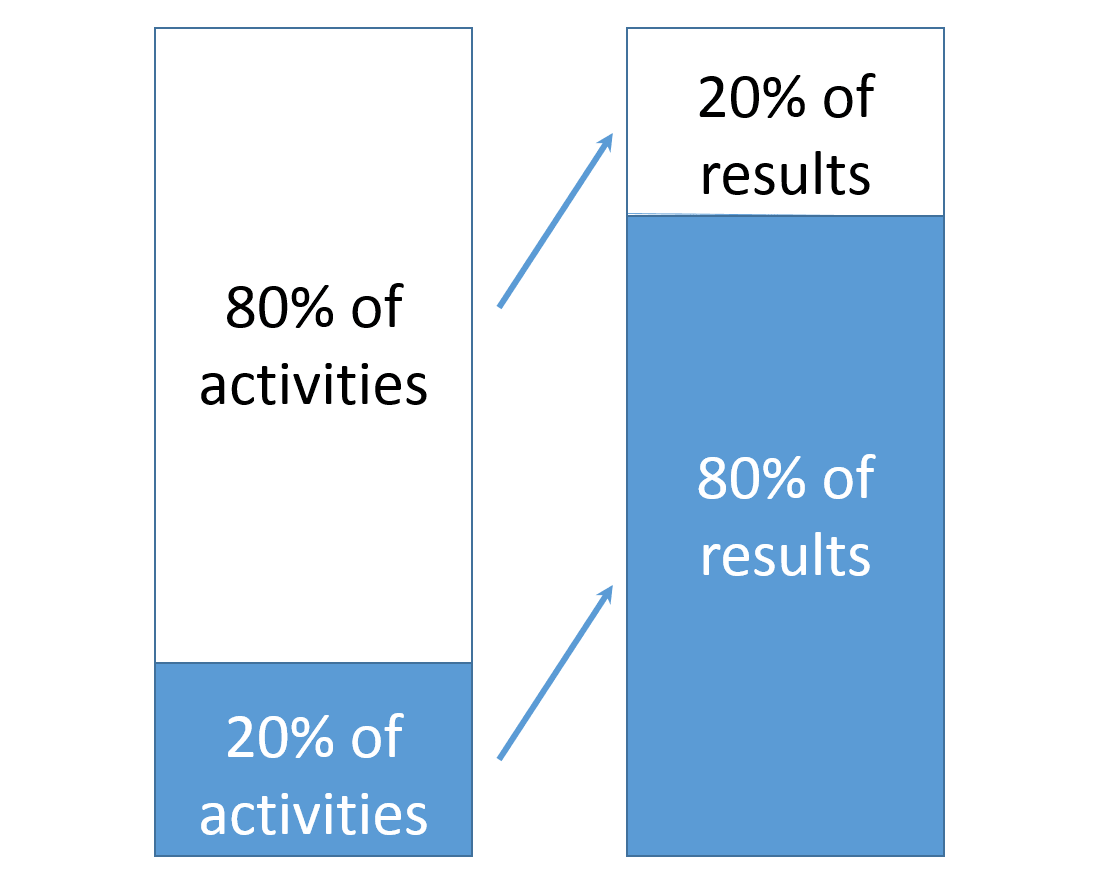
The Pareto Principle
Disproportionality and uneven distributions of input and output exist everywhere in the human and natural worlds. In 1896, Italian economist Vilfredo Pareto noted that about 80% of the land in Italy was owned by just 20% of the population. Likewise, the most common 20% of words in a language account for 80% of word occurrences; 20% of the population accounts for 80% of healthcare expenditures; the most productive 20% of pea plants in a garden produce 80% of the peas.
Source: http://www.mytimemanagement.com/pareto-principle.html
This observation, called the 80/20 Rule or the Pareto Principle, has obvious business applications. There is a good chance that a relative handful of your customers generate most of your revenue, that a few of your software bugs produce most of your malfunctions, that your most productive team members produce most of the output, and that a few of your marketing activities drive most of the public interest in your organization.
The identities of these top contributors lurk in your data. Using data from your CRM, you can identify your most valuable accounts and see which of your team members close the most valuable deals. Using data from ticketing and customer service, you can pinpoint and resolve the most serious causes of customer complaints. With project management data, you can see who in your organization builds the most products or features. With data from advertising platforms, you can see which topics and activities put your organization in front of the most eyeballs.
By understanding which inputs produce a disproportionate amount of the outputs, you have a lever with which to multiply the results of your efforts.
The Lies Numbers Tell: Vanity Metrics
With the power offered by data, there is also a lot of room for matters to go horribly wrong. In 1954, Peter Drucker wrote that “What gets measured gets managed.” The lesson of that quote isn’t that the only valuable activities are measurable, but that measuring the wrong things constructs the wrong incentives, encouraging the wrong activities and decisions.
Vanity metrics are statistics that superficially indicate success but do not have a direct relationship with more fundamental goals – in the case of business, revenues or customer satisfaction. History is full of serious metrics misfires, including some with horrendous ecological and humanitarian consequences. These mistakes aren’t just the failings of amateurs and ideologues. Microsoft Bing once attempted to use “searches per user session” as a key performance indicator (KPI). This metric incentivized developers to add features that kept users clicking instead of delivering the best search results. They realized their mistake only after customer satisfaction, as measured by Net Promoter Score (NPS), refused to budge in response to their efforts.
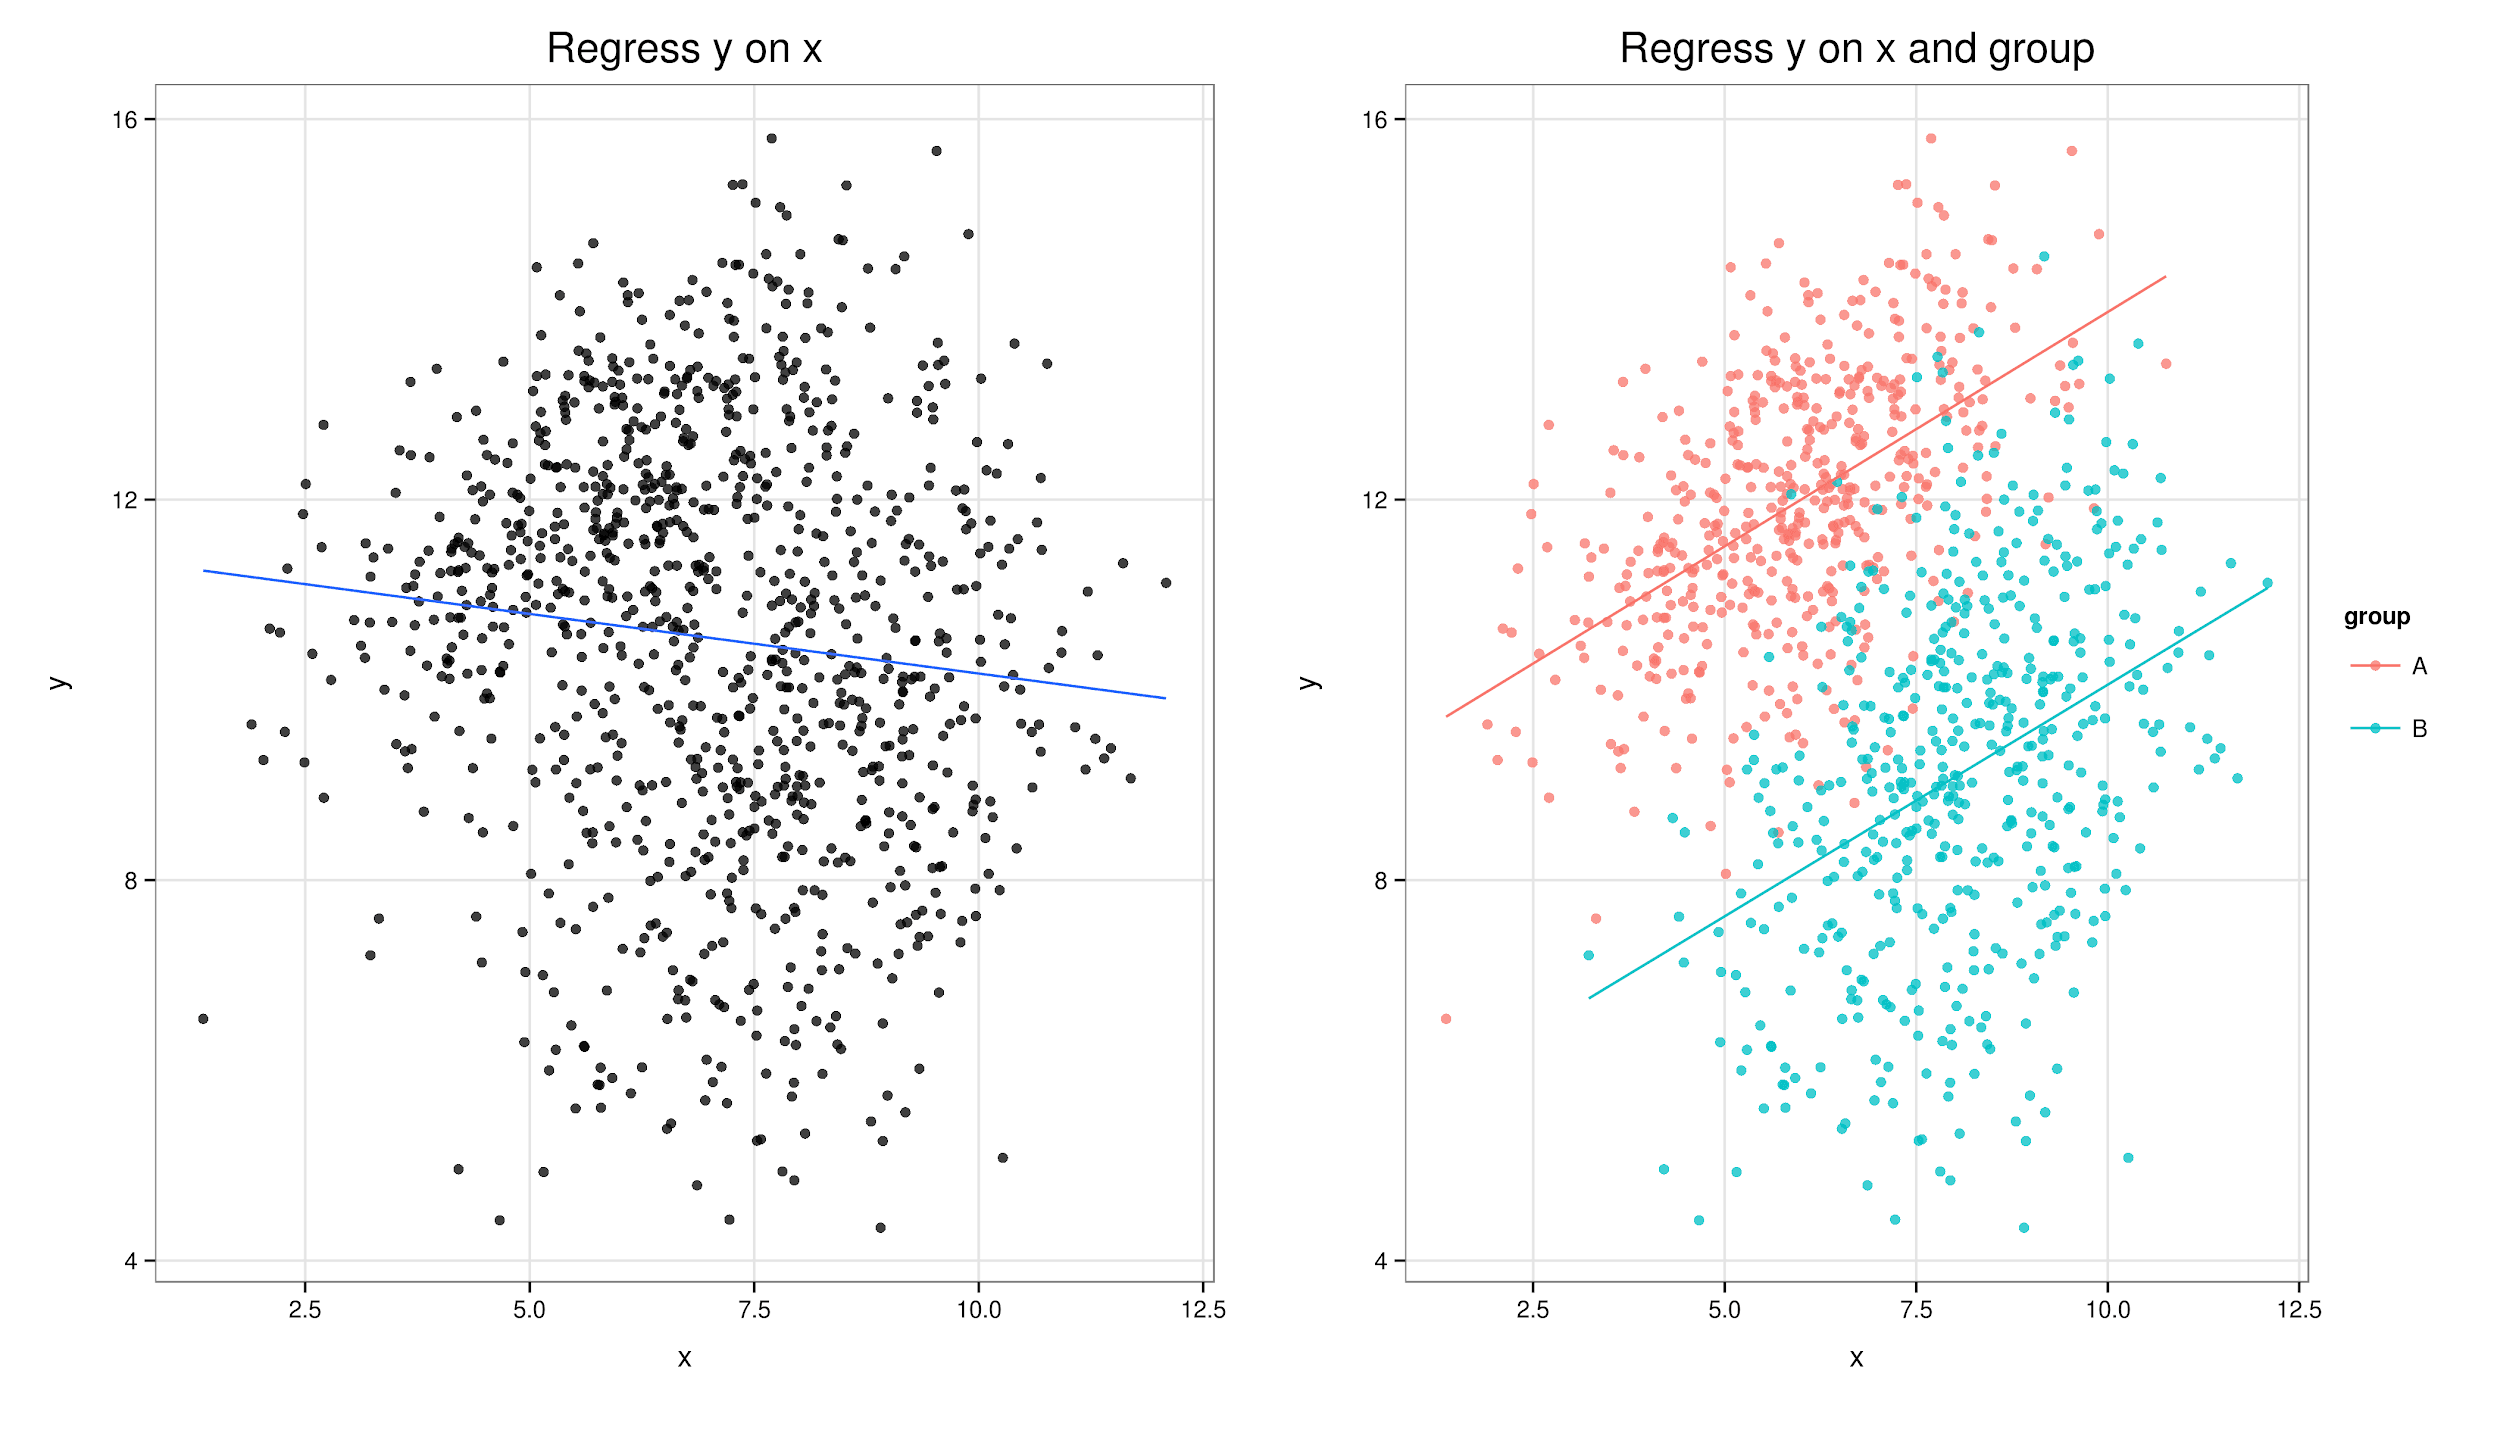
Simpson’s Paradox
Data can also mislead in more subtle ways if you don’t examine it critically enough. Simpson’s paradox comes in two parts:
- Fallacy of Division: What is true of the whole is not always true of the parts
- Fallacy of Composition: What is true of the parts is not always true of the whole
Some real-world examples of Simpson’s paradox include:
- In the United States, average incomes have risen since 2000, even though earnings for every education bracket have declined
- In 1986, a study found that non-invasive kidney stone removal had a higher success rate than traditional open surgery, yet doctors determined (correctly) that open surgery was the better standard option.
- Voters with incomes above $50,000 were more likely to vote for Trump than Clinton than voters with incomes below $50,000 in 2016, yet political scholarship as well as conventional wisdom attribute support for Trump to frustrated working-class voters.
In each of these cases, a superficial analysis of the data misses a lurking variable that divides the data into meaningful categories. For instance:
- In the US, people with bachelor’s degrees have (and still do) earn more than people without postsecondary education. More and more people have achieved bachelor’s degrees and other forms of postsecondary certificates in the past two decades, meaning that the average person now earns more. However, competitive pressures have also lowered earnings at every educational level. The lurking variable, in this case, is the proportion of the population in each educational level
- Less-invasive surgeries are generally performed on less severe cases of kidney stones, explaining the higher success rate. The lurking variable here is the severity of the initial illness.
- Voters earning less than $50,000 disproportionately include ethnic minorities who typically vote Democrat and live in urban counties. White, exurban working-class voters favored Trump. The lurking variables here are race and urbanicity.
In business, Simpson’s paradox can lead to anything from apparent violations of supply and demand to fallacious conclusions about the ideal characteristics of your team members.
Data Literacy
With the sustained and explosive growth of data from websites, applications, devices, and sensors, data literacy is more essential than ever for organizations to remain competitive and innovative. You can achieve this by making data accessible at all levels, and by familiarizing your team with mental models to use data to make sense of the world. We have covered only the tip of the iceberg in this article. Many adventures lie ahead!


