Global Return Asset Management commentary for the month ended June 30, 2019, discussing their risk management process.
Dear Friends and Partners,
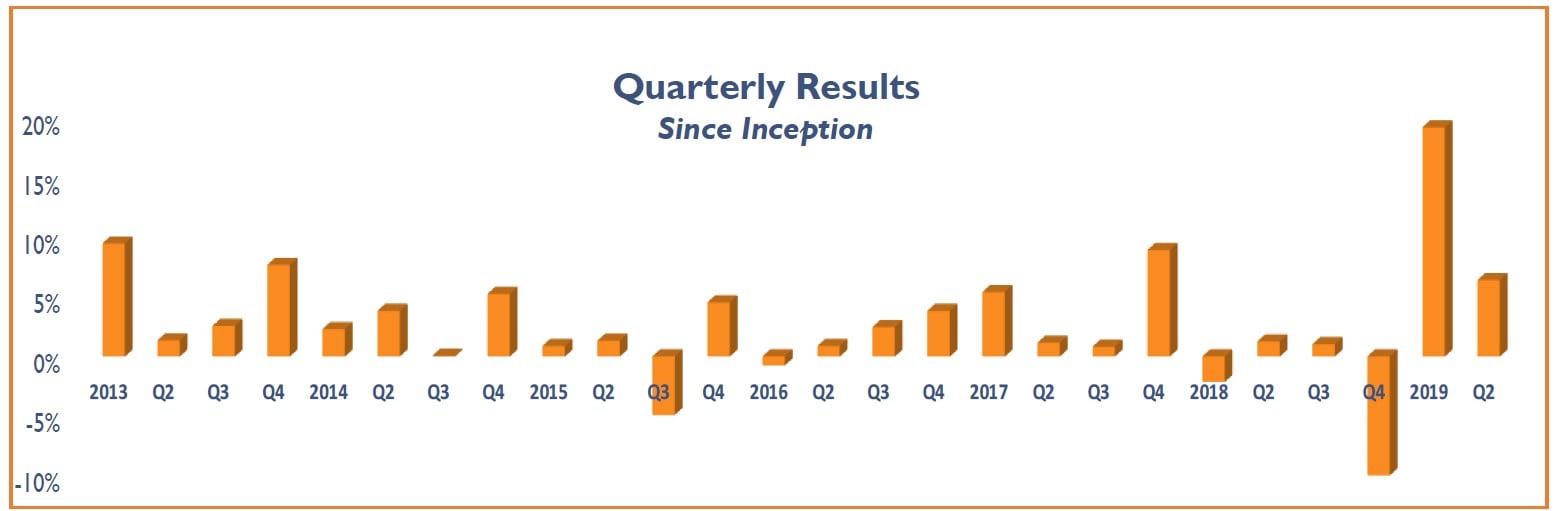
In June we generated a net return of 6.6%, bringing our year-to-date net return to 27%.1
We ended the month with 22% of assets in Cash and a net market exposure of only 16%.

Q2 hedge fund letters, conference, scoops etc
Our strong performance is the result of our risk management process, which I discuss in further detail below.
Managing Portfolio Risk
Risk management is the core of our investment process. I’ve never understood why the investment industry separates “investment management” and “risk management”, as if these two are different. Investing is the act of purchasing risk and it’s this risk that generates a return. Think about it: Are there really riskless returns? Of-course not. Most people, including some of you, view us as investment managers, but in reality we’re risk managers.
Below is one example of how our risk management process enables us to consistently deliver the results we have and do this with minimal risk.
Prior to buying stock in a company I develop an “Investment Report”. This document has several sections and contains information about the company and its industry. One section is titled “IV” (which stands Intrinsic Value). In this section, I write-out “instructions” for how to manage an investment when it achieves its intrinsic value. Here, there are several options to pick from: do nothing, sell or reduce the position, add to the position, or reevaluate the position using our “Decision Facilitator”.1
In April one of our holdings reached its intrinsic value and the IV called for re-evaluating the position using our Decision Facilitator. Many inputs are fed into the Decision Facilitator, including potential risks; these inputs are then probability-weighted and produce instructions for how to manage the position.
In this example, the Decision Facilitator indicated two reasons I should sell half the position to realize our open profits. First, the risk/reward ratio had shifted to near even odds.2 And second, a risk was looming that if ignited, and based on the probabilities, would cause the stock to decline. Consequently, we sold half the position for a 31% return.3 Two months later the stock declined 17%. The reason for the decline was that the risk we had previously evaluated came to fruition. Excluding the realized profit of 31%, we’re up 24% on the position.3
Note: It should not be surprising that when a holding achieves its intrinsic value, the risk/reward ratio has shifted away from us. This is because we buy stocks when the odds are significantly in our favor (the risk/reward ratio is asymmetric) and as the gap between the stock price and intrinsic value closes the risk/reward ratio shifts to even odds.
This example illustrates three key features of our risk management process:
- Successful risk management requires planning. Having predefined instructions that detail how to manage an investment, and what to do and when to do it, is critical for successful investing. You expect your Superbowl team to know which play they’re going to run when they’re on the 5-yard line, right? Our Investment Report is our playbook for what to do and when to do it.
- Managing risk isn’t just about minimizing losses, it’s also about protecting profits. Selling half the position for a 31% return contributed 21 basis points to our portfolio.3 Had we not reduced the position prior to the 17% decline, the impact to our portfolio would have been 75 basis points.
- Every investment has known unknowns and unknown unknowns.4 Effective risk management must include a premortem of the investment that includes a plan for the unknown unknowns. Acknowledging the existence of unknown unknowns and having a plan to respond to these might be the single greatest contributor to our risk-adjusted returns. As illustrated in this example, this is when our Decision Facilitator is most useful.
Managing for Systemic Risks
In addition to managing risks within the portfolio, we attempt to shield it from external risks, like the broader markets.
Within the broad markets, there are both positive and negative economic fundamentals. Though it’s difficult to isolate one risk, because of our interconnected global economy, I think the greatest systemic risk in our economy are corporate debt levels.
Corporate debt levels are the greatest threat to our economy because liabilities on a company’s balance sheet can act like an anchor to a boat that’s taking on water. Should our economic boat begin taking on water, these liabilities could sink the economy.
Corporate Liabilities
Unfortunately, simply looking at corporate debt levels doesn’t offer an accurate view of the market fundamentals. Second-level analysis is critical for investment success, which is why I dissect the data I analyze; doing this provides a more accurate and broader understanding of the data. So, let’s dissect corporate America’s debt.
Over the last 30 years, the U.S. has had three recession, each of which was followed by a period of economic expansion. During each expansion period, corporate America consumed larger amounts of debt. But not all debt is equal: Let’s review the debt that’s been amassed during the last eight years by the largest 1,000 non-financial companies (by market value) in the U.S.
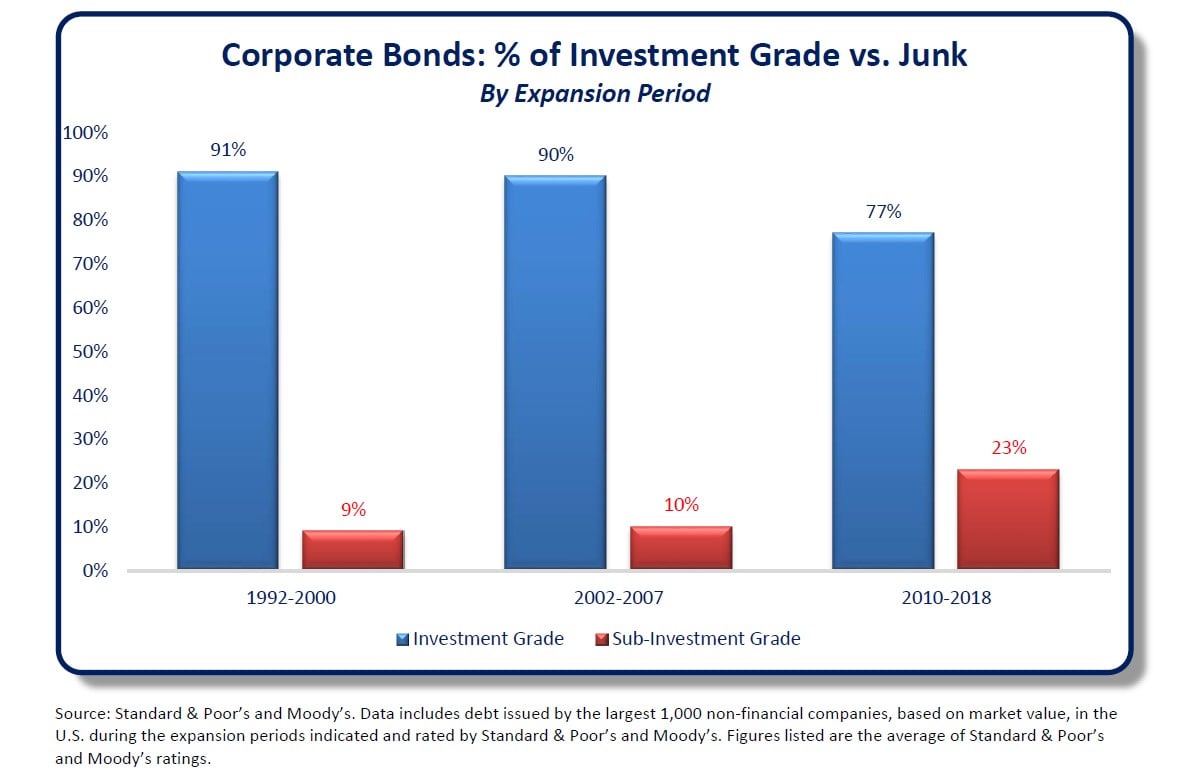
The chart below shows the quality of debt amassed during each expansion period.
According to Standard & Poor’s and Moody’s, of the debt issued during the most recent expansion, only 77% is investment-grade and the remaining 23% is junk. Said differently, the amount of junk debt in our economic system is more than double the previous expansion periods and represents nearly one quarter of all outstanding debt in our economy.
One could argue that debt levels don’t matter – what matters is the ability to pay those debts. And I agree with this. To determine whether companies can afford to pay these debts let’s review the Interest Coverage Ratios (ICR).
Here, we must dissect the data further because simply calculating the ICR for the debt shown above wouldn’t provide an accurate view of the underlying fundamentals. This is because distressed, or not distressed, ICR levels are industry-specific, owing to industry fundamentals and similar debt covenants across industry participants.
What’s more, knowing an industry’s average ICR is still insufficient. This is because an industry’s average ICR is merely just that – an average. It wouldn’t tell us the quality of the debt or whether any of it is at risk of default.
After refocusing our microscope enough times, we find in this table an accurate representation of the systemic risk in our economy.5
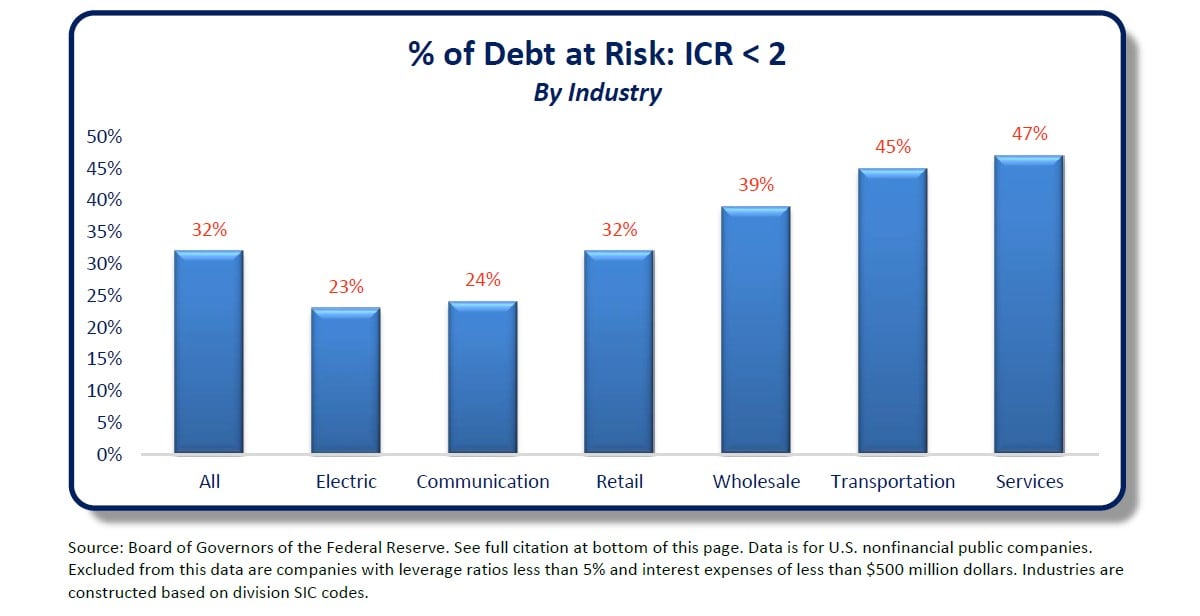
This data is sobering. Top-down investors should heed caution. Thankfully, we’re bottom-up value investors focused on risk management; systemic risks like this will have minimal impact on our portfolio because our risk management process consciously avoids these risks.
It’s true that broad market declines could impact our portfolio, but the intrinsic value of our holdings will not be reduced. Paradoxically and not surprisingly, we welcome these types of irrational price declines because we’re able to buy more stock with less money. Plus, we buy insurance to protect us during these declines…
Portfolio Insurance: We’re Net Short
Have you ever tried to guess what your spouse or partner wants for dinner? I’ll wager that none of you could successfully do this seven nights in a row.
How then are people able to successfully guess which direction the market will go? And when?
To the casual observer, these questions may seem ironic since we’re net short the market. They might say, “Clearly, your portfolio indicates you’re making a directional call to occur in a specified period of time.”
But this isn’t true. I make no attempt to guess when the market will go up or down and by how much.
The discerning observer would see something entirely different because h/she understands the differences between probabilities, expectations and asymmetry. And as a risk manager, I focus on how these could impact our portfolio in the context of the broader markets.
Here’s an illustration of why we’re net short the market:6

But don’t let these numbers fool you. Probabilities aren’t really about specific odds because odds change all the time. Probabilities are about acknowledging the existence of a myriad of potential outcomes and then planning for those outcomes. We call this “insurance”.
When considering whether to buy insurance because of, for example, systemic risks in the economy, more important than the probabilities I assign to an outcome are the degree of confidence and the variance of the expectation I have of the outcome. Once I ascertain this, I combine it with an option’s Greeks (namely the delta and gamma), the size and unrealized value of our long stock positions and the cost of the hedges. The sum of these will inform me whether insurance is warranted. And based on our CAGR since inception and exposure to systemic risks, I think we’ve been prudent when purchasing insurance.
Conclusion
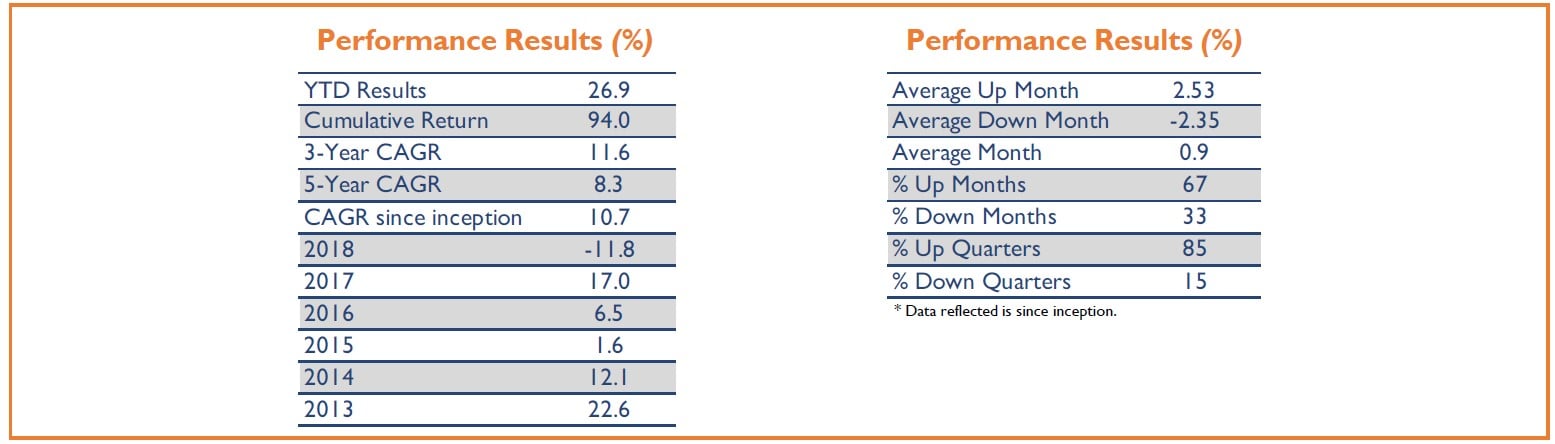
Though we’re having an excellent year, we maintain that we should be evaluated on our long-term results, such-as our CAGR since inception. This is how I view our results and judge my performance. I prefer this metric because I want to create sustainable wealth and recognize this is accomplished through long-term compounding.
Please feel free to contact me if you would like to discuss our risk management, technology or portfolio.
Respectfully,
Elliot Trexler
This article first appeared on ValueWalk Premium


