Bonhoeffer Capital Management commentary for the second quarter ended June 30, 2019, discussing their case study on Gray Television, Inc. (NYSE:GTN).
Dear Partner,
Bonhoeffer returned 2.7% net of fees in the second quarter of 2019, compared to 4.1% for the MSCI World ex-US, an international benchmark. As of June 30th, our securities have an average earnings/free cash flow yield of 24.7% and an average EV/EBITDA of 3.4. The MSCI World ex-US has an average earning yield of 6.6%. The difference between the portfolio’s market valuation and my estimate of intrinsic value is still very large (greater than 100%). I do not know when this gap will close but, over time, the gap should converge.

Q2 hedge fund letters, conference, scoops etc
As the summer temperatures rise, the markets appear to be basking in the summer warmth, but the real test will be when the next decline occurs.
We will be holding our annual meeting in New York City on Tuesday, September 17. Current investors will be receiving invitations with additional details shortly. We will also have a limited number of seats available for prospective investors. If you are a prospective investor and are interested in learning more, then please let my colleague, Jessica Greer, know.
Bonhoeffer Fund Portfolio Overview
Bonhoeffer’s investments have not changed significantly in the last quarter. Our largest country exposures include: South Korea, Italy, South Africa, Hong Kong, United Kingdom, and Philippines. The largest industry exposures include: distribution, consumer products, telecom, transaction processing, real estate, and media.
Since my last letter, we have added to one position in a local TV broadcast firm which I’ll detail in this letter. I remain excited about some firms we are investigating in Mexico, Georgia, South Korea, and South Africa.
Value-unlocking Event: Teekay Offshore Partners L.P. (TOO)
We laid out our thesis on Teekay Offshore in our Q1 2018 letter. Since that time, Teekay has progressed with its operational turnaround as theorized. We’ve seen the refinancing of shuttle tanker debt at a 5% interest rate, the purchase of additional shuttle tankers to support offshore demand in Canada, the settlement and associated payment from Petrobras on cancelled leases, and an improved offshore market—all of which has contributed to the turnaround.
On May 17, 2019, Brookfield Business Partners (Teekay’s sponsor) made a “takeunder” bid for the Teekay Offshore Partners L.P. units it did not own for $1.05 per LP unit, the same price the distressed former sponsor (Teekay Corporation) was paid for its remaining 14% stake in Teekay Offshore. We have signed a letter addressed to Teekay’s conflicts committee, prepared by JDP Capital, stating our objection to the low “takeunder” bid and presenting the rationale for a value of at least $4.00 per LP unit for Teekay Offshore. The details of the letter can be found here. The conflicts committee has not responded to the letter as of quarter-end. We are hoping to have something to report in our next letter.
Local Industries and Barriers to Entry
Of late, I have been pondering and reading about local markets and the competitive advantages they present. In the book Competition Demystified1, the authors describe and provide illustrations of factors that generate competitive advantages like supply advantages, demand advantages, and economies of scale. Low-cost supplies in natural-resource businesses and patent protection in pharmaceutical businesses are examples of supply advantages. Software and internet businesses illustrate demand advantages when considering customer captivity due to the prohibitive nature of switching providers and the network effects of other users. And microprocessor businesses provide an example of economies of scale when an incumbent can spread large fixed costs across a larger customer base than potential entrants.
These advantages can be monetized to their maximum extent if there are barriers to entry from other market participants. In most cases, firms only have one or two of these competitive advantages in a regional or local market or industry segment. Most markets are brutally competitive due to the lack of barriers to entry; thus, the competitive advantages mentioned above are the exception, not the rule, for most firms.
An interesting example of regional advantages is the dominance of either Coca-Cola or Pepsi in various markets around the world. Coca-Cola dominates markets like Argentina, Brazil, Indonesia, and Mexico, while Pepsi is dominant in Vietnam and Pakistan. These advantages are primarily due to local economies of scale in each market.
A historical example of segment advantage is Microsoft’s profitability in certain market segments (operating system and productivity applications). In 2015, Microsoft made 85% of its gross profits in licensing its operating system and productivity applications (i.e., Word, Excel, PowerPoint) with 92% gross margins in these segments. The remaining segments generated 15% of gross profits with 24% gross margins. With 45% operating expenses, operating system and productivity applications are generating more than 100% of the profits.2
In a market with many small competitors and significant fixed costs, a dominant market share can be achieved via economies of scale; and it can become defensible if there is a degree of customer captivity. The best way to do this is to establish dominance in a local area and then expand outward from there. I have observed this in some of our car dealerships, telecommunication services, and TV station holdings. The market area where competitive advantage exists is the area where costs are fixed and where the fixed cost is incurred to reach the customer.
The key to local scale is to focus on local markets and avoid the temptation to be in other markets where your scale advantage is smaller. If you look at car dealerships, this approach of local-market focus has resulted in firms with the highest revenue per location and higher operating margins. One firm who is smaller than most but focused on fewer markets—Asbury Automotive—has the highest margins amongst new and used car dealerships.
According to Competition Demystified, competitive advantage is obtained in different ways depending upon the growth of the market. In slow-growing markets, advantage is obtained via economies of scale. This means advantages go to firms who can spread cost categories with large fixed costs (e.g., advertising, distribution, or servicing a customer base) within a geographic or niche area across more units. Firms with these advantages should defend these areas vigorously with price cuts and also shift as many costs from variable to fixed as they can to maintain the advantage.
In fast-growing markets, advantage is obtained by customer captivity. Customer captivity can be increased by habit formation (facilitated by loyalty programs), increasing switching costs (e.g., by adding ancillary services), making search more difficult or expensive, or network effects (for example in social networking firms such as Facebook). One limitation of network effects is their effects only extend so far as the network extends. So in the case of social networks, Facebook’s network is not as effective in countries such as China and Russia.
This quarter’s case study will be an example of local competitive advantage in a mature market which hides the firm’s growth potential. The firm is Gray Television and the market is the local broadcast television market in the United States.
As always, if you would like to discuss any of the philosophies or investments in deeper detail, then please do not hesitate to reach out. Until next quarter, thank you for your confidence in our work, and have a fun summer.
Warm Regards,
Keith D. Smith, CFA
Case Study: Gray Television (GTN)
Gray Television is a collection of local broadcast television stations in the United States. Gray has 150 network-affiliated stations in 93 markets, primarily in the small- to mid-sized markets, with 26.6 million households. Gray has the number one or two audience share stations in 87 of Gray’s 93 television markets. Gray has the highest broadcast and political revenue per household over any local TV station group. Gray Television has the largest local competitive advantage amongst local TV station firms.
In addition, with Gray Television, there is an opportunity to purchase a voting share class (the A shares) for an 8% discount to more liquid nonvoting shares.
Also, given Gray’s leverage, Gray is a private LBO (as described in the Q1 2018 letter) with many of the characteristics of 1980s private equity LBO firms, with an EV/EBITDA multiple of 6.8 and debt/EBITDA of 4.7x. The early LBOs, which were the most successful, had purchase prices of 6x to 8x EBITDA with 3x to 4x EBITDA put on them.3 Based upon current projections, Gray’s debt/EBITDA is expected to decline into the 4.0x’s by year-end 2019 and into the 3.0x’s by year-end 2020.
The local television business is a moated business that is being disrupted in most countries due to their dependence on advertising revenues, lack of political revenue, and lack of must-carry rules by local cable firms. A disruption occurs because advertising revenue is being diverted to more targeted online audiences. This can be seen in Australia with Prime Media and Canada, where similar regional television firms have declining revenues and cash flows. This disruption can also be seen in radio station groups in the United States whose revenue is primarily based upon advertising despite large audience reach. In the US, local television firms have five advantages when compared to more advertising-based revenue models in other countries.
First, the US groups have re-transmission fees, which are fees paid by cable companies to local station groups for their content. These fees are the result of must-carry rules imposed upon US cable companies. Re-transmission fees are significant portions of local TV groups’ revenues. Local firms also have to pay reverse re-transmission fees back to the networks for their content. For Gray, they represent 30% of 2018 revenues. Also, when an acquisition happens, the acquirer gets the best terms negotiated by either the acquirer or the target for all the combined stations in the portfolio. Recently, cable subscribers have been replaced by video services with over-the-top (OTT) content packages. In most OTT content packages offered by the cable companies, the local station affiliates are included. During Q1 2019, the number of new OTT customers more than offset the decline in video cable subscribers.
Second, the US groups benefit from local spending by political campaigns, especially in swing states. Gray’s footprint includes many swing states and districts across the United States. Political campaigns are interesting clients as they have little incentive to not spend all the money they have collected from donors before Election Day. Gray has the highest political spend per household versus the other local TV broadcast groups due to the location of its geographic footprint. Politics in most other developed countries is either publicly financed or not as contentious as politics in the US.
Gray also has higher local density than other local TV broadcast firms which leads to the highest broadcast revenue per household ($78.28 per household) amongst other local TV broadcast groups. Gray’s high local density also leads to higher EBITDA margins (37%) versus the other local TV broadcast groups. The geographic distribution of the US population is what has created this advantage in the US versus other countries.
Third, US groups own the spectrum on which they broadcast. This allows them to sell the spectrum to third parties or to sell underperforming stations to others based upon their stick or spectrum value. An example is the 2017 sale of spectrum to cell phone companies, for which Gray netted $90 million. In other foreign countries, the broadcasters lease spectrum from their governments.
Fourth, US groups have more local advertising opportunities as more of the US population is in nonurban centers than other countries. Also, television is as effective as the internet in reaching these nonurban customers.
Fifth is the rollout of ATSC 3.0 (a TV broadcast format) later this year. With the rollout of this format, local television stations will be able to reach mobile tablets and phones in addition to delivering enhanced pictures to newly enabled televisions. The format will also be able to provide feedback to broadcasters such as who is watching their programming, thus allowing for more targeted advertising similar to today’s online advertising platforms. ATSC 3.0 will also provide a platform for local broadcasters to provide more services to viewers and advertisers.
Finally, there are well-defined cost and revenue synergies that buyers obtain in acquisitions of other local TV groups. These include cost station synergies (like common news and weather staff) and corporate synergies (like back-office finance and administrative staff), elimination of duplicate services, and technology/digital savings. The major revenue synergy is the step-up of either acquired or original station re-transmission fee agreements to the highest negotiated rate with the cable companies and the lowest reverse re-transmission rate with the networks. Gray and Nexstar have been the major beneficiaries of these synergies over the past few years. While Nexstar is approaching the FCC ownership cap, Gray is significantly below the current FCC ownership cap, so it can continue to acquire TV stations going forward.
US Local TV Business
Sources of growth for Gray include TV advertising growth, re-transmission fee growth, and acquisitions. The combination of TV advertising and re-transmission fee growth will provide for an organic growth rate of 3.3% for Gray over the next five years, per Kagan industry growth estimates. Gray is significantly under the 39% household reach FCC limit at 17% of household reach. Therefore, acquisitions will be able to conservatively add 5% per year growth. They have added 20% per year over the last ten years.
Gray has utilized the local scale model to generate $78.28 per household of television advertising versus $48.00 for Nexstar, $56.50 for Sinclair, $55.76 for TEGNA, and $41.14 for Scripps, despite being smaller than all of these firms other than Scripps. Local economies of scale have also resulted in Gray having the highest margins amongst the local TV station groups.
Downside Protection
Gray is a leveraged firm, but the debt level is manageable with an EBITDA coverage ratio of 3.4x, growing EBITDA, and a current debt interest rate of 5%. Gray also has the potential upside of realizable cost and revenue synergies from future acquisitions. These benefits are available to firms under the FCC household limit of 39%, Gray being one of the firms in that group.
Another defensive characteristic of Gray is the station footprint which is located in many swing states and districts across the US. This fact leads to Gray having the highest political revenue per household ($8.72) of any US station group, which ranges from $4.27 to $6.26 per household.
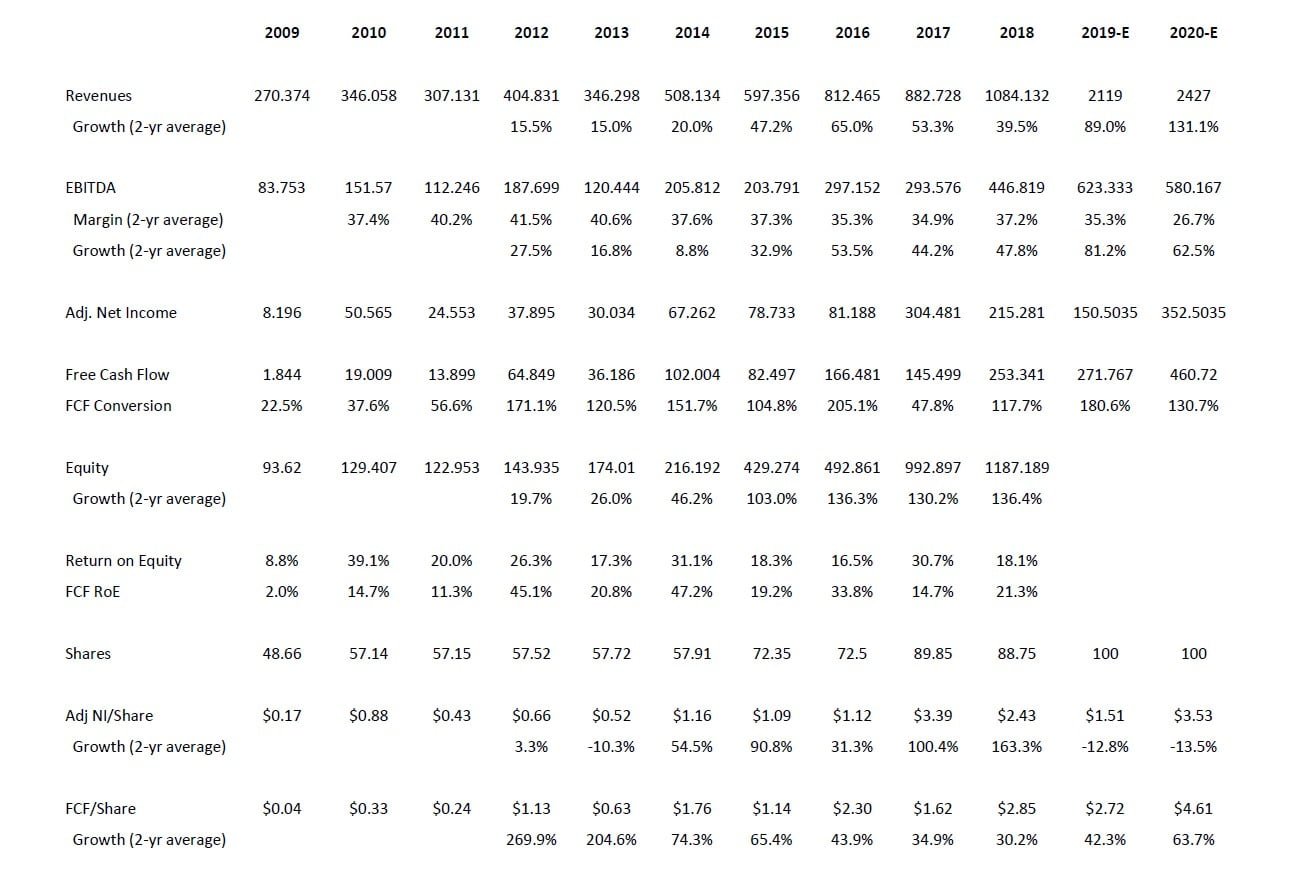
Gray has expanded its US geographic footprint which has diversified the regional sources of revenue while also increasing local economies of scale. The history and projected financial performance for Gray is illustrated below:
Management and Incentives
Gray’s management has been focused on the smaller and mid-sized TV markets in the United States. Historically, Gray’s acquisition strategy has remained focused on this segment of the market. Management has stock ownership guidelines for its executives where the CEO needs to hold 6x his base pay and named executive officers need to hold 3x their base salaries. The senior executives have incentive pay based upon enterprise value, revenue, broadcast and EBITDA growth, and reduction in leverage ratios and interest paid on Gray’s debt. The CEO currently holds 3.476 million shares ($59.5 million).
Valuation
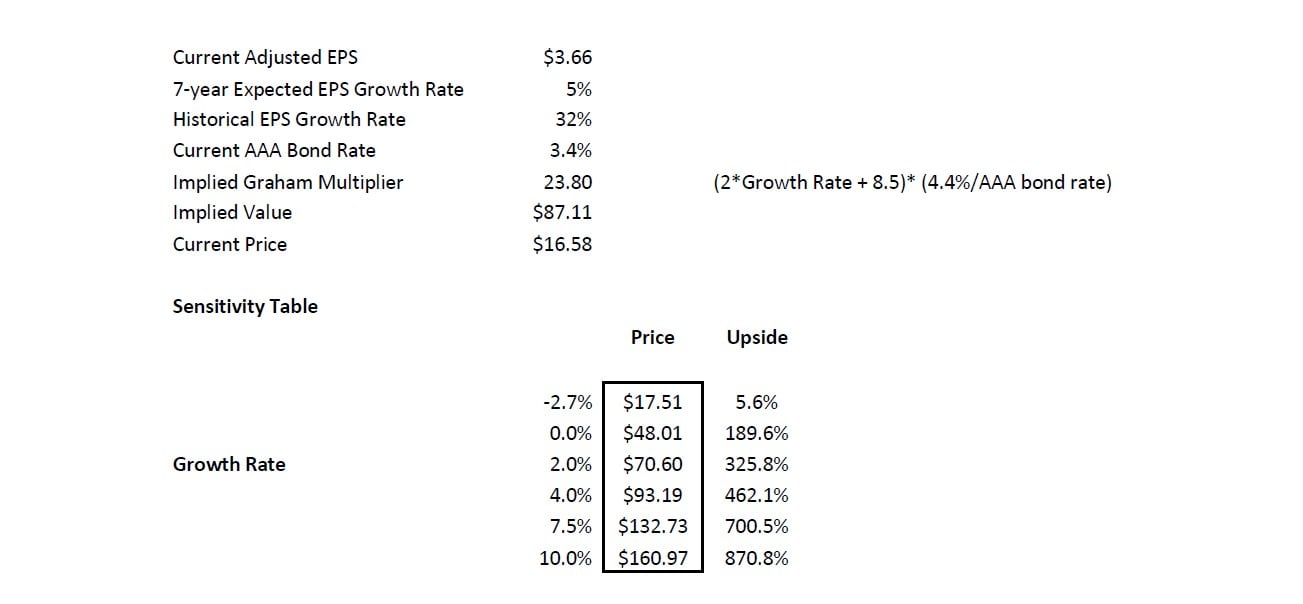
The key to the valuation of Gray Television is the expected growth rate. The current valuation implies an earnings/FCF decline of 2.7% into perpetuity using the Graham formula ((8.5 + 2g)*(4.4/AAA bond rate)). The historical ten-year FCF growth has been 25% per year including acquisitions, with a current return on equity of 33%.
A bottom-up analysis based upon market growth rates of re-transmission and the overall TV ad market results in an organic growth rate of 3.3% for Gray. However, Gray still has plenty of room to acquire stations before it hits its regulatory limit of 39% of households; so growth by acquisitions should continue for Gray. This could add from 3% to 7% growth over the next seven years, resulting in a total growth rate of 6% to 10% per year. The resulting current multiple is from 26.4x to 36.7x while Gray trades at an FCF multiple of 3.8x. If we look at firms with lower growth rates (Tribune and TEGNA), they have FCF multiples of 9x to 10x FCF. If we apply 9.5x FCF to Gray’s two-year average historical FCF of $3.66, then we arrive at a value of $35.00 per share, which is a reasonable short-term target. If we use a 5% seven-year growth rate, then we arrive at a value of $87.11 per share. This results in a five-year IRR of 39%.
One way to include the probability of default, since we are late in the credit cycle, is to apply a BB rating (Gray’s current credit rating) five-year default probability of 12% to the five-year target derived above. The resulting value is $76.66 per share. This results in a five-year IRR of 36%.
Comparables
Below are the US and international firms engaged in the local broadcast television market. One item to note is the lower international margins due to the more competitive international markets.
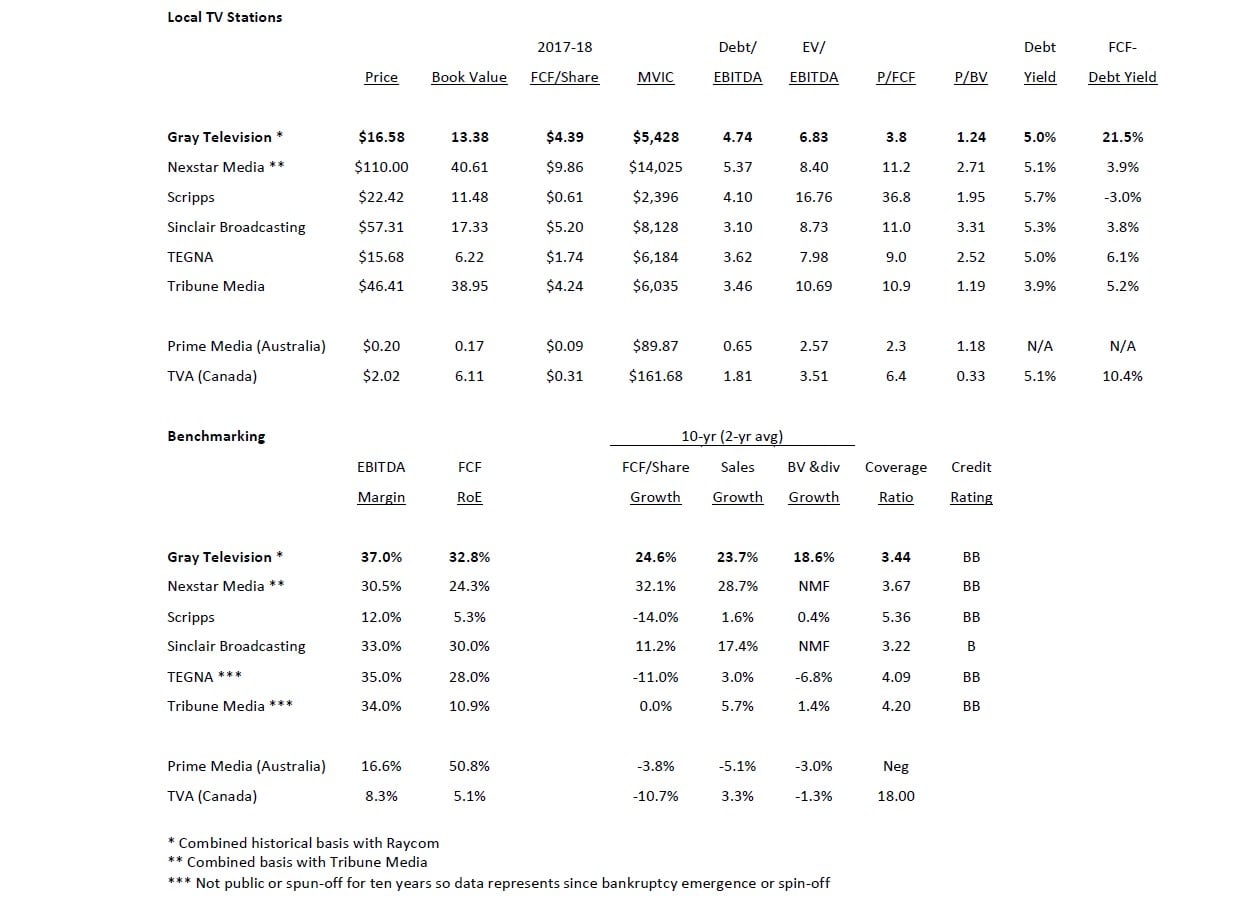
Benchmarking
Compared to other local television station groups, Gray has the highest EBITDA margins, FCF return on equity, and the second fastest FCF per share and sales growth rates. It has a reasonable coverage ratio and a BB credit rating. Gray also has the largest debt to FCF yield spread of 21.5%. This spread is much larger than the current US equity risk premium of 5%, so the market is valuing cash flows from the same firm at two different discount rates. In this case, the debt cash flows are being discounted at 5% while the equity cash flows are being discounted at 26.5%. Typically, the debt holders are better underwriters of risk and return than equity holders; thus, I think the equity holders are incorrect on their valuation.
Risks
The primary risks are:
- Default in the next credit downturn (a BB-rated firm has a 12% five-year distress probability); however, this risk will be mitigated by rapid debt paydown over the next few years
- Faster cable video subscriber declines than offsetting OTT subscriber increases
Potential Upside/Catalyst
- Buyout/merger with another media/internet firm
- New ATSC 3.0 services
- Increased local scale or purchase of local scale in new markets
Timeline/Investment Horizon
The short-term target is $35.00 per share, which is almost double today’s stock price. If the consolidation thesis plays out over the next five years (with a resulting 5% FCF growth per year), then a default adjusted value of $77.00 could be realized. This is a 36% IRR over the next five years.
First posted on ValueWalkPremium


