Forge First Asset Management commentary for the month ended May 31, 2019.
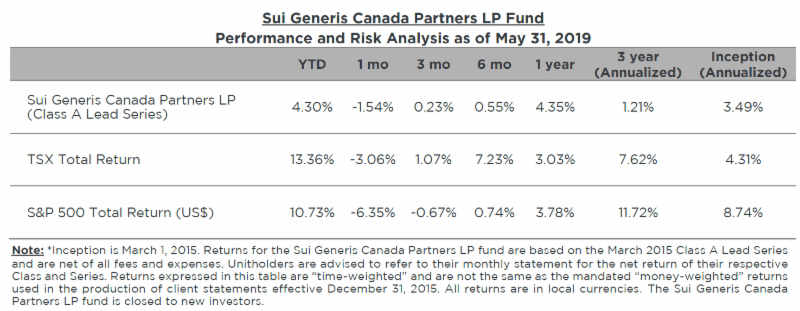
The Sui Generis Canada Partners LP fund was down -1.54% for the Class A Lead Series during May 2019, resulting in a year-to-date net return of 4.30% since inception (March 1, 2015) and cumulative net return of 15.67% (3.49% annualized).

Q1 hedge fund letters, conference, scoops etc
Forge First May 2019 Commentary
What a difference a month makes! During late April, complacency was widespread and the S&P 500 ended at a closing high. Now just five weeks later the focus for investors is assessment of downside risk as the S&P is now 2/3rds of the way to a 10% correction. Two concerns account for this reversal. First, trade, as Trump has now added skirmishes with Mexico & India to his fight with China. Second, there’s a growing realization that central banks may not be able to catalyze higher growth and inflation.
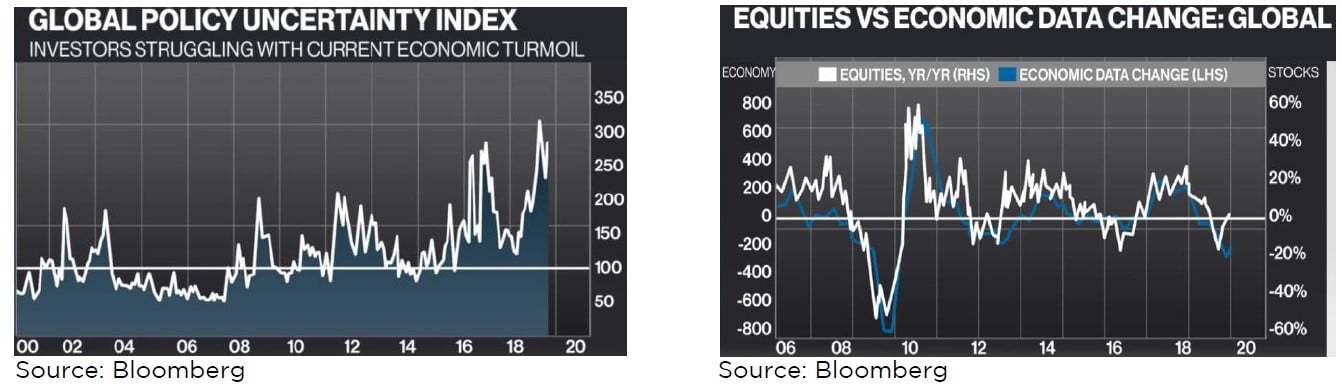
As a result, the graph on the above left shows that as of mid-May the Global Economic Policy Uncertainty Index sat near an all-time high. Likely to have risen since then, unless there’s a sea of change in Trump’s actions, uncertainty isn’t conducive to reversing the uncomfortable and rising spread between the Global Economic Data Change Index and the year over year percent change in Global Equities shown on the above right.
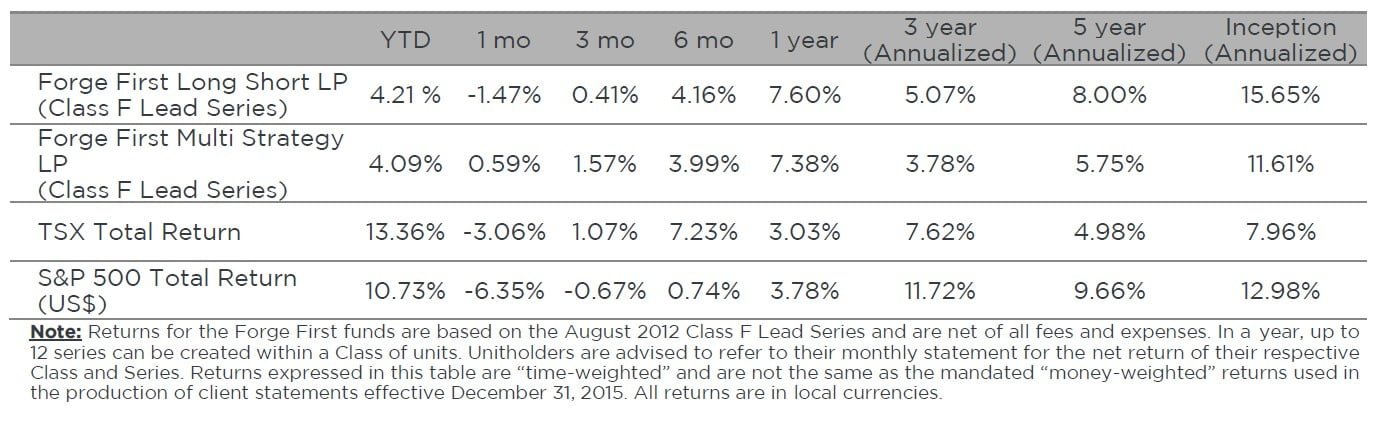
These facts explain why bond yields have plummeted, put option buying has skyrocketed and May was a sea of red for equity indices and most commodities. Canada’s TSX delivered investors a total return loss of -3.06% while all U.S. equity indices suffered losses greater than 2X that level, including a -6.35% decline for the S&P 500.
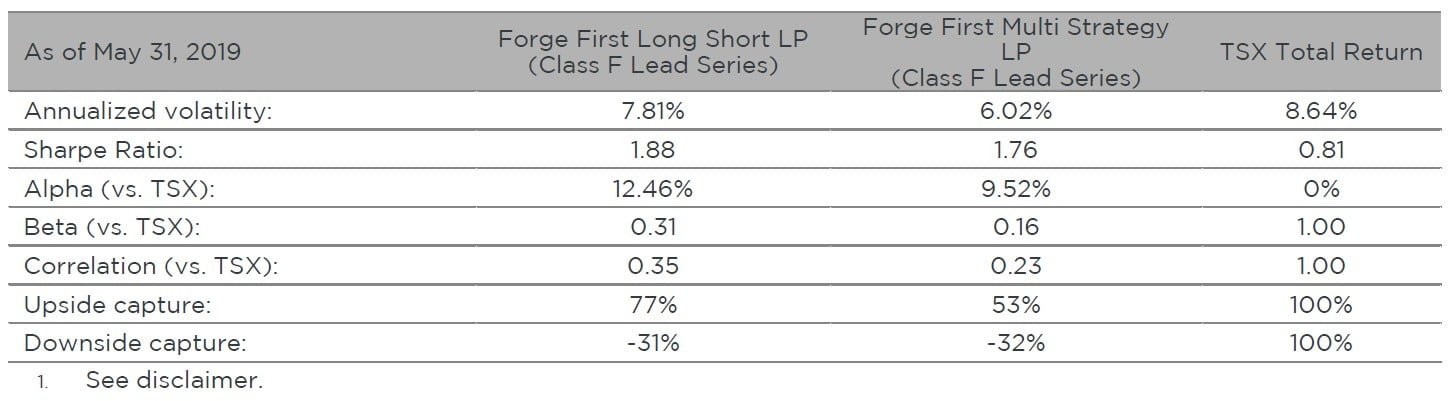
At Forge First, one fund was up and one fund was down. In May the Forge First Multi Strategy LP CL F Lead Series gained 0.59% net of fees, boosting its year to date net return to 4.09%. The 3 & 5 year annualized net return for this fund now sits at 3.78% and 5.75% respectively with a Sharpe Ratio of 1.76. Our other fund, the Forge First Long Short LP lost 1.47% net of fees for the CL F Lead Series, as the decline in the fund’s energy book offset gains in the remainder of the portfolio. Year to date, the net return for this fund sits at 4.21% while the upside downside capture of this fund remains strong at +77%, -31%, and its Sharpe Ratio is a solid 1.88.
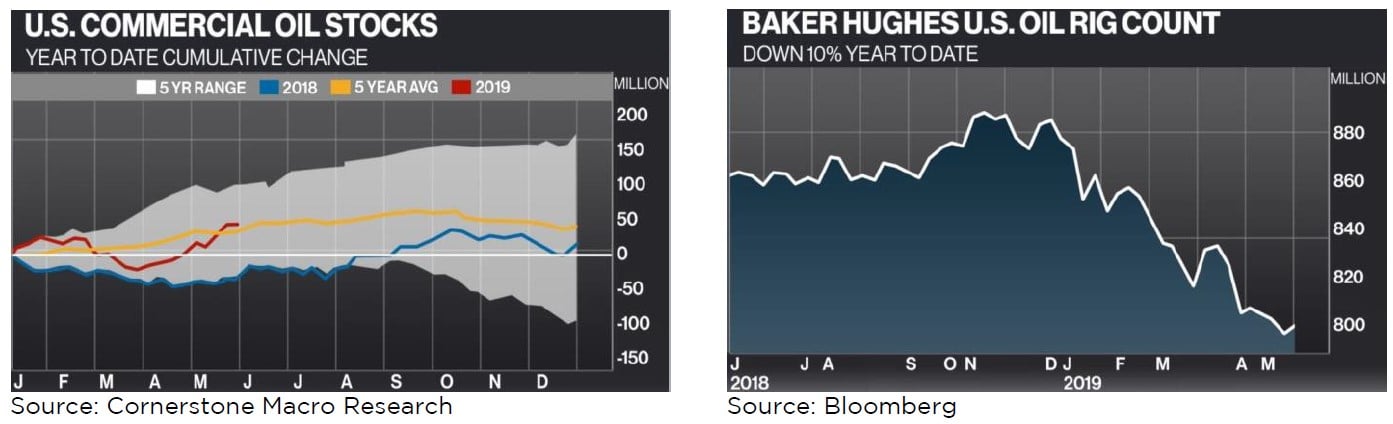
Besides the move in stocks & bonds, the other big move was in oil, down a staggering 16.3%. Being the largest sector exposure in Long Short, though not so in Multi Strategy, it’s safe to say that energy made the month an uphill battle for our Long Short fund. That said, the yeoman’s work done by the rest of our portfolio mitigated much of this damage.
As can be seen from the graph on the below left, U.S. crude inventories continued to build at an above average rate through May. While flooding in the U.S. Midwest forced refinery closures and unplanned maintenance combined to cut springtime demand, given the supply disruptions in Iran & Venezuela, the degree of inventory build is puzzling. Hence, clearly weaker economic data from China & the OECD plus the spectre of trade wars have catalyzed additional pressure on the price of oil. Meanwhile, a key item for the constructive outlook we discussed in last month's commentary, forward U.S. supply growth continues to be playing out, as the graph on the below right shows that the U.S. oil rig count has declined 10% year to date. However, for now we have reduced our energy exposure in Long Short, as while we're not yet in the camp that a demand killing global recession is imminent, there are many more warning signs than there were a month ago.
Looking at the performance for the rest of our portfolios, positive sector contributors included industrials, financials, consumer and materials. Our short book benefited handsomely from positions in Polaris Industries (PII.US) and various ETFs while our index put positions also made a significant positive contribution. While energy was our largest losing sector, the funds also lost money in technology and utility stocks.
Looking ahead, while the outlook for global policy turmoil is highly unpredictable, arguably making it imprudent to press short positions too hard, it’s clear markets expect growth and inflation to remain lower for longer. Markets have priced in just a 7% chance that U.S. inflation will print above 3% during the next five years while the ECB won’t push rates above 0% during the next 7 years. Yet markets don’t appear worried about deflation either, otherwise the price of gold and the Japanese yen could be expected to be higher.
There’s now more than US$11T of government bonds with negative yields, up almost 40% from year end 2018 and approaching 20% of total global government debt of US$63T. As shown by the graph on the below left, which begins last October, this total includes German 10 year bonds that closed last week with a yield of -0.21% (left axis), below the yields on Japanese bonds. It’s this relentless fall in Euro yields that has pushed yields on U.S. 10 year bonds (UST10) down 105 basis points (1.05%) during this time frame, similarly so on Canadian government bonds.
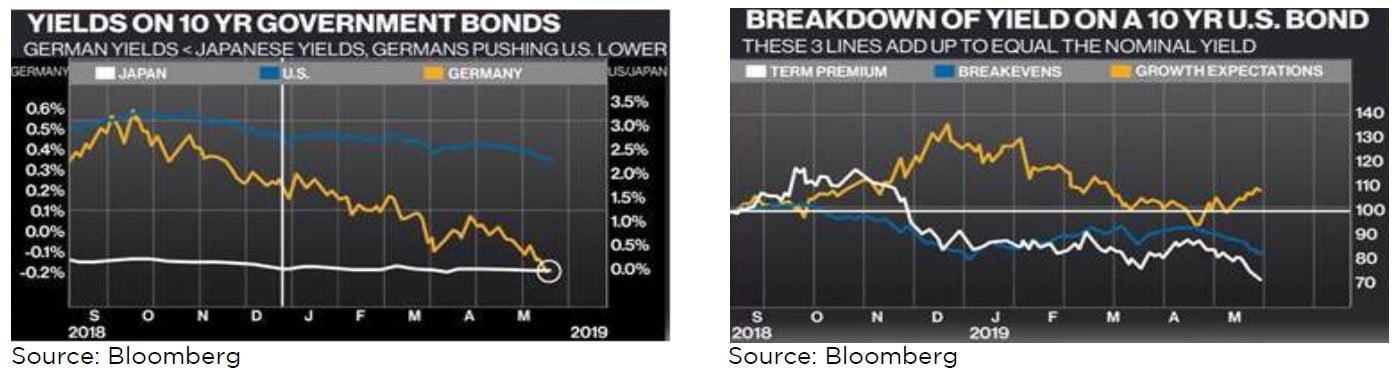
Further evidence that the fall in North American yields has been catalyzed by external factors is demonstrated by the graph on the above right. This indexed graph, which begins last September, disaggregates the UST10 between break-evens (a proxy for future inflation) and real yields, which are derived from expectations for growth and term premium. Notice how the view of the market towards U.S. growth has bounced back from its nadir in Q4, while the outlook for inflation has fallen, and the term premium has dropped sharply.
The term premium of a bond is typically driven by the level of foreign rates, safe-haven flows, supply, hedging and positioning. The relevance of this graph for equity investors is twofold. First, to date markets are buying the Fed’s pitch that the weakness in their preferred inflation indicator, the PCE Deflator, is transitory, or else the breakeven component would have fallen further. Second, the outlook for U.S. GDP growth has yet to crack, despite trade and policy uncertainty, the lagged impact of a strong U.S. dollar index and District Fed Q2 GDP forecasts averaging 1.4%. Post the 2.9% year over year growth in Q1 EPS for the S&P 500 (call profits flat ex-buybacks), excluding the energy sector, this combination suggests there’s further downside in profit estimates for the back half of 2019, given full year calls for 8% EPS growth.
So far for Q2, 71 S&P 500 companies have cut their outlooks while just 22 have boosted guidance, an ugly ratio of 3:2. Looking ahead to 2020, bottom up street consensus calls for EPS growth of 11%, likely aggressive this late in an economic cycle, unless the U.S. Dollar index weakens markedly or we see a reversal in the current negative trajectory of global growth.
It’s possible that a near term settlement on the trade front could alter this outlook for modest economic growth and range-bound markets but not likely. Also, while equities could rally on a cut in rates by the Fed, something already discounted in bond markets, beyond short term financial engineering it’s tough to fathom how a rate cut would be a bullish signal for the economic outlook nor how it could stimulate much incremental growth. As Citigroup strategist Matt King pointed out in a recent report, existing indebtedness, demographics & the changing composition of corporate spending (on IP versus plant & equipment) implies little marginal economic utility to further rate cuts. Global growth is tired, the world is leveraged and it strikes us that there is more downside versus upside optionality in the outlook.
Furthermore, besides trade wars the markets face many challenges including: waning optimism in China’s ‘green chutes’, the transition of power in British and E.U. politics, weakness in the E.U. banking system, and unpredictability in the U.S (an approaching debt ceiling deadline, potential government shutdown, and the 2020 Presidential campaign). So while we won’t be dogmatic about our conservative positioning, and will continue to revisit our rationale, we’re not going to focus on the noise. Instead, we’ll keep our heads down, research new ideas and continue to evaluate our core position such as Parex Resources (PXT.CA), Visa (V.US), Alimentation Couche-Tarde (ATD.B.CA) and Enviva Partners (EVA.US).
Please visit our website for information on our funds. Should you have any questions, please contact us.
Thank you,
Daniel Lloyd
Portfolio Manager
Andrew McCreath
President and CEO


