Crescat Capital letter to investors for the month of June 2019, titled, “On The Precipice.”
Dear Investors:
The US stock market is retesting its all-time highs at record valuations yet again. We strongly believe it is poised to fail. The problem for bullish late-cycle momentum investors trying to play a breakout to new highs here is the oncoming freight train of deteriorating macro-economic conditions.

Q1 hedge fund letters, conference, scoops etc
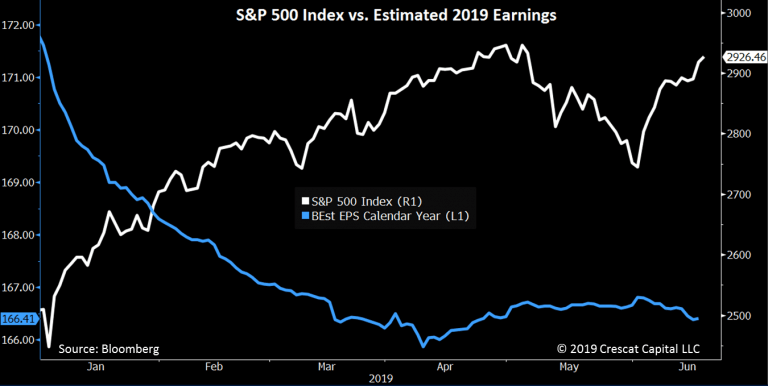
US corporate profit growth, year-over-year, for the S&P 500 already fully evaporated in the first quarter of 2019 and is heading toward outright decline for the full year based on earnings estimate revision trends. Note the alligator jaws divergence in the chart below between the S&P 500 and its underlying expected earnings for 2019. Expected earnings for 2019 already trended down sharply in the first quarter and have started trending down again after the May trade war escalation.
The NY Fed’s Empire State manufacturing survey of general business conditions just came out Monday registering the steepest ever monthly decline in the history of the series going back to 2001. The data was confirmed by a substantial disappointment in the Philly Fed Business Outlook survey which came out today. These surveys bode extremely ill for the more widely watched ISM Manufacturing PMI that will come out July 1 and could easily move into recessionary territory. Investors at large are looking at the glass half full by bidding up stocks on the news of Fed rate cuts to come. Late in the business cycle, history proves that it is much more important to pay attention to the reality of deteriorating economic data than the hope of Fed stimulus. Fed easing late in the cycle has never been bullish. At record valuations today with ailing macro data, it is extremely bearish.
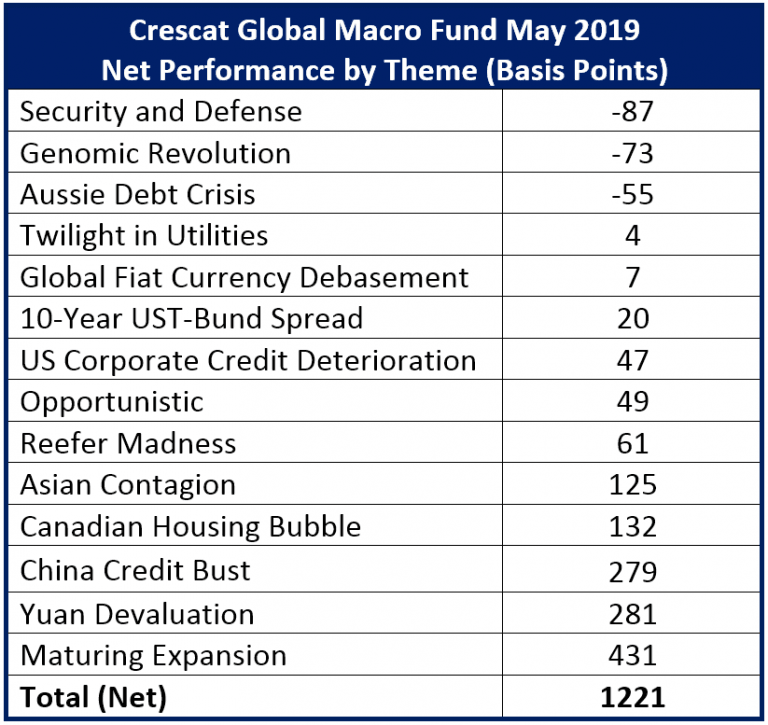
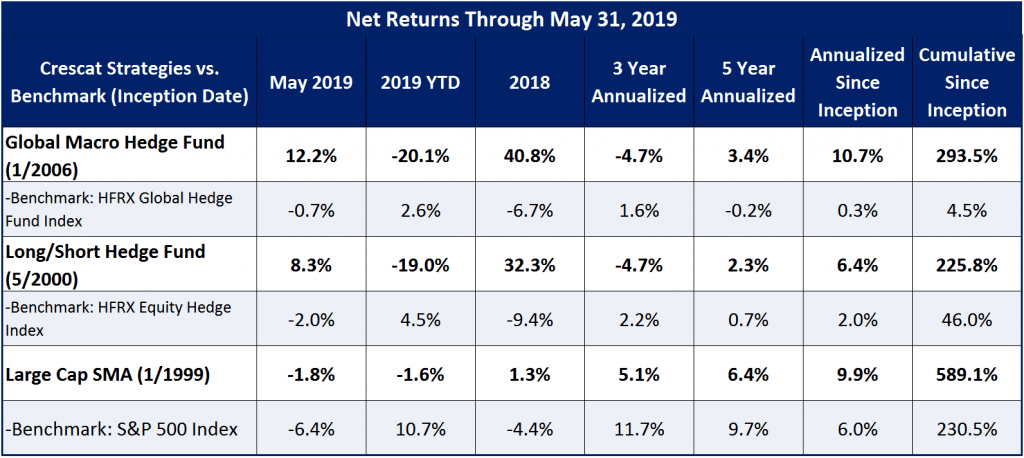
At Crescat, we believe the US stock market is on the precipice of a likely severe bear market and global economic recession. Short opportunities abound across the globe which we are positioned for in our hedge funds across multiple macro themes. Our shorts delivered strong performance in our hedge funds in May as they did in the fourth quarter last year. We believe this is just a taste of what is to come. See our May performance at the end of this letter. Meanwhile, on the long side of our portfolios, the outlook for precious metals is extremely favorable today. Our long-only Large Cap strategy is heavily skewed toward gold and silver mining companies. Precious metals have been particularly strong month to date in June and are soaring after yesterday’s dovish Fed FOMC release benefitting all our strategies.
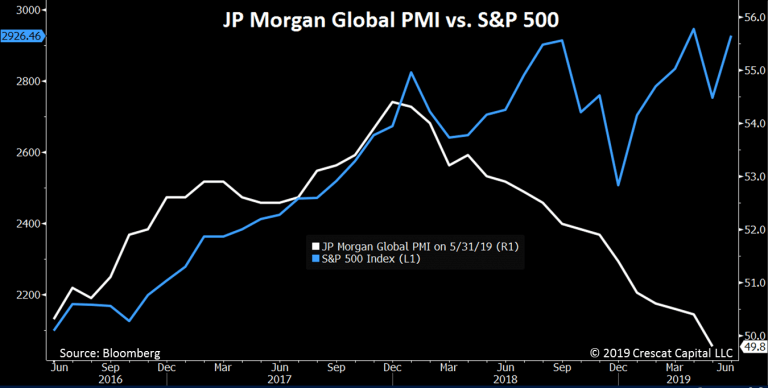
Not just US, but global economic conditions have been deteriorating rapidly in 2019. We now have about 60% of countries with purchasing manager indices below 50 according to Morgan Stanley research, indicating that the world is tipping into recession. Similarly, after a steady decline since January 2018, JP Morgan’s Global Manufacturing PMI dropped below 50 in May, indicating a global recession may have just begun. In the chart below we can again see another alligator mouth divergence between this index and the S&P 500. It will not surprise us to see these jaws snap shut with a severe stock market decline.
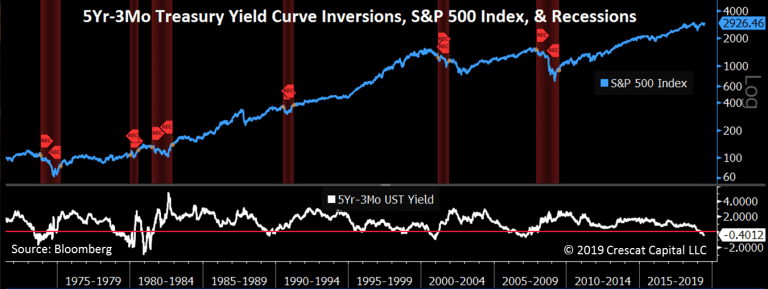
Today’s yield curve inversions are perhaps the most foreboding macro indicators that we follow. In the US, we are particularly interested in the inversion of the 5-year vs. 3-month Treasury yield spread based on the work of Campbell R. Harvey, a finance professor at Duke University’s Fuqua School of Business. Harvey premised in his 1986 PhD dissertation at the University of Chicago that when either the 5-year or 10-year Treasury yield inverted vs. 90-day T-bills, a recession followed within 12-18 months. At that time, his research relied on only three occurrences. Since then, this indicator worked “out of sample” three times for a perfect track record in the last six recessions. The 5-year vs. 3-month yield has been inverted for over 100 days now and is signaling an oncoming recession!
In the chart below, we have shaded the recessions that followed all six of these past 90-day+ inversions. We also show the S&P 500 Index. Note the brutal bear market for stocks in 1973-1974, 2000-2002, and 2007-2009 that flowed directly from these inversions. These bear markets began significantly ahead of the acknowledgement of these recessions. The world at large is always in denial in the early stages of a bear market. We think that is the same set up today.
Cam Harvey recommends, like Crescat, using multiple confirming macro indicators to forecast a recession. In Harvey’s case, he sees “four horsemen of the apocalypse” all lining up right now: (1) declining CFO confidence; (2) anti-growth protectionism; (3) market volatility; and (4), the 5-year vs. 3-month Treasury yield curve inversion. At Crescat, we have identified something closer to twenty-five macro timing signals in our recent research letters. The 5-Yr vs. 3-Mo. inversion is just one of them.
With debt imbalances at historic levels globally today across government, household, and business sectors, there is a strong potential for a particularly brutal world-wide financial downturn. We have also already shown a plethora of yield curve inversions both in the US and globally, not just the US 5-Yr vs. 3- Mo. Historically, these have all been reliable macro warning signals of oncoming recession. The number of these yield curve inversions has continued to creep up globally. Based on Tavi Costa’s work here at Crescat, a record 16 countries now have 30-year bonds yielding less than LIBOR overnight rates, an extreme inverted “global” yield curve just like the one the preceded the last two global recessions. Also based on Tavi’s work, the percentage of yield curve inversions within select at-risk countries is also daunting: Hong Kong (79%), Canada (69%), US (57%), and Australia (42%).
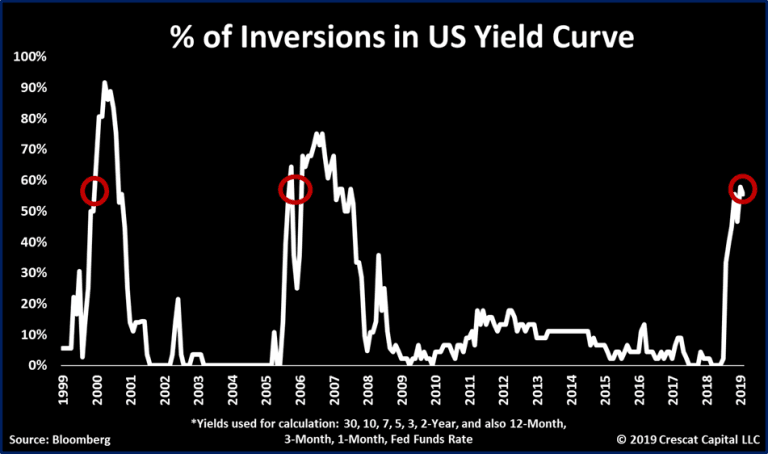
The following chart continues to be one of our strongest yield-curve arguments for our bearish outlook and positioning in the US. In it, we calculate the percentage of negative spreads in the US yield curve. It measures all 44 possible combinations of yield spreads from overnight to 30-year interest rates. We now see the US with almost 60% of its yield curve inverted, just as high as it was directly ahead of the tech bust and global financial crisis!
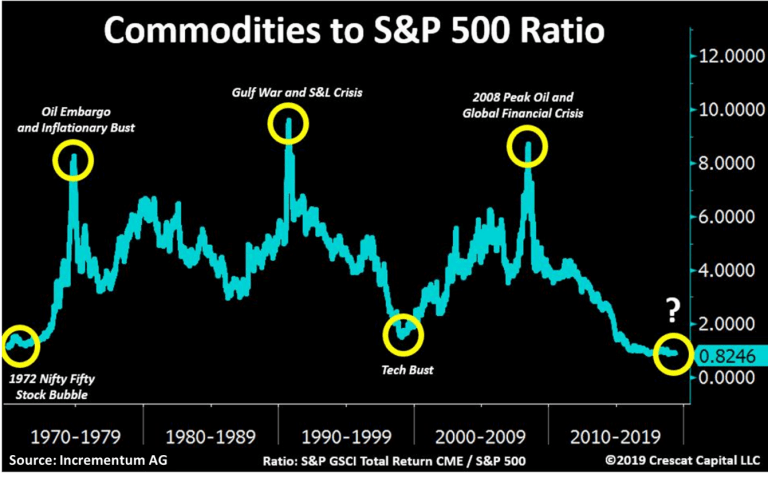
The commodities-to-S&P 500 ratio just reached a fresh 50-year low. The chart below was first published by Incrementum AG and does an incredible job of presenting the historic US equity bubble. It’s yet another reason for why US stocks look absurdly overvalued at the likely top of the business cycle.
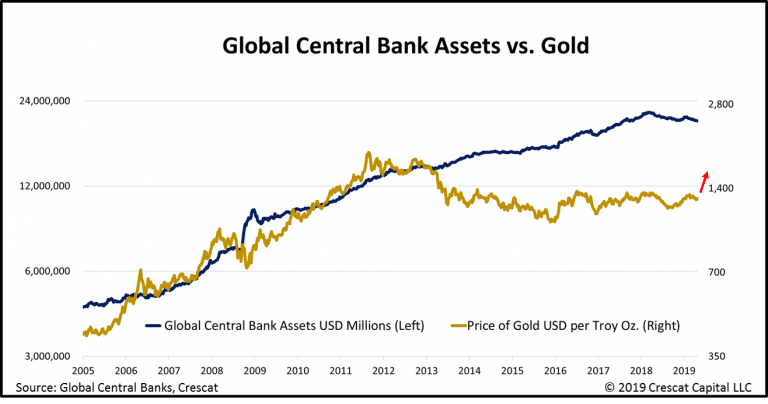
With respect to the numerator part of this imbalance, we are incredibly bullish today on precious metals commodities. We believe gold is historically undervalued relative to the global fiat monetary base as shown in the chart below. Look at the target price for gold in this macro chart! It is almost double today’s prices. Gold is the longest running and most widely held global central-bank reserve currency. In the long run, it should follow the level of global fiat money printing and has a lot of catching up to do.
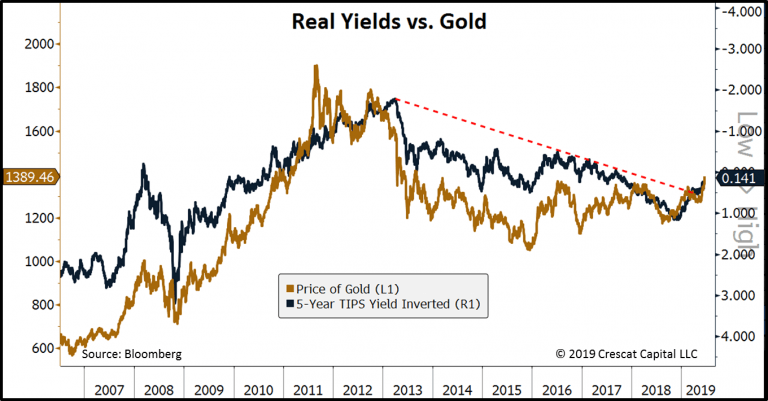
The problem is that the money printing in the past decade has yet to translate into rapidly increasing inflation. Therefore, gold has been in a 7-year bear market as real interest rates were rising as shown in the chart below. In the short run, gold tracks the inverse path of real interest rates. The exciting news for gold bulls today is that the real interest rate trend has finally reversed. With the recent fall in US nominal interest rates, at a greater rate than inflation, we are seeing a significant breakdown in real yields.
Given our macro views, we believe US short-term yields are likely to continue to move significantly lower as global economic conditions deteriorate, and central banks are forced to ease. Declining real yields give strong macro support for a substantial new precious metals bull market, even before inflation ultimately rears its head.
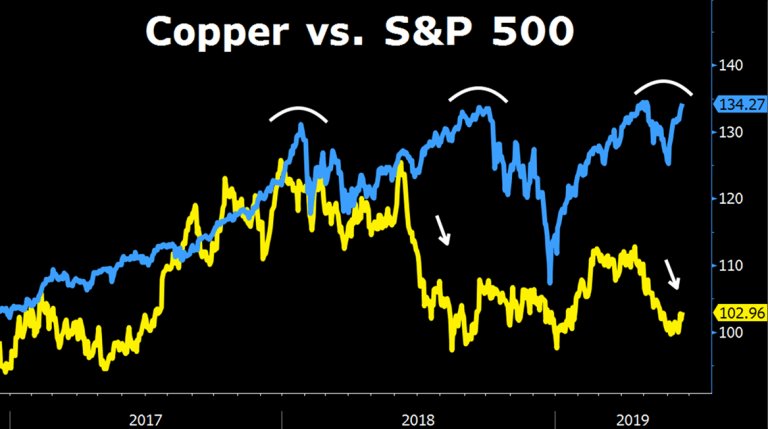
We now see bellwether commodities starting to diverge significantly from equity markets. Some of these moves resemble those that preceded the last market selloff in the fourth quarter of 2018. Copper is one of them. The industrial metal first peaked in late 2017, only a few months before stocks crashed in January of 2018. Then, copper re-tested its highs in June of the same year and crashed a few months ahead of one of the worst quarterly selloffs in the history of equity markets. Today, we are seeing a similar divergence. Copper prices have already declined close to 10% since April 17th while the S&P 500 is retesting its all-time highs.
The second important move to note was on gold prices. The precious metal has been on an uptrend since the end of April. That coupled with the recent decline in oil prices of over 22% is very telling. A significant rise in gold-to-oil ratio tends to precede critical junctures in equity markets and the global economy. We experienced a similar breakout in the global financial crisis, in the European debt crisis, at the first glimpse of the China bust in 2015, and at the early stages of the market selloff in November of 2018. After surging ahead of the G-20 meeting in Argentina we are now seeing a similar move ahead of the same meeting but this time taking place in Japan.
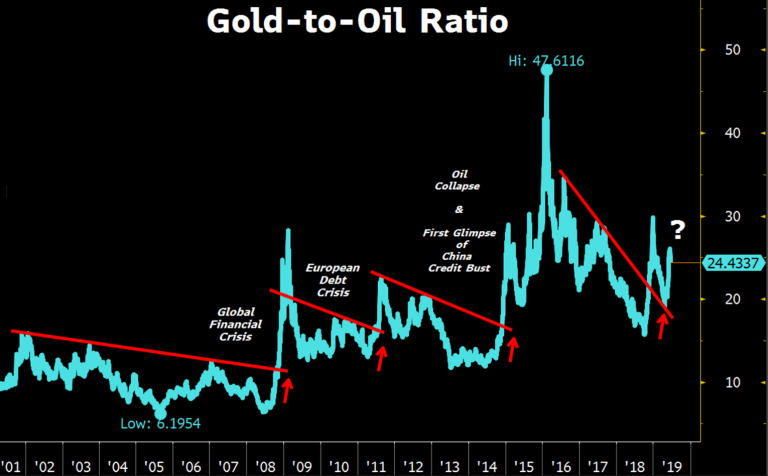
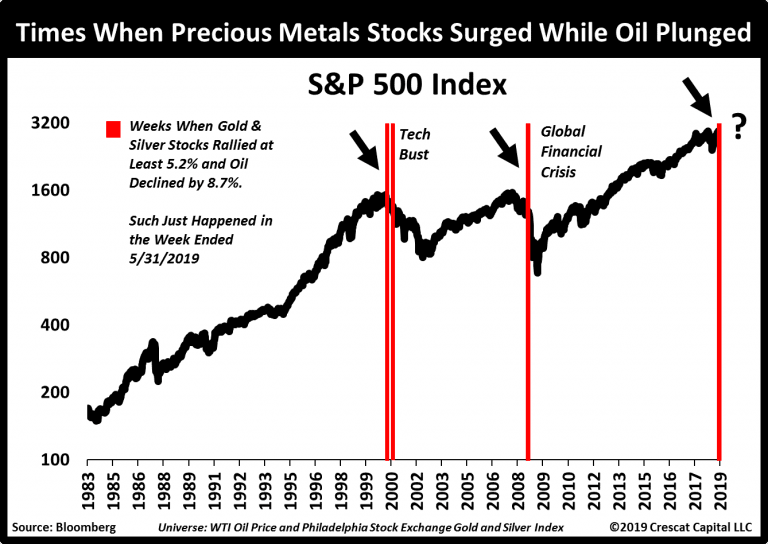
About 3 weeks ago, WTI crude prices had one of its worst weekly declines in the existence of its contract. Meanwhile, precious metals stocks rallied by over 5% during the same week. Such moves only happened three other times in history. As shown on the red highlights on the chart below, all of them during coincided with severe bear markets and recession. For us, this, along with multiple other macro signals we have published in previous letters, just adds to our bearish views.
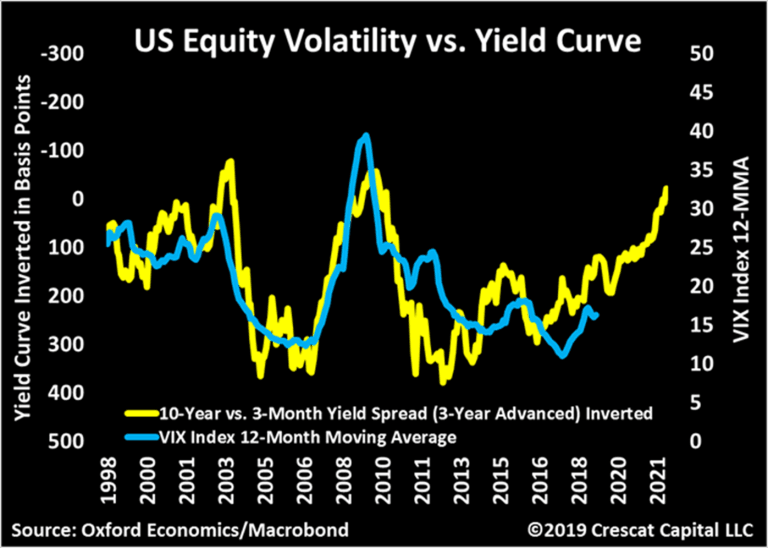
Another way of looking at yield curve inversions is to track them as a leading indicator versus equity volatility. Note how closely volatility follows yield inversions with a lag. Remember, rising equity volatility, with a recent trend of higher lows is one of the horsemen of the apocalypse.
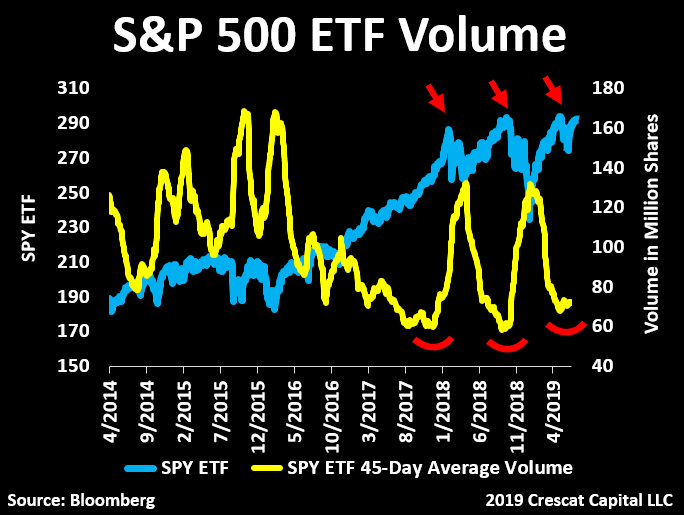
Similar to volatility ebbs and flows, volume has also been gyrating counter to equity performance is seems to be setting up for another bearish surge.
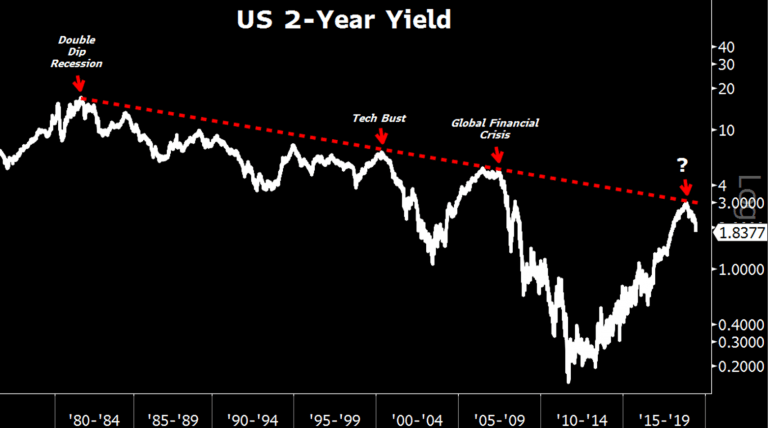
The year-to-date rally in US stocks has been completely rejected by 2-year yields which has been on a non-stop decline since November of 2018. One of them will be proven right. The shift to easy monetary policy late in the business cycle when telegraphed by a plunge in the 2-year yield has ultimately always been very bearish.
The market topping process has been drawn out, but the economic expansion is extremely aged. Meanwhile, we have the mother of all currency and credit bubbles in China, formerly the world’s economic growth juggernaut, now leading a globally contagious economic downturn. Last month, China just reported its biggest year-over-year deceleration in industrial production in 17 years. Auto sales in China have been in a recession-signaling downtrend already for the past year. With anti-China extradition protests in Hong Kong, capital flight pressures, and ongoing trade war tensions, China’s economy continues to face extreme downward pressure. We continue to maintain an asymmetric short position in China and Hong Kong currencies through laddered put options in our global macro fund which performed well for us in May.
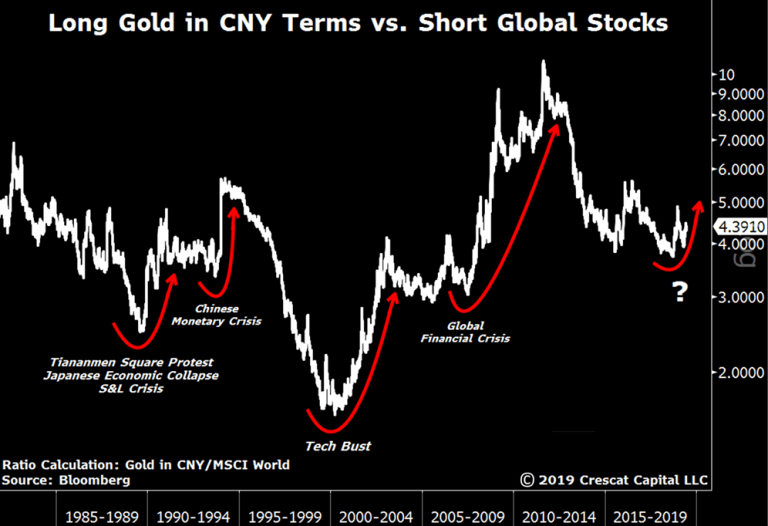
The bulk of the underlying macro exposure in our global macro hedge fund continues to be explained by this one chart, the macro trade of the century.
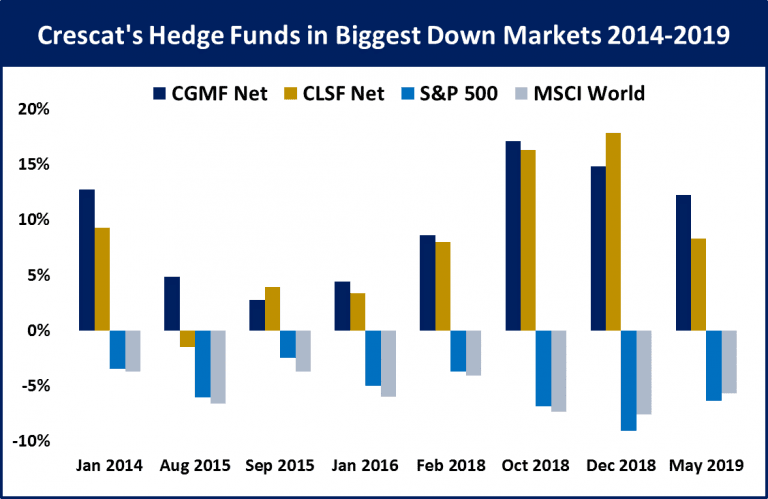
The chart below shows how well Crescat’s hedge funds have performed in the eight largest monthly drawdowns for the MSCI World and S&P 500 indices over the last five years, including last month. We are not perma bears, but after a record long economic expansion, we are now now more determined than ever to tactically capitalize on a downturn in business cycle.
Sincerely,
Kevin C. Smith, CFA
Chief Investment Officer
Tavi Costa
Global Macro Analyst


