Boyar Value Group commentary for the first quarter ended April 30, 2019, titled, “A Look Back.”
“Investing should be more like watching paint dry or watching grass grow. If you want excitement, take $800 and go to Las Vegas.” – Paul Samuelson
A Look Back
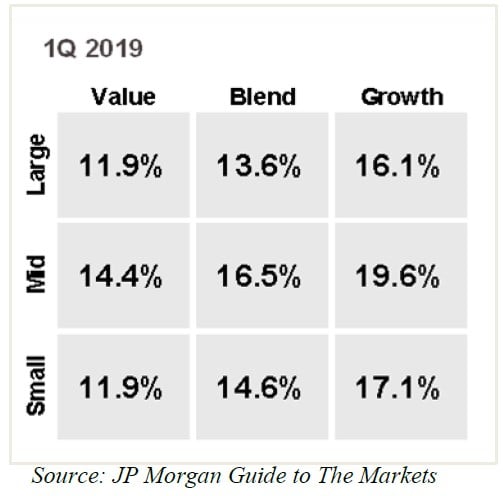
What a difference one quarter can make! After the S&P 500 declined by 13.97% during the 4th quarter of 2018, stocks started 2019 with a vengeance, increasing by 13.6%. This advance was once again led by technology stocks (which increased, on average, by 19.9%). Other top-performing sectors included industrials (which advanced by 17.2%), energy (16.4%), and consumer discretionary (15.7%). Laggards included health care, which advanced by “only” 6.6%, and financials, which gained a “meager” 8.6%. As the following chart demonstrates, growth stocks, as defined by the Russell-style indices, significantly outperformed value stocks during the 1st quarter: mid-cap growth stocks led the charge, advancing 19.6%, and small-cap value and large-cap value stocks were the worst performers, advancing “only” 11.9% each.

Q1 hedge fund letters, conference, scoops etc
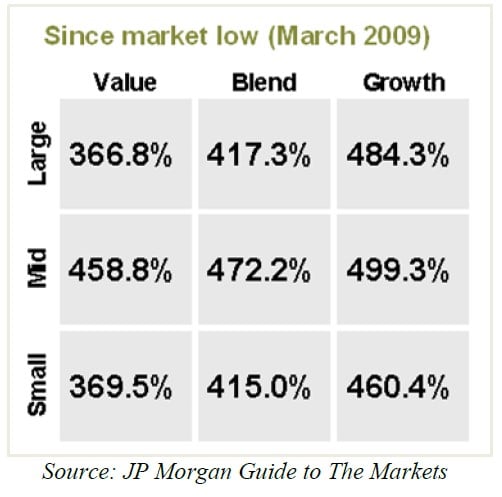
While the S&P 500 (inclusive of dividends) has now gained 417% from its March 2009 lows, consumer discretionary shares have been the best performers, advancing 736%. Technology shares aren’t far behind, having gained a respectable 648% over that same period. The worst performing sector has been energy, with a gain of merely 103%. Mid-cap growth stocks (once again as defined by Russell) have had the highest returns, advancing almost 500%, while large-cap value stocks have had the worst performance, advancing 366%.
Stocks have had quite the run over the past decade, but they are not expensive relative to historical averages. As of the end of the latest quarter, the S&P 500 sold for 16.4x forward earnings, versus its 25-year average of 16.2x earnings. In addition, the dividend yield for the S&P 500 is 2.1%, versus a 25-year average yield of 1.9%. With the Federal Reserve taking a dovish stance toward interest rates, we see equities as the most attractive asset class out there for long-term patient investors.
As we’ve noted, the S&P 500’s advance in the latest quarter was once again led by technology shares. Major standouts among technology stocks have been Facebook, Apple, Amazon, Netflix, Alphabet, and Microsoft. According to an article that appeared on April 22 in the Wall Street Journal, these stocks have gained roughly $916 billion in market value so far this year, enabling them to almost recoup their combined 4th quarter losses of $945 billion. The Bank of America Merrill Lynch April fund manager survey (which surveys more than 180 fund managers overseeing ~$547 billion in assets) ranked ownership of the FAANG stocks, along with Baidu, Alibaba, and Tencent Holdings, as the second most crowded trade in the market (behind shorting European equities).
Even the Best Investors Frequently Underperform the Market
Jeff Cox penned a very interesting article for CNBC.com based on information provided by Michael Crook, head of Americas investment strategy at UBS. In it, he included a chart showing that Warren Buffett frequently underperforms the market over shorter time intervals. In fact, the article states, if Buffett worked as a financial advisor instead of as head of Berkshire Hathaway, he would likely have a tough time holding a job these days, with investors having such a short-term mindset.
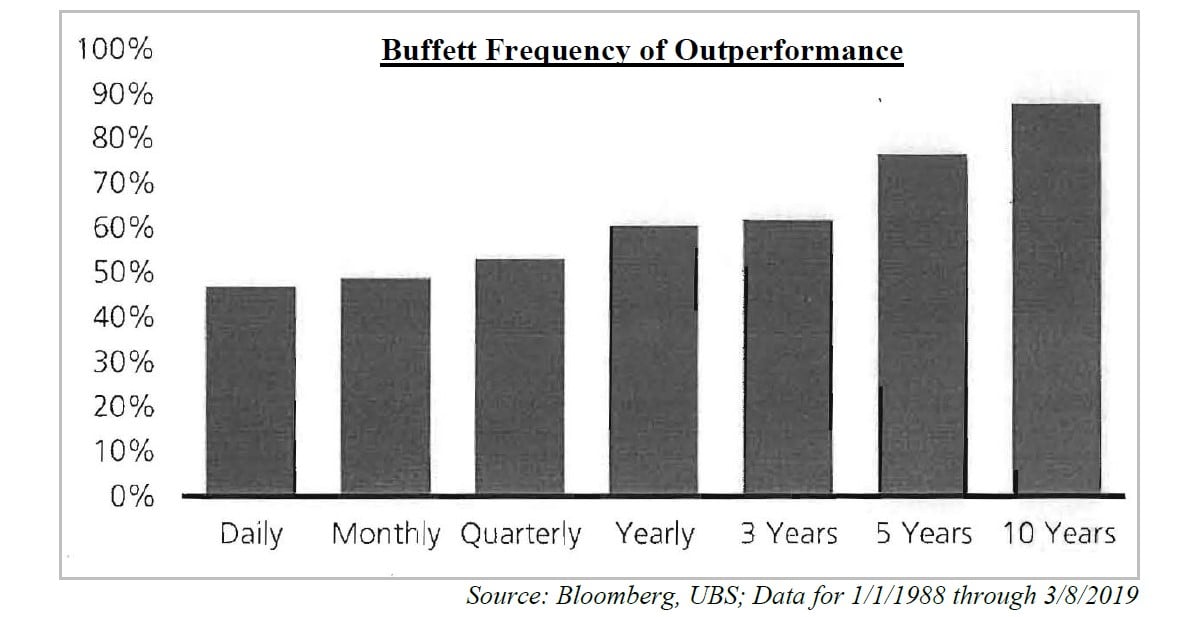
The point, of course, isn’t that investors should shun Buffett. Instead, the question is whether in the current climate of “short-termism,” with its demand for immediate results, the “Oracle of Omaha” would last in the business if he had not already earned a reputation as the greatest investor of all time. The high long-term returns achieved by Berkshire Hathaway required patience through extended bouts of underperformance. If most investors would fire Buffett rather than wait through a drought, then they are also probably too quick to sell a stock when it underperforms in the short and intermediate terms.
During the more than six combined decades that we have been investing, we have learned that most investors are quite impatient and, as a result, sell their winners far too early. As Cox’s article points out, if a stock does not perform well during the year or two after it is purchased, the average investor will dispose of it. But we have found that the market can take quite some time to recognize the value of a depressed or out-of-favor security. Indeed, some of the biggest winners held by Boyar Asset Management floundered for multiple years. For example, we purchased Microsoft for clients from ~2005 through ~2011 at an average cost of $28.87 per share. For some time, Microsoft stock significantly underperformed the major indices, and we appeared to have fallen into a classic value trap. In 2014, however, Steve Ballmer retired as chairman and CEO and Microsoft stock began to soar. The stock now trades for over $129 per share, more than making up for its previous (long) period of underperformance.
Buffett himself has long preached the importance of long-range thinking. He doesn’t dwell on his company’s short-term performance, but that might not matter to some of today’s investors. Mitch Goldberg, president of ClientFirst Strategy, says, “I am actually seeing the same ‘short-termism’ now in many individual investors, and it’s happening more often because people look at the last 10 years and say, ‘You know, I thought I would have done better.’ . . . They forget that they’re either moderate risk investors or growth and income-based investors. They have been investing within their risk tolerance, and a lot of people are now thinking, ‘I don’t need to worry about my risk tolerance anymore.’”
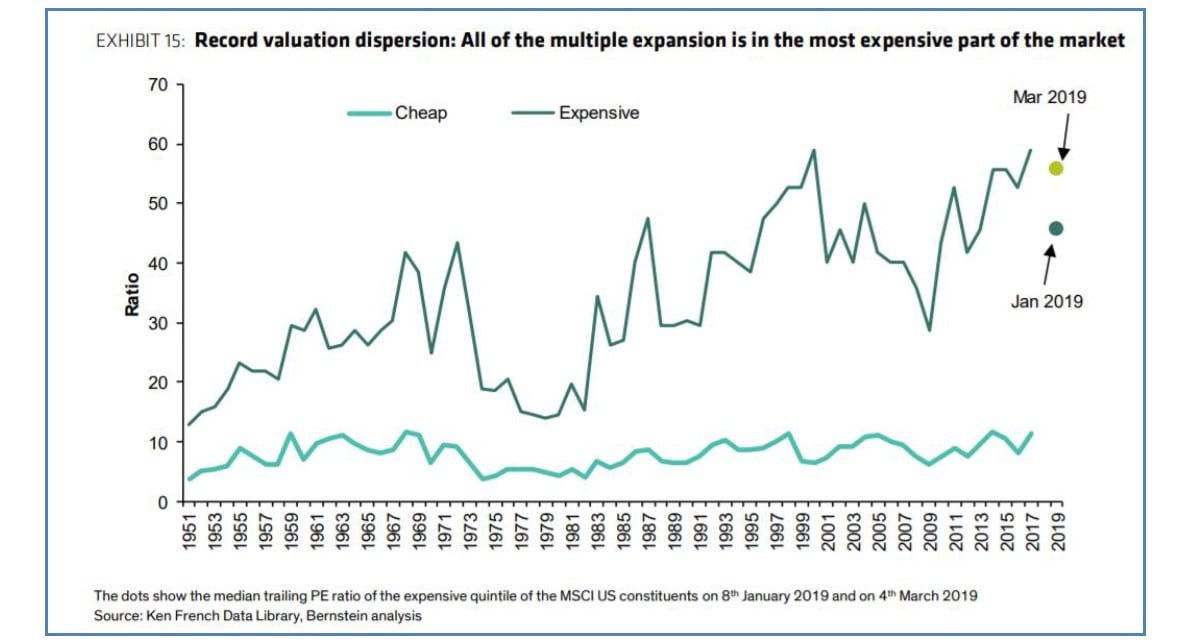
After a protracted period of having approached the market cautiously, investors’ desire to increase their risk tolerance, for fear of missing out on the great returns the market has already achieved, is producing classic late-cycle performance. Momentum investing is clearly in vogue today: investors pile into the stocks that are advancing the most quickly, regardless of valuation, believing that they are nimble enough to exit before the party ends. According to Alliance Bernstein, cheaply priced stocks are getting cheaper even as expensive stocks have gotten extremely pricey, pushing the valuation gap to the widest seen in 70 years. This record dispersion puts cheap equities in a sweet spot as other pockets of the market start losing appeal because of their high prices. No one knows for sure when value will begin outperforming growth, but it will happen. When we began purchasing incredibly inexpensive Microsoft stock, we had no idea that our idea would take so long to show results. But value normally tends to outperform when dispersion in valuations across the market is at its widest, and today’s incredibly wide valuation spreads should provide support within the market—in contrast with most other asset classes, which we see as being, for the most part, fully priced.
Performance
The drubbing that the stock market took during the 4th quarter of 2018 was somewhat undone during January, when the S&P 500 registered its hottest start to a year in more than three decades. The S&P 500 returned 13.6% (inclusive of dividends) for the 1st quarter of 2019—the 5th-largest S&P 500 gain to start a year since the index’s formation.
On an absolute basis, the majority of our accounts for the quarter did quite well. On a relative basis, we lagged the leading indices—a reversal from the 4th quarter of last year, when most of our accounts bested the major indices. This underperformance is directly attributable to our large cash position and to investors’ preference for growth over value. The most expensive stocks continued to get more expensive, while the cheapest companies—as measured by almost any acceptable matrix—lagged.
Eventually this trend will reverse its course, as it always does. As we note from time to time, we have materially underperformed for extended periods in the past. During the dotcom boom, for example, we trailed the leading indices for multiple years. But when the mania came to an abrupt end, we more than made up for our subpar performance during the next few years. We have no reason to believe that this time will be different.
Factors That We Believe Could Positively Impact the Stock Market for the Remainder of 2019
1) In response to the Fed’s recent announcement that it will be significantly more accommodative than previously anticipated, interest rates have declined precipitously. As a result, stocks are once again significantly more attractive than bonds. For example, the 10-Year U.S. Treasury currently yields 2.58%. In contrast, we follow quite a few high-quality businesses selling at reasonable valuations that yield 3% or more and that have the potential to both generate significant capital appreciation and increase their dividend.
2) Due to the significant decline in interest rates, mortgage rates have fallen dramatically. For the week of November 8, 2018, the average 30-year fixed rate, according to Freddie Mac, was 4.94%, but for the week ending April 18, 2019, it had dropped to 4.17%. This decrease in rates could lead to a significant boost in the housing market—one of the biggest drivers of the U.S. economy—and is quite timely, having occurred during the important spring selling season.
3) The S&P 500 fell 6.2% in 2018, notching its biggest 1-year decline since the financial crisis. Admittedly, annual declines are not that rare, having occurred about a third of the time since 1927—but only four periods have seen consecutive yearly losses over the past 92 years.
4) Historically, the third year of the presidential cycle is quite favorable for equities: the incumbent wants to get re-elected and so does everything in his power to keep the economy humming along. President Trump’s ability to take advantage of this third-year phenomenon might be somewhat muted, however, because the House of Representatives is controlled by Democrats. His power to have Congress enact a sweeping piece of legislation such as the recent tax reform act is thus virtually nil.
On the other hand, several situations could have the ability to derail the market’s advance:
1) If a comprehensive trade agreement cannot be reached with China and additional tariffs are implemented, this could result in a further slowdown in an already fragile global economy.
2) The Federal Reserve might prematurely raise interest rates.
3) The outcome of Brexit is impossible to predict. If the European Union plays hardball with the U.K., the ramifications could be dire for all of Europe. The fallout in the U.S. is expected to be minimal, but until events actually play out, what will occur is still anyone’s guess.
4) An inversion of the yield curve is a somewhat reliable predicator of an upcoming recession. An inversion occurs when the yield on long-term debt drops below that on its shorter-term peers, potentially signifying a lack of confidence in the economic outlook. On March 22, the yield curve inverted. However, as pointed out by Tony Dwyer, chief U.S. markets strategist for Canaccord Genuity, the median S&P 500 gain from the initial inversion to the cycle peak has been 21% over the past seven economic cycles, with a recession coming a median of 19 months after the initial inversion.
5) According to PitchBook, approximately 227 active unicorns—privately held startups valued at over $1 billion—exist worldwide. In 2018 alone, 47 U.S. tech companies reached unicorn status. Rather than financing their growth through the public markets, unicorns look to the private equity market, where money can be raised much faster, with significantly less regulation. As long as these companies are able to grow their revenue, additional capital is readily available at higher valuations than in the prior round. At some point, however, private equity holders will want to cash out, via either the public equity market or a merger. The high-tech IPO frenzy has started, with a handful of unicorns having already gone public in April. None of these entities has ever made any money, but so far investors seem willing to overlook their surging losses in favor of strong revenue growth. Do these businesses’ absurdly high valuations signify a market top? Will institutions need to sell some of their current stock holdings to participate in these IPOs? If so, this could put pressure on the market.
When Should You Sell a Stock?
Figuring out when to buy a stock is relatively easy. If a company is selling at a significant discount to our estimate of its intrinsic value and also has some sort of catalyst for capital appreciation, then we believe that we will be rewarded for owning it—if we are patient. Deciding when to sell a security, however, is generally much more difficult. When considering whether to exit a position in a taxable account, for example, we must take into account payments to Uncle Sam.
Taxes are potentially the biggest expense that investors face, and we are highly cognizant of them when deciding whether to sell a security. High-net-worth investors who have held a stock longer than a year will be subject to roughly a 25% tax on their gains if they sell their shares, so in our opinion, to justify selling, we need to find a stock that is 25% cheaper than the one we currently have—a high bar to clear. We have been comforted, though, to see that recent academic research backs up our intuition: researchers from the University of Chicago, Carnegie Mellon University, MIT, and analytics firm Inalytics, in a study called Selling Fast and Buying Slow, looked at more than 4 million trades made by institutional investors from 2000 to 2016 and found that these sales cost institutional investors as much as 1% more per year in returns than could have been had by just selling securities at random.
To explain this phenomenon, the researchers suggested that investors spend far more time analyzing the buy decision than they do the sell decision. Fortunately, however, because we look for companies through the lens of an acquirer, our sell decision is often made for us, as many of the companies we own end up being purchased by a third party.
If you have any questions, we’re always available.
Best regards,
Mark A. Boyar
Jonathan I. Boyar
This article first appeared on ValueWalk Premium


