
As part of the advanced forex trading strategies, professional traders use single candlesticks to spot potential trend reversals. How this works and why you can use it to your advantage, is explained in this article.
Candlestick analysis is an essential part of technical analysis. A candlestick shows the complete price movement during the given timeframe. For instance, if we are looking at the daily chart, one candle represents one day and if we are looking at the 5 mins chart, one candle represents five minutes. A candle consists of a body and of the wicks. The body shows the opening and closing price of the candle, while the wicks show the extremes which the price reached during that timeframe.

Q4 hedge fund letters, conference, scoops etc
Since market movements are caused by humans, markets are generally driven by emotions and rational thinking which are both aspects of the field of psychology. Therefore, we can conclude that a market represents the psychology of the market players. As research in psychology has identified several patterns in which humans act and react, it’s a logical consequence that we can find those psychological patterns also in the market movements. Indeed, it even formed a new field of science, known as behavioral analysis of markets.
Thus, several individuals analyzed several candlesticks and observed particular correlations. With statistical assessment, one could calculate the chances of the price going up or down after a specific candlestick forming.
It was observed that the following candlesticks were followed by a trend reversal more often than not.
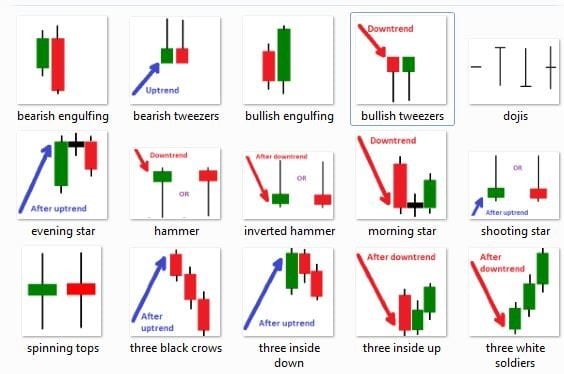
Image credit: http://www.forexabode.com/images/forex-school/candlesticks%20reversal%20patterns%20to%20support%20fibonacci%20levels.jpg
Bullish reversal candles form after a downtrend and indicate a trend reversal to the upside. Bearish reversal candles can form after an uptrend and indicate a trend reversal to the downside. It is advised to include candlestick analysis in your technical analysis, to increase the chances of making the right decision. For example, if you see several bullish patterns and bullish indications by the indicators and you see a trend reversal candle forming, it could well act as confirmation to enter your trade.
Trend reversal candles are very powerful to use as an indicator, but it’s not advised to rely solely on candlestick analysis. With that in mind, you should learn the candlestick sheet and include the analysis in your trading strategies. After all, it is important to recognize that these candles are displayed if you are using the “candles” in your chart and not “Heikin Ashi”. Heikin Ashi could simultaneously display different candles since those candles are calculated differently and therefore, have different openings and closings which leads to a dissimilar formation of the body and wicks.