SAGA Partners commentary for the fourth quarter ended December 31, 2018.
4Q18 Results
During the fourth quarter of 2018, the Saga Portfolio (“the Portfolio”) decreased 20.8% net of fees. This compares to the overall decrease, including dividends, for the Russell 2000 and S&P 500 Index of 20.2% and 13.5%, respectively. Since inception on January 1, 2017, the Saga Portfolio returned 16.6% net of fees, compared to the Russell 2000 Index and the S&P 500 of 2.0% and 16.5%, respectively.

Q4 hedge fund letters, conference, scoops etc
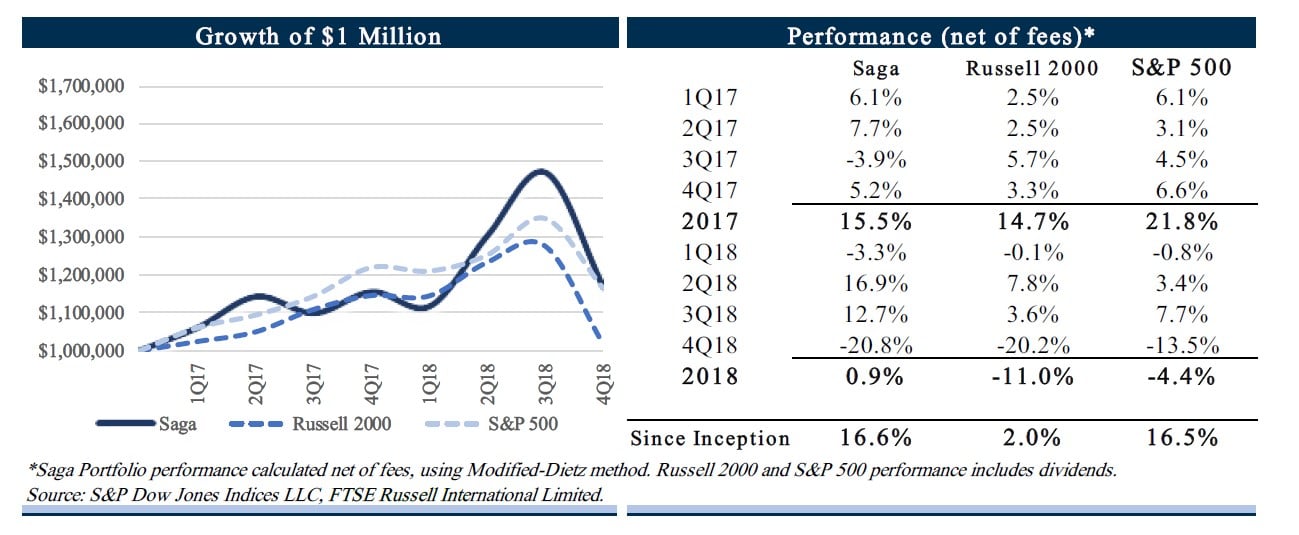
*Saga Portfolio performance calculated net of fees, using Modified-Dietz method. Russell 2000 and S&P 500 performance includes dividends. Source: S&P Dow Jones Indices LLC, FTSE Russell International Limited.
Interpretation of results
A positive year when nearly every other asset class had negative results may give investors a sense of comfort or stability. The fact of the matter is little can be interpreted from one year of performance and volatility control is not the goal of the Saga Portfolio. As a long only, concentrated equity portfolio, sharp drawdowns will happen, such as the 21% decline during the fourth quarter.
When investing in public equities, volatility is just part of the game. Sometimes the market interprets all news as good news, or all news as bad news like during the last quarter. Fears of a
U.S. and China trade war between, rising interest rates, a government shutdown, or simply being near the end of a business cycle can swing the indices to double digit declines over a relatively short period.
With the exception of moving into alternative asset classes with lower return potential or trying to incorporate hedging strategies that will also likely lower prospective returns, there’s really no getting around the fact stocks will move up and down arbitrarily based on whatever current sentiment may be whether it’s sensible or not.
The important thing to remember is… volatility does not matter over the long-term. It only matters if you find yourself needing to liquidate assets at the bottom tick. We emphasize these market characteristics not to create a sense of fear in investors, but to properly set expectations since big market swings will continue to happen. If you are looking to lower volatility, stocks are not the answer. Even widely diversified indices will have big price movements. Only in Bernie Madoff type investment strategies can an investor receive equity-like returns with bond-like volatility.
Over the short-term, price swings have little correlation to a company’s fundamental intrinsic value. The Saga Portfolio only invests in companies that we expect intrinsic value to grow over time regardless of what shares do in the near-term. We have found that if a company meets our four simple filters; 1. a business we understand, 2. has a growing competitive advantage, 3. has high caliber management aligned with shareholders, and 4. selling for an attractive price, strong returns will likely occur over the long-term.
We welcome market volatility if it provides more investment opportunities, such as last quarter when we started a new position in Facebook. Our view has always been that investing in public equities are for longer-term investors because anything can happen in the short term.
We have a few guiding principles when it comes to thinking about the general market:
- Despite the numerous commentators and market “experts”, no one can accurately predict and time market downturns with any useful level of reliability.
- A bear market will happen again at some point, we could even be in one now. The best attitude is to be market agnostic since you can’t predict it or position yourself effectively to avoid it without lowering long-term expected returns. For years market commentators have predicted we were due for a crash, advising investors to prepare for the imminent collapse. Eventually when one of the repeated warnings proves accurate, the forecasters will overlook the fact that if you followed their advice, you would have forgone gains which far outweigh any losses during a downturn. We have little confidence in our ability to time cycles. The Saga Portfolio invests in every company with the expectation we may be on the brink of an economic If we are not comfortable owning a company during an inevitable downturn, we should never own it in the first place. The best thing to do when you own a house in an earthquake zone is to build a very sturdy house. We will never know when an earthquake will hit and how bad it will be, but we want to be prepared for whenever it does.
- Over long periods of time, we have strong conviction that the market will continue to march upward in intermittent fits and spurts. For centuries, GDP per capita was stagnant. Following the rise of capitalism and the market system in the 1700s, productivity started to compound at a fairly consistent rate. In the 1900s, as the ownership of publicly traded stocks became more accessible, more people were able to participate in the growth of the general economy. We hope to participate in a growing economy by owning a small number of high-quality companies that can compound intrinsic value over the long-term.
Top five positions
We want to discuss any updates to the Portfolio’s largest positions so you know what you own and why you own it. Most of the Portfolio’s top positions are familiar to investors. We err on being more transparent but feel free to skim if you grow weary reading. Quarterly company updates may be a little too frequent since little typically happens to a company’s long-term fundamentals over a three-month period. Going forward we will likely provide semiannual updates for the Portfolio’s top positions but continue to discuss any material updates each quarter. Below we discuss the Portfolio’s new position in Facebook which has since become the sixth largest position.
Trade Desk, Inc. (TTD):
No significant updates with Trade Desk. It is a software platform company that enables customers to purchase and manage their digital ad campaigns. The company is essentially aggregating, analyzing, and valuing the fragmented digital media space that lies outside the Google and Facebook walled gardens. Since the last quarter the company continues its fast growth gaining market share in the programmatic advertising space with sales and operating income expected to increase a respective 50% and 160% in 2018. The 2Q18 letter discusses our investment thesis in more detail.
Element Solutions, Inc. (ESI); previously named Platform Specialty Products:
Platform Specialty Products officially sold the Ag Solutions segment to UPL and renamed the company Element Solutions, Inc. Following the segment sale, the CEO Rakesh Sachdev announced he is retiring and will be replaced by Ben Gliklich. Ben was EVP of Operations & Strategy and has been with the company since its founding five years ago. Rakesh has done a great job improving the company and focusing on consolidating the disparate segments after several major acquisitions. While Ben is relatively young at 34 years old, he has been part of the Platform story since the beginning and has been through all the ups and the downs.
The company provided preliminary 2018 results of $420-$422 million in EBITDA reflecting 3% organic sales growth and 4% adj. EBITDA growth. Results were below prior guidance and consensus expectations, reflecting a more challenging electronic and automotive end markets. Initial 2019 guidance of 5-8% adj. EBITDA growth, or $440-$455 million, was provided.
There are many attractive qualities to Element Solutions. It provides specialty chemicals that focus on surface treatment and electronic assembly. The business is part of integral processes generally tailored to meet customer specific requirements. Its products typically represent a small proportion of total end material costs but play an essential role, providing sticky customer relations and higher margins. Maintenance capex is fairly nominal as less than 3% of sales, making EBITDA a decent proxy for cash flow generation.
Element is currently selling for a market cap of $3.3 billion and has $1 billion in net debt, providing a $4.3 billion enterprise value. Based on initial 2019 adj. EBITDA guidance they are selling for 9-10x EV/EBITDA. With only modest organic growth, nominal capital reinvestment requirements, high operating margins, and a stronger capital structure, the company has the ability to allocate its free cash to either further deleveraging, bolt-on acquisitions, or share repurchases. Given how industry multiples have declined over the past year there could be high returning opportunities either through bolt on acquisitions or repurchasing shares at low multiples. There is a $750M share buyback program in place which management indicated would be one of the best uses of capital at current share prices as long as leverage remains less than 3.5x adjusted EBITDA.
Under Armour (UA):
Under Armour’s story is a great case study for the business world. It’s not every day that a recent college graduate starts a t-shirt company out of their grandma’s basement and only a few years later is going head to head with the sports brand behemoths of Nike and Adidas.
Prior to the recent speed bump in Under Armour’s 20%+ sales growth trajectory, Kevin Plank was praised for his salesmanship, brand building, and competitiveness. Wall Street analysts loved the company, valuing the stock with ever increasing expectations. Growth was the culture as the company scaled up its distribution, marketing and expanded product lines.
It seemed like a perfect storm of events hit Under Armour just as they were trying to accelerate, particularly with changing consumer fashion and purchasing trends as reflected in the bankruptcies of Sports Authority and Sport Chalet. Elevated expectations started to fall short in late 2016 and into 2017 as sales flat lined, inventory levels grew, just as the cost structure swelled to support a larger top line. Shares fell nearly 80% from top to bottom tick. The same analysts that were recently applauding Kevin Plank questioned if he was fit to manage the company he built, claiming he lost focus.
The truth is, few success stories rarely move in perfectly straight lines. If you look at any multi- billion-dollar, high growth company that has been around enough time, its history is likely marked by a few ups and downs. Nike, the industry giant, similarly had a several years of growing pains whether it was 1985 when sales growth decelerated to low single digits and shares fell nearly
70%, or in 1999 when sales declined 8% and shares fell 60%. During Nike’s issues in the late 90s, there were articles claiming American’s “love affair” with sneakers was over. Several analysts believed the industry was now mature and had no room for growth. In hindsight, both occasions proved to be great buying opportunities where long-term shareholders were rewarded. Of course Nike is one of the all-time great brand stories that could be compared to Coca Cola or McDonalds. Under Armour has its work cut out for it but we like its relatively short 23-year track record, founder-led CEO, and more recently…price.
The company held its investor day where it established 2023 strategic growth targets. We take five-year targets with a grain of salt and our investment thesis was not predicated on Under Armour achieving these set goals, but it helps to know what management is targeting and put rough numbers around expectations.
- Revenue is expected to grow mid to high single digits through 2023 and then return to low double-digits subsequently, driven primarily by International and Direct-to-Consumer businesses.
- Gross margin is expected to increase ~2.75-3.00%, reaching at least 48% percent in
- Operating margins are expected to reach a low double-digit percentage rate by
- Return on invested capital is expected to reach 20% by
Below are charts of Under Armour’s historic and potential sales and operating income. If Under Armour grows sales at a 7% compounded annual growth rate (CAGR), sales will reach $7.3 billion in 2023. If the operating margin reaches 12%, inline with historic averages before 2016, operating income will reach $3.5 billion in 2023. At that time, the company expects to be able to grow sales in the low double-digit range.
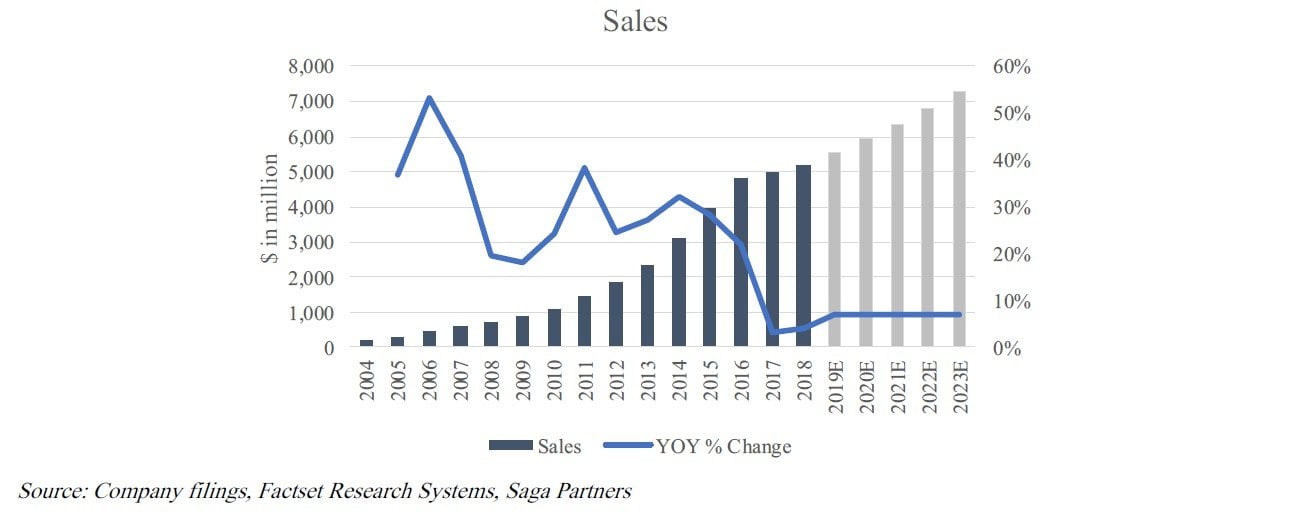
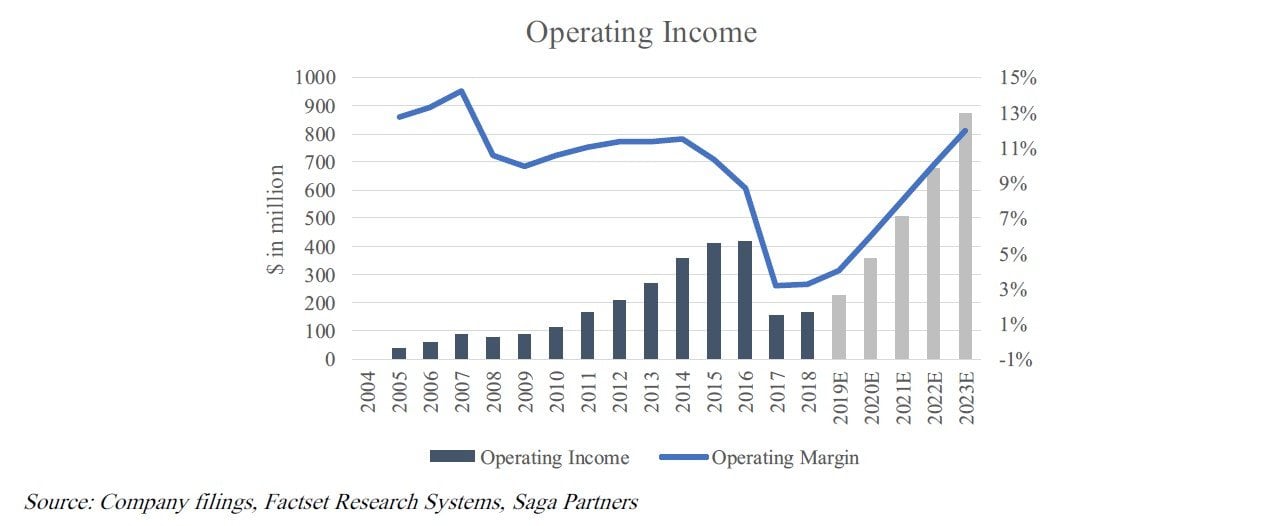
At the end of 4Q18, Under Armour was selling for an enterprise value of $8 billion, or just 13x potential 2023 operating income. While 2023 targets could easily fall short or even exceed these five-year estimates, what is important is that Under Armour continues to build its brand. If it can do that, earning power will inevitably grow.
High quality brands are not easy to make and take years if not decades to build through customers learning to trust that when they buy a product, it meets or hopefully even exceeds their high expectations if an Under Armour logo is on it. It is very difficult to decipher between an enduring brand or a bubble-like fad, but we like what we see in the two plus decades Under Armour has been around. While the company may have done some defense in the last two years, we expect that a leaner cost structure and elevated focus on brand quality has a high probability of setting the company up for success going forward.
Linamar Corporation (LIMAF):
Linamar is an auto-OEM headquartered near Toronto, Canada. The company has been part of the Saga Portfolio since early 2017. The longer we have owned and gotten to know the company, the more we like it, especially when considering recent bargain-basement valuation.
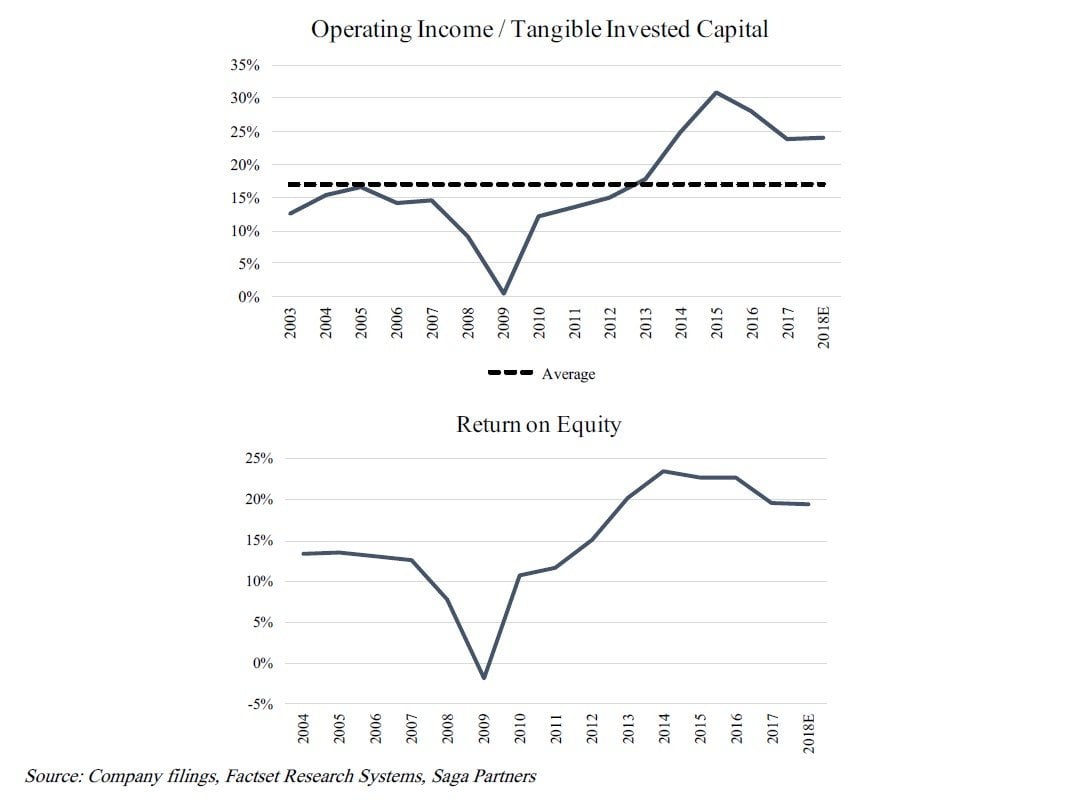
There is a lot to like about Linamar. It benefits from customers typically having higher switching costs, resulting from a 5-10 year production life cycles tied to contractual agreements, integrated processes, and long-term relationships. Several auto components are critical to the final product which creates a quality risk of switching to a new supplier, resulting in solid returns on tangible invested capital. Linamar has also diversified its end markets by acquiring businesses within industrial end-markets. The industrial segment which manufactures harvesting equipment and aerial work platforms made up nearly 50% of operating income in the last quarter.
Over the last cycle which includes the worst auto downturn in recent memory, Linamar’s operating income / tangible invested capital averaged over 17%, and nearly 25% over the last five years. Outside the recession years of 2008 and 2009, return on equity has improved since the early 2000s, exceeding 20% over the last five years.
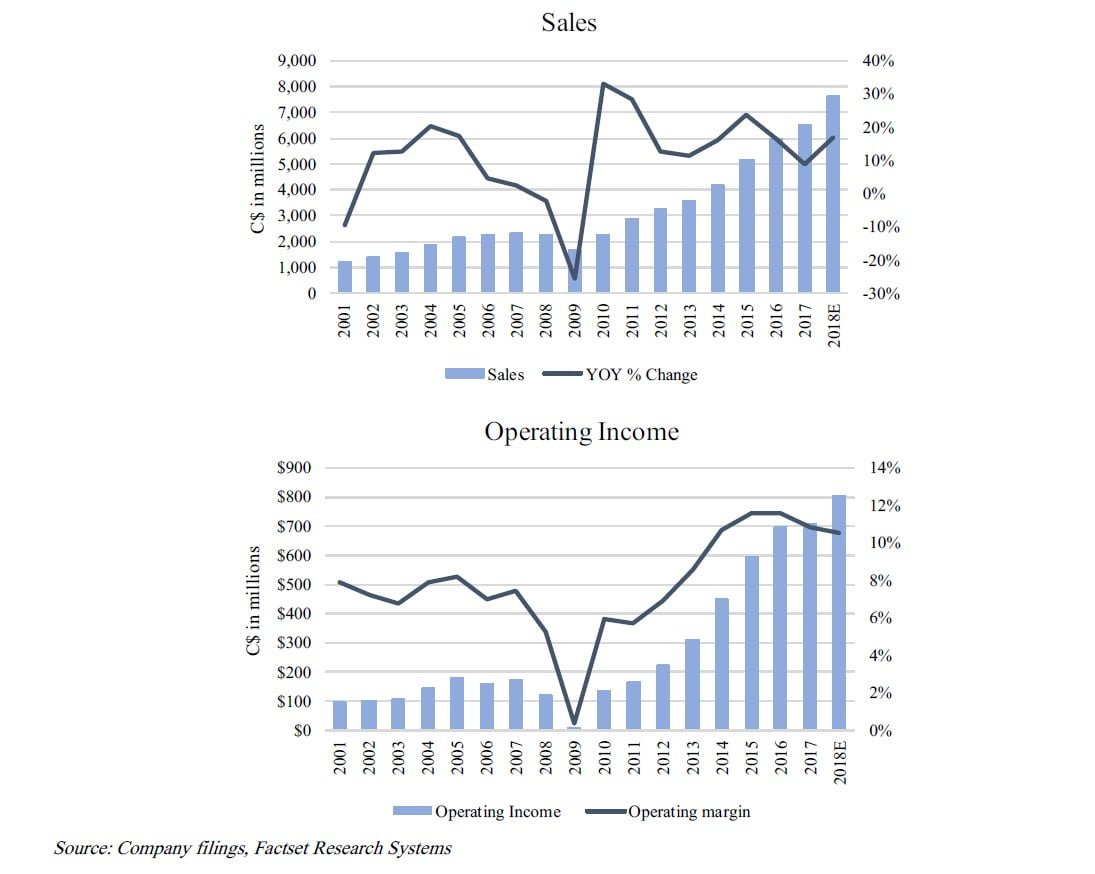
While the global powertrain/driveline market for light vehicles and commercial trucks is only expected to grow at ~1% CAGR through 2030, increased outsourcing in both internal combustion and electric vehicles to product experts such as Linamar with more advanced processes and global capacity, is expected to grow the total addressable market by ~8% CAGR through 2030. This can be seen from Linamar’s ability to grow total automotive sales over the last 10 years (2007-2017), at an 11% CAGR, reflecting a 4% CAGR in auto unit production and 7% CAGR in content per vehicle.
Since the peak of the prior cycle in 2007, total sales have grown at a 12% CAGR while operating income has grown at a 15% CAGR.
Linamar’s growth throughout the last cycle has been very impressive considering the company competes in a mature industry with well-established competitors. Results can largely be attributed to the CEO Linda Hasenfratz who succeeded her father, Frank Hasenfratz as CEO in 2002.
After escaping Hungary shortly before the Hungarian Revolution of 1956, Frank Hasenfratz started Linamar in 1966, naming the company after his two daughters and wife, Linda, Nancy, and Mary. The Hasenfratz family owns ~30% of outstanding shares. Linda has successfully led the company through the Great Recession and successfully diversified its end markets through accretive acquisitions. In 2018, she was named Canada’s CEO of the year.
The level of fear and downside baked into share prices looks extreme. Risk of peak auto unit production, rising interest rates, death of the internal combustion engine, or ratification of the new NAFTA deal (called the US-Mexico-Canada Agreement), all contributed to Linamar selling for only 5x 2018 earnings, 6x EV/EBIT, and a free cash flow yield of 15%+ at the end of the quarter.
These valuations make little sense for a company with a consistent history of profitable growth, and high-caliber, shareholder aligned management. The market appears to be pricing in a major auto downturn and valuing Linamar as though current earnings are likely to decline materially despite growth in its non-auto business segment where the agriculture market is at the early stages of a cyclical recovery.
Management expects sales to grow high single to low double digits and operating earnings to grow in the strong double digits over the intermediate term. Linamar is a great example of a company that has a strong track record and favorable outlook, but the company is bucketed with other auto-OEMs that are more cyclical and have lower growth prospects. Fortunately management recently initiated it first share repurchase program in recent history for up to 10% of outstanding shares due to their undervaluation. With a strong balance sheet at 1.7x net debt to EBITDA, share repurchases appear to be a great use of company capital at current prices.
LGI Homes (LGIH):
LGI Homes is a company we have owned since early 2017 but has only recently became a top five holding last quarter given the opportunity to add to the Portfolio’s position. LGIH is an example of a company we found by downloading the list of all U.S. publicly traded companies and going through it line by line, skimming long-term operating metrics.
LGIH’s fundamentals stood out, though we quickly discovered it was in an industry we had little interest…homebuilding. With the recent memory of the worst housing related downturn in a generation, there are few industries that investors dislike more than homebuilding. Thankfully our curiosity led to us digging a little deeper and we quickly realized we discovered a little diamond in the rough.
Homebuilding is a difficult business. The industry has many of the economic characteristics we do not like as long-term owners. It is a fragmented industry that is cyclical, fairly capital intensive, and has low barriers to entry. Larger builders may have some scale benefits or brand recognition, although they are only modest at best.
Although it is difficult to create a competitive advantage in this space, LGIH has proven to be an exception as a low-cost producer. It has had industry leading growth, margins, returns on capital, and was the only top 200 builder to grow during the 2008 recession. The company has never taken an inventory impairment despite going through the Great Recession. LGIH reminds us a
little of Old Dominion Freight Lines, a trucking company that has stood out as a leading operator in a fairly commoditized and fragment industry, providing very attractive shareholder returns over the long-term.
LGIH builds standardized, move-in ready homes at attractive price points for entry level home buyers. The company buys lower cost land just outside urban areas that often qualifies for a USDA Rural Development Loan where the homebuyer does not have to put any money down. Before LGIH starts a new community, it does extensive market research. It determines the number of rental households within driving distance to the development and does marketing tests to evaluate the demand opportunity. Instead of using brokers or realtors, LGIH uses a direct sales and marketing strategy by sending brochures/pamphlets that focus on converting apartment renters to homeowners. It’s not uncommon that owning an LGIH home that is larger and has greater amenities is cheaper than renting an apartment. This unique operating model provides a cost structure with lower COGS and higher inventory turnover, providing very attractive returns on capital.
We think LGIH’s competitive advantage is durable. Being a low-cost operator may not be as strong of a moat than having big economies of scale or a network effect, but if competitors wanted to copy LGIH it would mean established homebuilders would have to completely restructure their culture and operating processes which is not easy to do. It’s somewhat similar to how auto insurers continued to use their agency model instead of copying Geico’s lower cost direct marketing model. It would require changing an entrenched corporate culture and spending a lot of money, resources, and building out a sales force.
Even if competitors started to successfully incorporate LGIH’s strategy, the market for first time homebuyers is very large. The top five home builders are only expected to make up about 12% of housing starts in 2018. LGIH built ~6,500 homes in 2018 which is less than 1% of single- family housing starts last year. This is not a winner take all industry.
Eric Lipar has been CEO since 2009. His father started LGI Homes in 1995 as a land developer specializing in residential sites located outside of urban centers. In the early 2000’s, the father- son team thought builders were too focused on the product instead of on the customers so they decided they could do better by entering the homebuilding business in 2003.
Eric has done a very impressive job growing the company. He bootstrapped LGIH by raising private equity capital in its early days and led the company when it went public in 2013. His dad is retired but still owns 5% of shares and Eric owns 10% of the company. With LGIH’s market cap around $1 billion at the end of quarter, Eric’s shares are worth ~$100 million which is significant to his $3 million in 2017 compensation.
There’s a lot of concern surrounding rising interest rates, wage and building materials inflation, and general fear we’re near the end of a business cycle. If you look at longer term housing trends, there was overbuilding for several years leading up to the Great Recession, then significant underbuilding following the downturn, particularly in the markets LGIH serves for lower priced, entry level homes. What we see today is a lack of housing inventory as new household formation continues to grow each year.
The risk of rising interest rates can be a modest headwind to home affordability, but mortgage rates are still far below historic levels and higher rates could actually benefit a company like LGIH which builds more affordable homes.
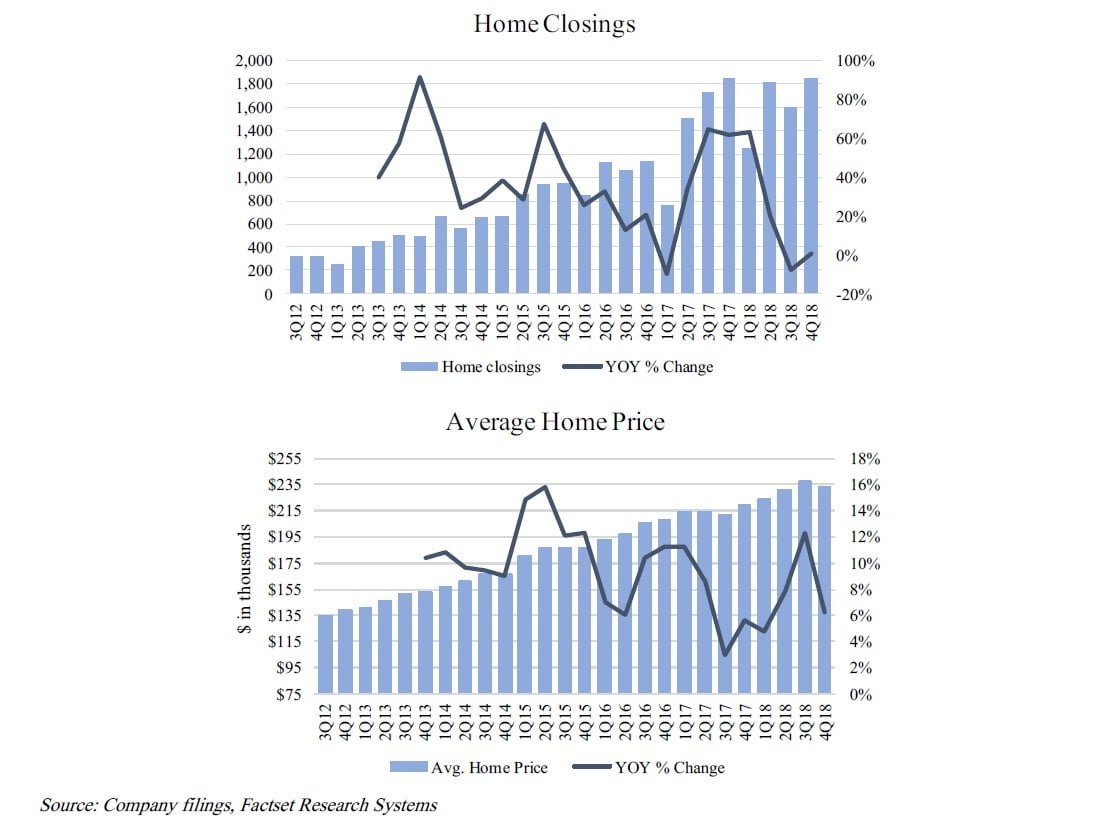
Management has a strong track record of growth with a goal to become a top five homebuilder. Home closing have grown at over a 40% CAGR over the past five years and the average home price has grown at a 9% CAGR.
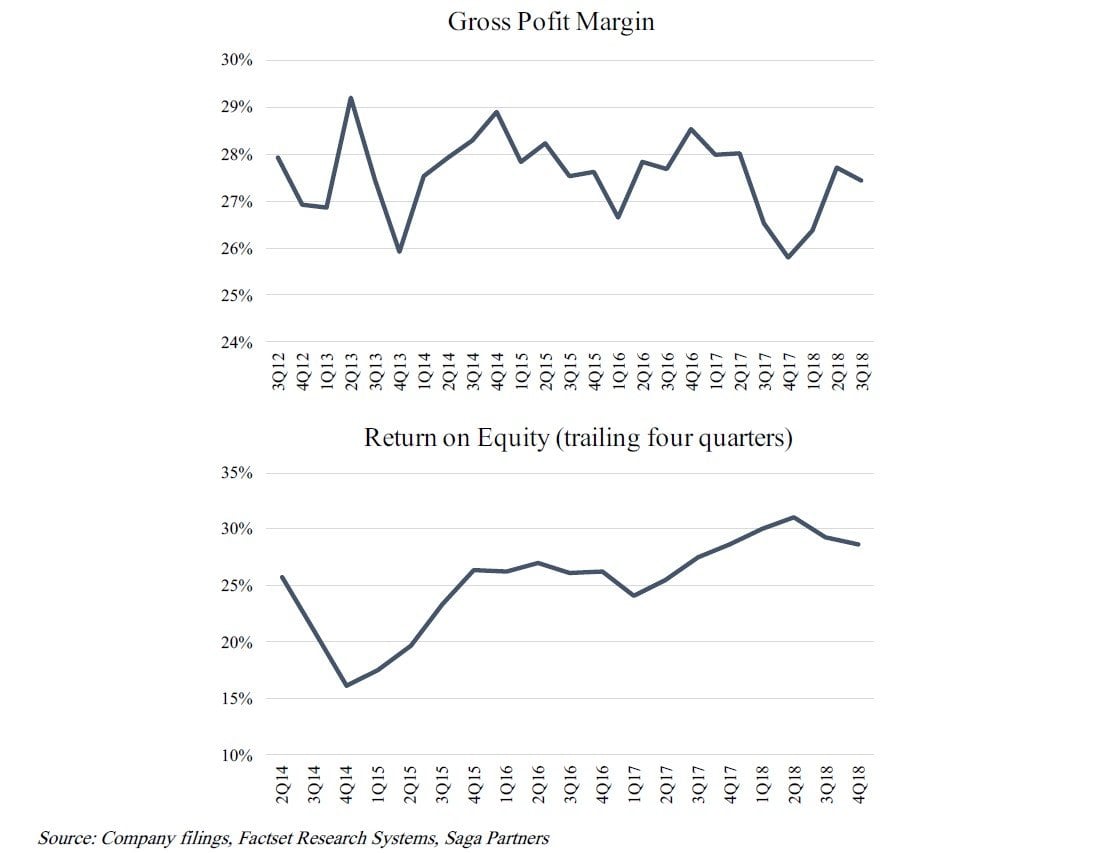
LGIH has never taken a write down on its housing inventory and it’s gross profit margin has consistently been in its target 27-28% range, providing strong returns on equity of >25% on average. LGIH has successfully been able to reinvest profits back into the company at high incremental returns on capital.
At the end of the quarter, LGIH’s valuation looked very attractive. If LGIH stopped growing and wanted to maintain its current volume of ~6,500 homes a year, it would have about $164 million in 2018 earnings or 6x its market cap of $1 billion.
Since much of LGIH’s capital is tied up in its housing inventory, it’s reasonable to use book value as a proxy for value. LGIH was trading at 1.6x book value at the end of the quarter. If the company continues to earn 25-30% on equity, and an investor bought shares at 1.6x book value, they would be earning nearly 20% on their investment at current prices. This yield is for a company that has
been able to compound sales at >50% and EPS at >40% over the last five years. In 2018 sales and EPS are expected to grow 20% and 33%, respectively.
While it may be reasonable to expect growth to slow in future years, LGIH’s valuation reflects a major decline in earning power. The U.S. could very well go through a downturn over the next year or two which would impact the housing market, however we expect LGIH to not only survive the next recession, but likely benefit if they are able to acquire land at discounted values, competitors go out of business, or if homebuyers move into the lower priced home demographic that LGIH serves.
How “platforms are eating the world” and a new position in Facebook
For any investment, we are looking for businesses that have some type of advantage or “moat” relative to competitors. Competitive advantages essentially come down to having a barrier to entry which allows a certain company to do something that is difficult to replicate. It can come from 1. customer captivity through habit, switching or search costs, 2. being a low-cost provider, 3. economies of scale, or 4. having a network effect.
In a competitive environment, moats are constantly under attack either from existing and new competitors or just from a changing economic landscape. As technological innovation impacts business at an ever-increasing rate, competitive advantages become less durable. The average age of a company listed on the S&P 500 has fallen from almost 60 years in the 1950s, to ~30 years during the 1970s, to less than 20 years today. While advances in technology is great for society and the consumer, it can be very destructive to the investor.
An interesting development has occurred throughout the economy as processing power and internet access have become more ubiquitous. In 2011, the former Netscape founder Marc Andreesen famously wrote an op-ed “software is eating the world” where he argued that software would continue to become a more important part of business. The largest companies in the world have increasingly become large tech giants. Some analysts argue it is due to their culture of innovation, entrepreneurship, and ability to attract the best talent. While this may be true to a certain extent, authors Alex Moazed and Nicholas Johnson claim in their recent book, Modern Monopolies, that it is actually the platform business model that has led to their success.
Business can be broken down into two basic operating models: linear and platform. Most companies are linear businesses. They simply take resources from suppliers, add some type of value to those resources, and then sell their product or service to customers. Since the industrial revolution, large linear businesses have dominated the economy. Value and competitive advantages were a result of efficiently operating the supply chain by being a low-cost producer and having economies of scale. Companies like Standard Oil, General Motors, General Electric, and Proctor & Gamble thrived.
Alternatively, platforms businesses connect and facilitate the exchange of value between a consumer and a producer. While linear businesses create value by manufacturing products or services, platforms create value by building connections and manufacturing transactions. Platforms have always been around, since the ancient marketplaces to local newspapers, TV broadcasters, stock exchanges, or even the Yellow Pages. They reduce transaction costs of time, money, and energy by making it easier to connect producers and consumers. Transactions are the product.
Platform businesses have several strong qualitative characteristics. There is no marginal cost of production since a third-party network of users create the production. Because the platform does not necessarily own production, it does not require all the resources that go into creating inventory, so the marginal cost of supply drops to zero. Costs of a linear business will always continue to rise as it grows, while the costs of a platform tend to decline exponentially with scale.
Platforms also benefit from network effects. While there are several different types of network effects, it generally occurs when the behavior of one user has a direct impact on the value that other users get using the same service. Language, telephones, or the internet, are examples of network effects. Greater scale leads to greater value for users, which in turn attracts other users and further increases scale. This self-reinforcing dynamic allows networks to scale rapidly once network effects set in. Of course network effects also work in reverse and value can quickly implode if reverse network effects set in and users leave a platform at a rapid rate.
The highly scalable unit economics, when combined with the self-reinforcing network effects, make it theoretically possible for a platform company to expand to the total size of the market. This creates a winner take all dynamic and makes it possible for a single business to gain a majority market share as an industry matures.
A platform monetizes by capturing a portion of the value it creates. As value grows, so does earning power. Profit margins improve drastically as a platform grows to dominate a market. This does not occur because a platform is raising prices or gouging suppliers the way a traditional monopoly might, but because the overall value the platform creates grows exponentially.
As networks become a larger part of the economy it has an important impact to the competitive landscape. In the old linear model, economies of scale were a result of investing in and growing internal resources. Successful companies had scale in sales & marketing, manufacturing, and distribution. The largest companies historically benefitted from aggregating and centralizing resources under one roof and managing a lean supply chain. It was more difficult for smaller companies to reach target markets. Higher barriers to entry provided these large companies the ability to earn big margins and historically be considered “high quality” businesses.
With the ability to connect a greater number of people through the internet, today’s most valuable businesses are those that can build and arrange large networks. At the end of 2018, five of the six largest U.S. companies by market cap were platform businesses: 1. Amazon.com, 2. Microsoft, 3. Alphabet, 4. Apple, and 6. Facebook. These businesses remove the gatekeepers and connect large, fragmented sources of supply, lowering barriers and democratizing access to customers.
The rise of platform companies does not mean linear businesses will no longer create value, just that barriers to entry will get lowered. Any business with unreasonably high margins and undifferentiated or commoditized products will face greater competition between products and services. Further disruption may occur for companies that historically controlled distribution. Brick and mortar retail, media outlets, industrial or medical supply chains, are among the disrupted or potentially disrupted. It’s like owning the only bridge over a river between two towns and then every person is given a speed boat. The question is how soon people get their speed boats and how effective they are at crossing the river on the speed boat.
Facebook (FB):
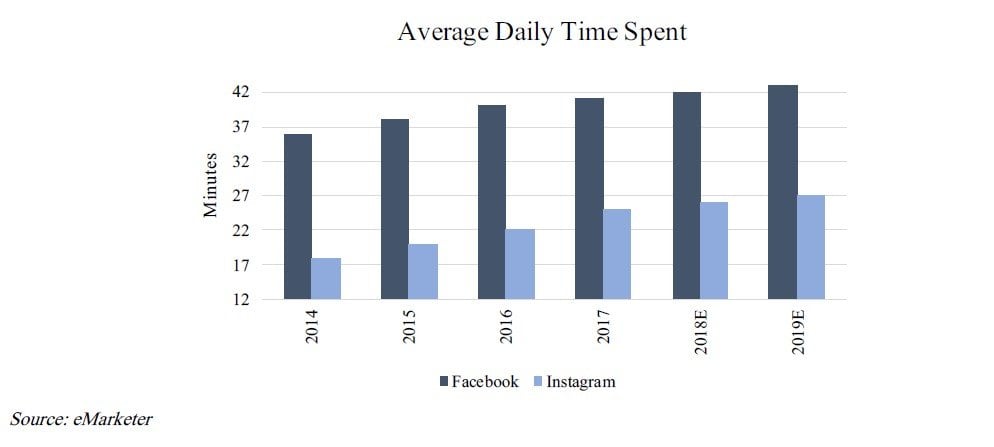
All this platform talk finally brings us to our recent investment in Facebook, one of the largest platforms in the world. Unlike some of our smaller, less familiar companies in the Portfolio, you are likely familiar with Facebook as either being one of the 2.7 billion monthly users across its four platforms of Facebook, WhatsApp, Instagram, or Messenger, or just from the amount of press it has received over the past year related to its use of personal data and potential role in political elections.
Facebook might seem like an unusual investment in the Saga Portfolio. How can one of the largest and most widely followed companies in the world be “under-valued”? We’ll save the extended answer to the question surrounding market inefficiencies in large caps for another letter, but a shorter explanation might be due to the market overweighting risks of recent regulatory issues and negative media headlines, underweighting long-term durable moats, and extrapolating negative sentiment far into the future. For purposes of this letter will focus on the specific investment case for Facebook.
Despite the negative headlines, Facebook is exactly the type of company we are looking for in the Saga Portfolio. Facebook may not be the most original idea given the 49 analysts that cover the stock, however it is not important to us whether Wall Street or the investment community agrees or disagrees with one of the Portfolio’s investments. Our simple, although not easy, goal is to grow capital at the highest possible rate over the long-term by owning high quality companies that compound earning power over time. If a rare opportunity like Facebook presents itself, we won’t hold back.
Facebook easily meets all four of our investing filters. It has a wide and growing moat, managed by a very smart and capable founder CEO with all his net worth in company stock, and importantly, we purchased the company at a very attractive valuation relative to its quality and growth potential.
While Mark Zuckerberg’s management has been questioned at times throughout Facebook’s history, his track record of starting and growing the company is impressive. Despite the numerous other social media companies at the time, Zuckerberg differentiated Facebook with his vision to use it as a tool to connect real people. Facebook was not going to be a place for users to masquerade behind fake accounts, but real people connecting and building real relationships. As obvious as that might sound today, it wasn’t the case in the early days of the internet when people largely interacted online anonymously.
To build such a network, Facebook had to verify identities by using college issued email addresses. Zuckerberg deliberately limited growth by using .edu addresses as a way to control fake profiles and build a specific culture of real identity within the platform. Facebook grew campus by campus at a fairly controlled pace, using local network effects within each mini college community. Before Facebook scaled, it adopted strict rules to prevent bad behavior, improve quality, and establish the desired community framework. It was essential for people to feel comfortable sharing parts of their personal life on the internet.
Building a social network is not easy. Throughout Facebook’s history there were doubts regarding its durability when considering the rapid rise and fall of other social networks like Friendster, peaking at 115 million users in 2008 or MySpace also peaking in 2008 at ~75 million users. There were also threats of new social media companies like Twitter and Snapchat, or the shift to smartphones from desktops. Google made several unsuccessful attempts at building a social network, first with Orkut in 2004, launching two weeks before Facebook was started at Harvard, and later with Google+ in 2011.
While the network effect is a significant part of Facebook’s moat, there is more to its durability than just being the platform to reach other users. A user’s account is a representation of the individual’s life that maps their personal history. The more memories, pictures, and videos posted throughout the years, combined with the habit for most users logging in on a weekly or daily basis creates high customer switching costs. Additionally, the value users get on the platform is increased from the news publishing, video hosting, and other apps and services built within the Facebook ecosystem. While the network effect attracts new users to Facebook, it’s the content that increases engagement.
The amount of data Facebook collects from users strengthens its moat over time. Facebook collects user data, providing the ability to analyze how users utilize the platform and improve engagement. Of course this data is the primary way Facebook monetizes the value it creates by providing advertisers the ability to target very specific individuals that they otherwise would not be able easily reached. There are also unknown opportunities that are not reflected in current fundamentals that Facebook could monetize this data either through artificial intelligence or its augmented reality segment Oculus. Facebook’s moat is wide, the more people join, the more content is created, the more data is generated, and the ecosystem strengthens.
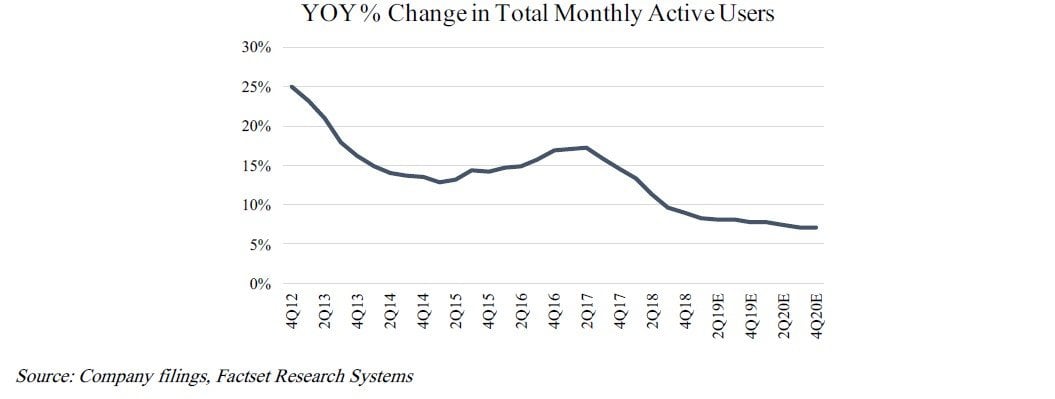
The long-term trends are very impressive. There hasn’t been a quarter that user growth has declined sequentially in any region.
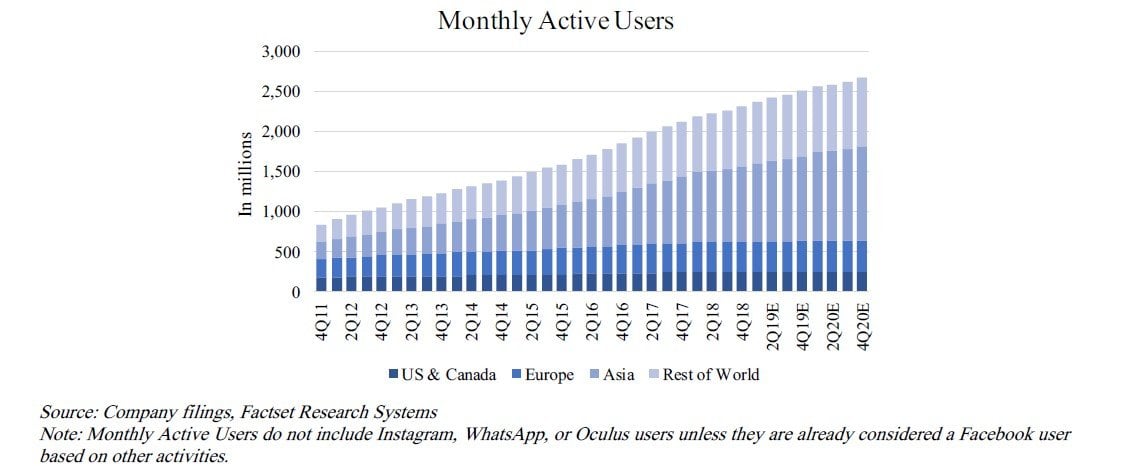
Note: Monthly Active Users do not include Instagram, WhatsApp, or Oculus users unless they are already considered a Facebook user based on other activities.
In 2018, there were 7.6 billion people in the world and 4.2 billion with internet access. Over 800 million of those internet users were in China where Facebook is restricted. With 2.7 billion active users across the Facebook platforms, user growth is expected to slow to the high single digit range.
Earlier in Facebook’s history, there were important questions whether the company would be able to effectively monetize their network through an ad-based model that would not hurt the user experience. Zuckerberg strategically delayed monetizing the platform until after the network and the culture was secured. When Facebook went public in 2012, average revenue per user was $1.54, primarily generated from the U.S. & Canada user base. Last year is was $25.10.
Revenue per user is significantly higher in the U.S. & Canada and Europe and still fairly low in Asia-Pacific and the Rest of World regions.
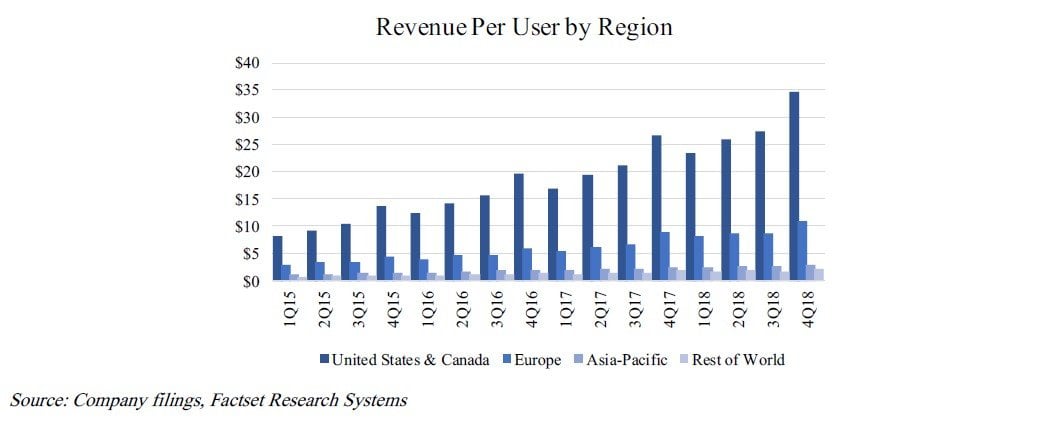
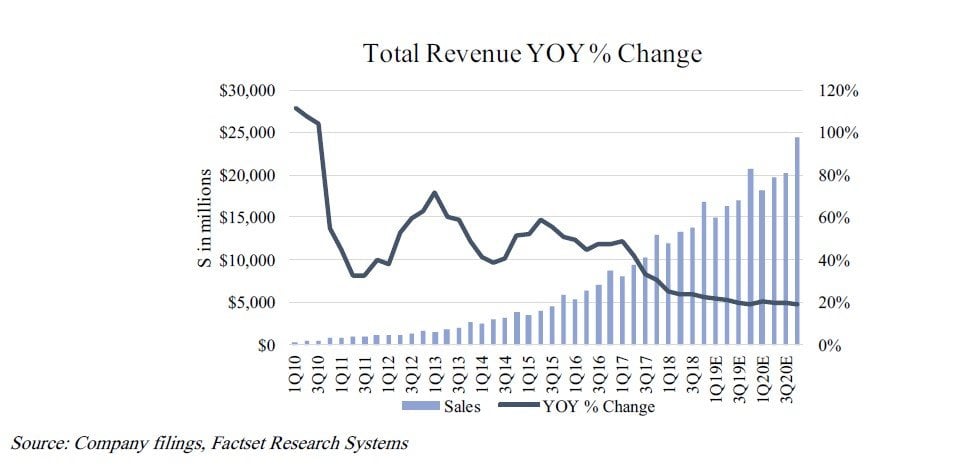
Since 2012, the average revenue per user has grown to $7.37, providing a 25% CAGR. Growth has moderated but still remains 19% in 2018.
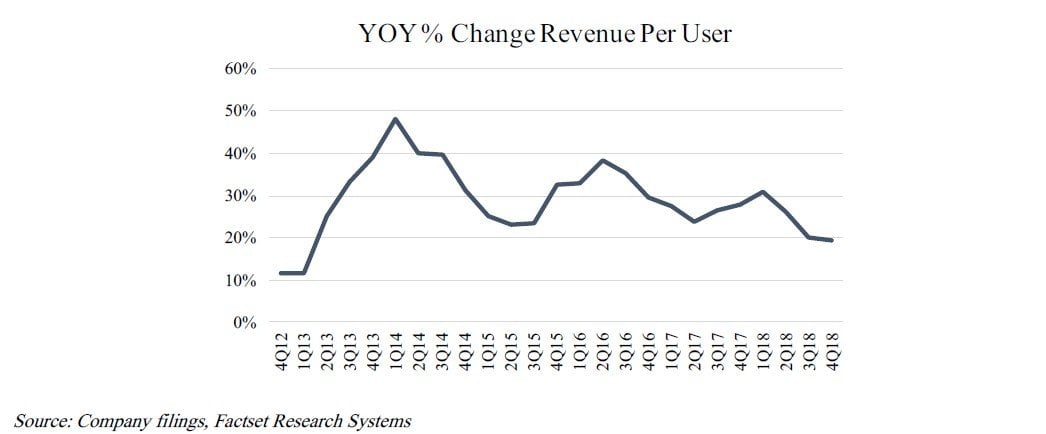
Total revenue growth is expected to be decline to ~20% in upcoming years.
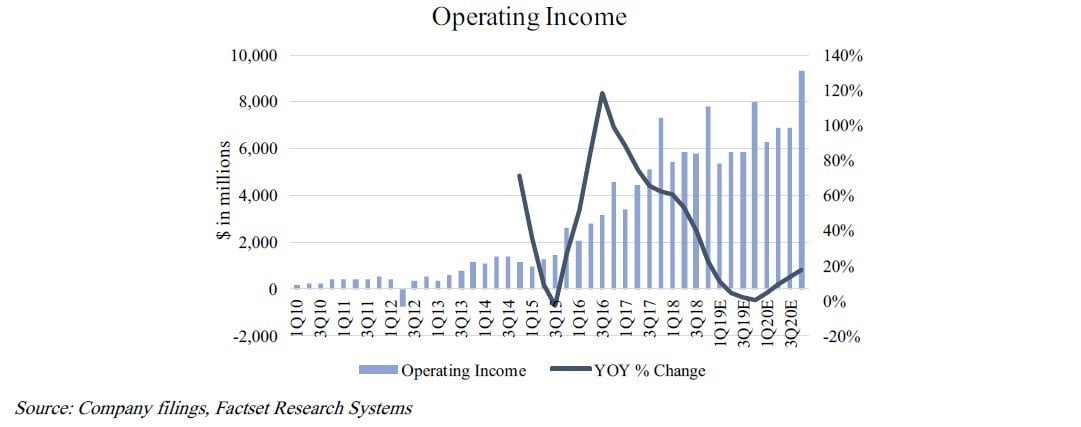
Operating income is expected to be flat in 2019 due to increased expenses in infrastructure, innovation, and safety & security related investments. Beginning in 2020, operating income growth is expected to reach 15-20%.
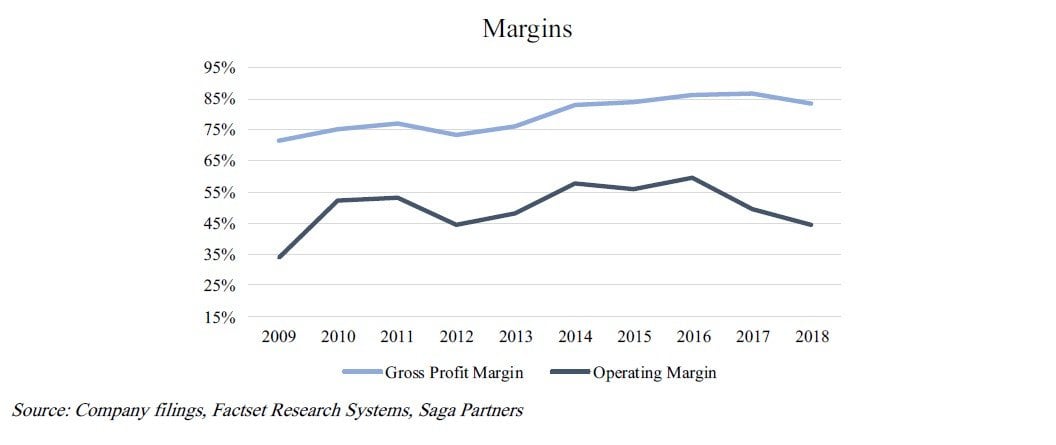
Facebook’s cost structure reflects the strength of a platform company when it has become the dominant company in its space. Because its users are the producers of free content, Facebook does not require all the resources that go into creating inventory. The marginal cost to grow ad revenue is nominal, providing greater than 80% gross profit margins. After paying for R&D, marketing & sales, and G&A costs, Facebook has nearly 50% operating margins providing very strong cash flow as evidenced by the $41 billion of net cash sitting on the balance sheet at the end of the year. As a general rule of thumb, it’s a good sign when a company generates a ton of cash that continues to build up over time.
Facebook has become the single platform that helps facilitate more connections and interactions between people that otherwise would not have existed, creating a lot of economic and social value. It is hard to know what the true earning power of Facebook will be in 10 years. We simply expect future earning power will be significantly higher than today. The opportunity to grow revenue per user outside the U.S. & Canada is significant, as well as the fact Instagram is only in the early phase of monetization and WhatsApp has yet to be monetized. We also believe there are other ways that Facebook can monetize the value of its network unknown to investors today.
Last quarter provided an amazing opportunity to purchase the company at a low multiple to current earnings. At the end of the quarter, Facebook was selling for market cap of $376 billion. If you back out the $41 billion of net cash on its balance sheet, its enterprise value was $335 billion. This is only 13.5x its $25 billion of operating income or 15x its $22 billion in earnings during 2018. These multiples strike us as extremely attractive considering the durability of Facebook’s platform and its growth potential. Facebook’s moat is strong and growing. We are excited to add Facebook to our group of portfolio companies and slightly embarrassed it took a 40% drop in shares to help us realize what a great long-term investment Facebook truly is.
Conclusion
As we move into 2019, we are excited about the Portfolio companies and even more excited about their current valuations. We are constantly combing the markets for companies that meet our four filters and sometimes a near-term crisis provides the opportunity for us to brush the cobwebs off our eyes and look at a company in a slightly different light.
We are grateful for the opportunity to manage our investor’s hard-earned capital. The success of the Saga Portfolio requires investors that are stable, long-term, and realistic in their expectations. So far, we could not be happier in this regard. A strong investor base is a true competitive advantage in the investment management business. We would love to continue to grow with like- minded investors. If you know someone that may potentially be interested in an alternative investment strategy like the Saga Portfolio, feel free to forward on our information. Outside our close friends and family, the best source of like-minded investors have come from referrals of existing investors.
We hope you found this update helpful in understanding your portfolio. If you have any questions or comments please reach out, we are always happy to hear from you!
Sincerely,
Saga Partners
Joe Frankenfield, CFA
Michael Nowacki
This article first appeared on ValueWalk Premium


