Here’s a question that might throw you: What is the difference between a journalist and an investor?
The difference is more minute than you might think, and you can trace the history all the way back to the very first hedge fund. Alfred Winslow Jones had a doctorate in sociology and wrote for Fortune magazine for ten years before realizing that a levered, hedged portfolio could produce far superior risk adjusted returns, and went on to found A. W. Jones and Co, outperforming the best mutual fund of its time by 44%. For the many decades since, journalists have continued to go into money management, and money managers have continued to write, from book length theses like David Einhorn’s Fooling All the People, Some of the Time to simple, understated blogs like John Hempton’s “Bronte Capital.”
Q3 hedge fund letters, conference, scoops etc
There is a real reason for the close relationship between the professions of writing and investing. To make their name, journalists must get scoops and break news at the micro scale, but also identify and tie together multiple disparate data points to cover emerging trends at the macro scale. This closely matches the interplay of near term and structural concerns that equity analysts must deal with. While equity analysts are ultimately competing for capital, journalists must compete for space above the fold. There is limited research time, limited room for output, and a potentially unlimited space of stories that may be worth following. Miss the big trade or the big story of the year, and you underperform.
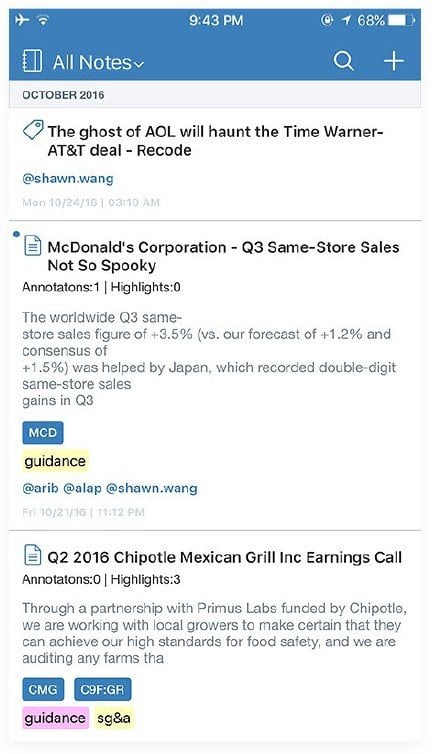
While note taking software has long been a core edge and focus for journalists to gather multiple disparate threads on stories they are working on, the same cannot be said for the equity analyst toolset. Sentieo helps make equity analysts more effective by enabling them to take notes on everything. From clipping web articles, to copying snippets from SEC filings and transcripts with linkbacks to sources, to emailing in your notes and writing meeting points on tablets and phones. There is a way for you to pull that all in and understand the unfolding story. The Sentieo iPhone app works just as well offline as it does online:
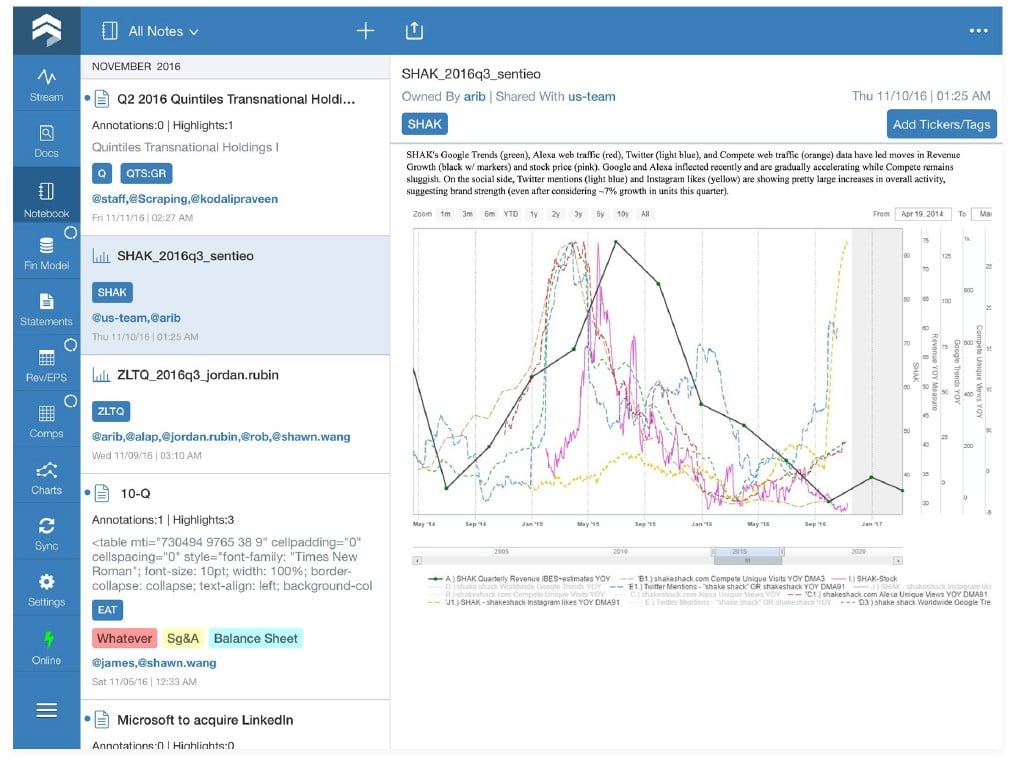
But understanding is only half the battle. Once you have your idea, you have to get it out there and tell your editor/portfolio manager that there is a story here. And while pages and pages of words are nice and Excel models can be marked up with all sorts of fancy formatting, nothing tells a story better than a chart.
Sentieo’s Plotter tool is an advanced financial visualization engine that not only makes it easy for you to extract the data you need to tell your story, but also makes it easy for you to play around with that data, saving you time on maintaining your models and Excel formulas. You can toggle between YoY and moving average comparisons between peer sets in one click, coming up with unique empirically valid insights with far less pain. Of course, every plot you create is also saved as a note, for your future self to play around with, or for your future self to make a note of…
But of course, once you have a great story to tell, shouldn’t you stress test and share it?
Access the full whitepaper by Sentieo on the 7 Habits of Highly Effective Analysts here.


