Farnam Street letter to investors for the month of October 2018.
The Arrogance of Investing
Buying a stock is an act of sheer arrogance. It’s easy to forget, but there’s always someone on the other side of every trade. When you buy, you are saying, “What a dummy! I can’t believe they parted with their ownership of this company for such a low price. I must be smarter / more-informed / more-disciplined than they are. What luck!”
Every time you sell, there’s the same arrogance: “I can’t believe they took that company off my hands for such a high price! I must be smarter / more-informed / more-disciplined than they are. What luck!” The time frames matter: you can be right in the short-term and wrong in the long-term, or vice versa. But in nearly every instance, someone is right and someone is wrong when making a trade. How sure are you that you aren’t the dumb money on the wrong side of the trade? Warren Buffett is fond of the poker aphorism: “If you’ve been in the game thirty minutes and you don’t know who the patsy is, you’re the patsy.”

Q2 hedge fund letters, conference, scoops etc
Mr. Market Revisited
Warren Buffett’s mentor, Benjamin Graham, crafted an allegory to explain market dynamics and help us understand who we’re up against. Graham asked us to imagine we are one of the two owners of a business. The other owner is a fellow named “Mr. Market.” Every day, Mr. Market offers to sell us his share of the business, or to buy our share. Mr. Market is a manic-depressive; his estimates of the business’s value bounce off the guardrails of dire pessimism and hopeful optimism. Although his moods can be extreme, he’s still an accommodating chap. Although we usually decline his offer, he happily shows up the next day with a new one. It’s our job as investors to understand his strengths and weaknesses and take advantage of his mood swings.
Your humble author would like to assume we aren’t the patsy at the poker table, but how do we know? Who is on the other side of the trade from us? Who is Mr. Market today? Let’s dive in and find out…
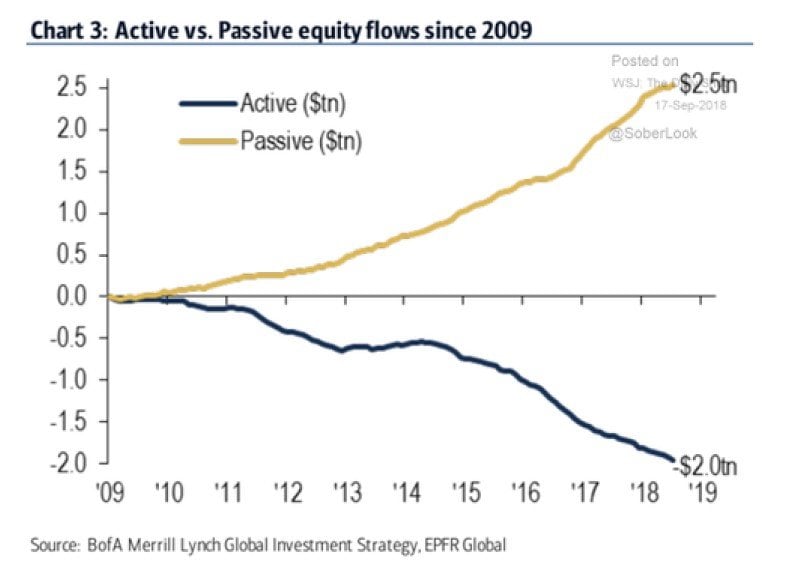
Roughly forty percent of U.S. trading these days is exchange-traded index funds. Indexing giants like BlackRock and Vanguard now own vast swaths of the market and are the largest shareholders in nearly all the major companies in the S&P 500. The massive flows from active to passive in the last decade are measured using the t-word.
By definition, index funds have little interest in the fundamentals of the businesses they hold. They are price indiscriminate: when money comes in the door at Vanguard, they go buy more of everything in the index. Flows trump fundamentals.
Indexing creates some odd structural perversities:
- Many indexes base their allocations on the float (aka availability of stock to buy and sell). If Warren Buffett bought more shares of Berkshire Hathaway in his personal account, thus reducing the available float, the index fund would penalize Berkshire and want to own less BRKA. Wait, Warren likes the price enough to buy personally, and now you want to systematically own less? Raise your hand if you think that makes any sense.
- Due to the aforementioned price insensitivity, some weird market dynamics have developed. The average U.S. stock is in 115 different indices (there are a lot of indices out there). Stocks which are in more than 200 indices are 2.5x more expensive than stocks which are in less than 75. Said more simply, if you’re a darling that’s included in a lot of indices, Mr. Market wants you, price be damned.
- The Biblical flood of passive dollars has driven up the prices of these companies, making the index itself go up, which then attracts more passive dollars. The “proof” of rising prices creates a virtuous circle of momentum. (Remember this one with U.S. housing in 2006?) If a company is an “indexorphan” and isn’t chased by passive money, Mr. Market hasn’t been very interested. The odd pressures from indexing create fault lines of opportunity for value-conscious investors. However, they’re difficult to realize until the tide of passive money abates and companies are judged based on their business prospects, not which index they belong to.
- Rory Sutherland recently observed: “The genius of markets lies not only in aggregating people’s preferences but also in aggregating choices made in a wide variety of messily different contexts, and with a variety of different decision-making paths. The danger is that if you make the informational context the same for everyone, and the decision-tree the same for everyone, the information the market receives will increasingly reflect that artificially narrow context, so will no longer reveal the wider preferences of market participants. The individual decisions may seem better, but the market will be dumber overall.”
Pause for a moment to imagine this passive tsunami receding. A change in psychology toward fear upsets the marketplace. Rest assured it will happen again, and only hindsight will show the match that lights the fuse. Safety is now prized and a pessimistic Mr. Market hates his “risky” stocks. The index funds don’t care what prices their shares fetch, by mandate they have to get out. Now. Selling pressure crashes prices, begetting more fear and more selling. A once virtuous cycle turns vicious.
If it’s like previous downturns, we may pessimistically undershoot the fundamentals when the blood hits the streets. (We’re overshooting the fundamentals with optimism today.) Sounds like it will be a scary time to be an investor, right? Except, that will be when FSI earns our keep. Cross your fingers for this generational buying opportunity. Or better yet, send cash. Fortunes will be made, and we’ll be participating en force when the tide shifts and patience gives way to action. We’ll be talking clients off of a different ledge at that point--such is the nature of the advisor’s role.
No one knows how long this current indexing insanity can last. I’m willing to admit it could be a nightmarishly long time (please, no). But eventually, the fundamentals of a business will matter again. My hunch is we’ll scratch our collective heads and wonder why anyone thought all this passive indexing made sense. “If everybody indexed, the only word you could use is chaos, catastrophe. The markets would fail.” – John C. Bogle, founder of the the first index fund
To recap, forty percent of Mr. Market is flat-out index driven. That leaves sixty percent as “actively managed,” meaning managers appraising businesses. Sixty percent is misleading though, as a surprising number of actively-managed funds are actually closet indexers. Many aim to just do what the index does, and there are good economic reasons for their hiding in the closet. Managers don’t want to lag too far behind the benchmark for fear of losing their jobs. Screw the fundamentals, I have to own FANG or I’ll get fired. The managers are doing what makes sense for themselves, though not their clients. As J.M. Keynes quipped, “Worldly wisdom teaches that it is better for reputation to fail conventionally than to succeed unconventionally.”
Researchers have devised metrics like “active share” to identify these closet indexers. Active share is the percentage of a portfolio’s holdings that differ from the benchmark index. A high active share means the fund manager is taking a chance and aiming to be different than the index. At FSI, we don’t have a specific benchmark to measure active share against, but one look through our portfolio and it’s clear we score off the charts and we own a lot of those neglected index orphans. They’re the only businesses on sale these days.
What’s the rest of the industry’s active share look like? Seventy percent of U.S. mutual fund assets are held in funds with an active share less than 80%. We can safely throw at least another twenty percent of “active” managers back into the index bucket due to hiding in the closet. That accounts for sixty percent, leaving us forty percent of Mr. Market to still classify.
It’s hard to pin down the exact number, but roughly thirty percent of what’s left is made up of highfrequency trading. These are computer algorithms which buy and sell in milliseconds, mostly to each other in a strange game of lightning cat and mouse. They also front-run slower human traders by sensing a buy order, then rerouting to a faster exchange to buy and then sell to the human at a slightly higher price. You’d think this obvious front-running would be illegal, but the exchanges make a lot of money by allowing the HFT computers to be close to the exchanges (co-location), so everyone looks the other way. If you’re an active human trader, you’re likely getting micro-scalped on every trade by HFT “liquidity providers.” For the record, we have so little portfolio turnover that I don’t worry much about these algovampires.
A startling stat: in 2008, the average holding period for a security on the New York Stock Exchange was two months. Seems brief to me, but OK. That average today?
Twenty seconds.
Yes, you read that correctly: the average holding period today is just twenty seconds. So much for Mr. Buffett’s quote, “If you aren’t willing to own a stock for ten years, don’t even think about owning it for ten minutes.” What about twenty seconds, Mr. Buffett? Don’t be surprised if there isn’t another flash crash due to the financial grab-assery of high-speed trading.
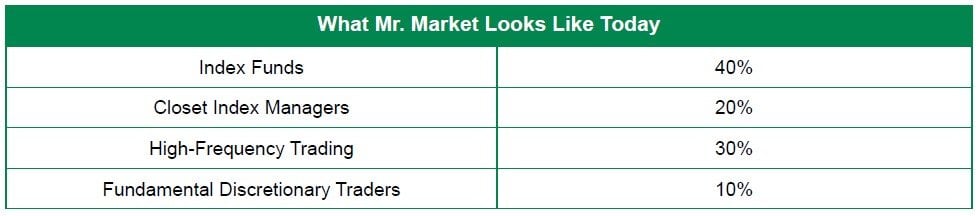
That leaves just ten percent of Mr. Market as a potentially fundamental-driven investor. We can categorize that ten percent even farther based on a spectrum of the method of analysis used by these discretionary investors.
On one end, you have technical traders who look for patterns in the price of a stock with little regard for the actual business. They’re short-term oriented and trade on speculation around news flow. They might not be able to name the CEO of the company they’re trading. Doesn’t matter as long as the price action is right.
On the other end you have long-term investors who diligently research all aspects of the business itself. The stock price movement is low on the list of concerns--they’re studying income statements and balance sheets. They want to understand the economics of the business, the management, and the industry dynamics. They think like owners. I don’t have to tell you which end of the spectrum you’ll find FSI.
“Investing without research is like playing stud poker and never looking at the cards.” -- Peter Lynch
You start to realize how rare our investment approach is on an asset-weighted basis. We really are challenging the status quo. I’m fully aware it’s a dangerous place to be from a career standpoint, but it’s the only approach that makes sense to me. I agree with Jean Marie Eveillard’s observation: “I’d rather lose half my clients than half my clients’ money.”
As a physical reminder, we’ll be sending out clients a little something to make the point that they are owners of actual businesses, and not just squiggly lines on a graph.
A tangible example of how the new Mr. Market has changed the investment game might help. In 1963, American Express was involved in a scandal over salad oil. A huckster had been filling large storage vats of soy-based oil with sea water and AmEx had certified the oil was there when it wasn’t. AmEx faced $150 million ($1.5 billion in 2017 dollars) in potential losses from fraud and the stock price was cut in half overnight. Mr. Market questioned whether AmEx would survive the hit to their reputation. An unknown 33-year-old fund manager recognized the scandal wasn’t an existential threat and loaded up on AmEx shares. That fund manager’s name was Warren Buffett, and AmEx was one of his career-defining investment home runs. Berkshire still owns around seventeen percent of the company today.
What might happen should a similar scandal occur today? News of AmEx’s trouble would leak. The HFT computers would be the first to act and probably programmatically-sell shares they held based on news input. A slice of human traders would also feel inclined to sell the bad news.
Yet sixty percent of Mr. Market is not really paying attention. Yes, the stock would take some hit, but nowhere near a fifty percent chop. Let’s say it dropped ten percent--not enough for a young Buffett to get very excited. He has to wait for a fatter pitch to define his career.
Mr. Market overreacted to the AmEx news in 1963. Today, the market seems to underreact. For example, the same American Express fell only -6.4% when it was announced that Costco was severing their relationship with AmEx in 2016. Losing Costco could have been a more meaningful threat to AmEx’s future than a one-off salad-oil fraud. Mr. Market only yawned.
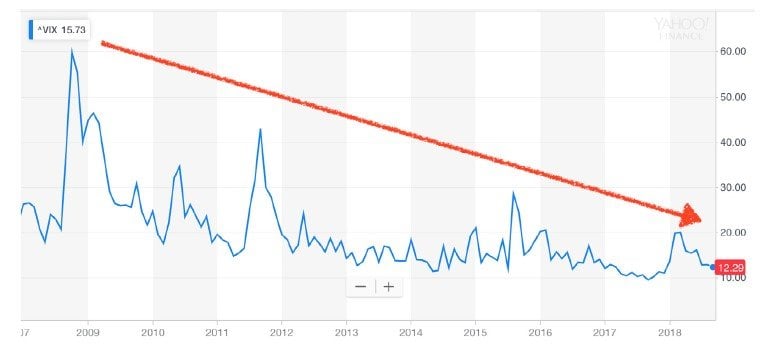
Of course, there will always be individual opportunities that pop up. But as the below volatility chart shows, there haven’t been a lot of wild price movements, like an AmEx cut in half, to take advantage of. My guess is there’s always been a bid from an index fund before the price can really dislocate.
The composition of Mr. Market has changed, which means the methods to take advantage need to change to keep pace.
Heavy indexing (plus implicit assumptions that central banks will step in should markets ever lower prices) have taken the idiosyncratic overreactions of each business and swept them under the rug into a giant pile of systematic risk. Importantly, the risks haven’t disappeared; they’ve just been reorganized. The opportunities may now come all at once in a big block like 2008, rather than on an individualized basis like 1963 AmEx.
Never forget that even passive money still rests on human decisions. How attached to an index fund is someone during a panic?
Truth be told, I liked the old Mr. Market better. This new game requires a lot more patience. But we don’t get to decide our investment climate. We only get to decide how we respond.
Shedding New Light on Today’s Valuations
Here’s another way to think about the expensive valuations in today’s market. If you’ve purchased solar panels for your house, you probably did some math on the payback period. The payback calculation is found by dividing the upfront cost by the savings per year (aka “yield”). A $20k outlay for panels that saved $2k per year in reduced energy bills would give you a 10-year payback ($20k/$2k). Thanks to advancements in panel efficiency and price reductions, solar’s payback has fallen from 20 years to 6-8 years on average today. Let’s use the same approach to value the S&P 500. The market currently trades at 35x price-to-free-cash-flow, implying a 35-year payback period! You probably wouldn’t buy solar panels that would take three decades to payoff. And yet that’s the math of owning a U.S. index fund today.
A 35-year payback equates to a 2.85% yield. Wait a second... isn’t the yield for a “risk-free” 10-year US Treasury over 3%? Yes it is. So you can get a 3% risk-free yield or 2.85% owning the index? Why would you accept a lower return for a higher risk product? As more realize the absurdity this simple math implies, they’ll ask themselves the same question and arrive at the conclusion: it’s time to sell.
It’s no coincidence that Jeremy Grantham’s GMO, a value-based firm which manages $80 billion, recently issued a 7-year real return forecasts of -4.90% for U.S. large caps. That compounds to a -30% total expected loss by 2025. GMO has a good track record with their 7-year forecasts, nailing both the Dot Com and Housing bubbles.
How’s the Setup?
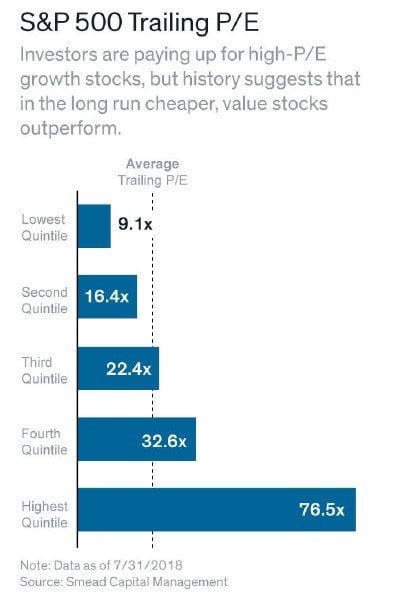
As we’ve highlighted before, the overall valuation of the market is instructive, but is still just a single data point. More nuanced thinking is required. For instance, 1982 saw the average trailing P/E around 8x, when the historical average is 15x. You can throw a dart when stocks are priced at eight times earnings and find winners. And indeed, 1982 was a great time to buy as it marked the beginning of an incredible bull run.
Conversely, the Dot Com bubble in the late 1990s brought with it the most outrageously expensive valuations we’ve seen in the U.S. with a P/E north of 40x. It must have been a terrible time to invest, right? Alas, it’s not so simple.
The 40x multiple masked a swath of surprisingly high quality businesses priced on sale. If you remember the narrative of that time, new-economy internet stocks were all the rage and no one wanted anything to do with boring, money-making old-economy snoozers. Value investors were able to fill up their cups with great bargains, despite the market’s nosebleed valuations. This setup produced halcyon days for value: as investors realized cash flow still mattered, they repriced most of the market strongly downward and the typical value investor’s portfolio upward. To be up when everyone else is down is career-making performance, so it’s little wonder we see a large cohort of value investing gurus who cut their teeth in the 1999-2002 period.
Does that same dream-for-value setup exist today? Sadly, no. As the embedded graphic shows, the cheapest quintile of the S&P 500 is still priced at 9.1x. Said another way, the cheapest 20% of the market today is more expensive than the average in 1982. The second cheapest quintile at 16.4x is above the long term average of 15x. Who’s buying that 76.5x quintile? Mr. Market via an index fund.
Looking around the store, there aren’t many markdowns and the discount bin has been picked through several times over. That’s OK, we’ll come back later.
Interesting side note: from 6/1/1999 to 2/29/2000, the final blow off of the Dot Com bubble, Warren Buffett was down -39%. The S&P 500 was +7% and QQQ (tech-based Nasdaq) was +110% in those 9 months. Even the greatest investor of all time had to stomach serious underperformance at points in his career. It makes today’s lagging of value investing feel tame by comparison. As you’d expect, the Oracle of Omaha knew what he was doing and bounced back in a big way.
During that difficult time period, Mr. Buffett had this to say:
“If they are in the strike zone at all, the business “pitches” we now see are just catching the lower outside corner. If we swing, we will be locked into low returns. But if we let all of the today’s balls go by, there can be no assurance that the next ones we see will be more to our liking. Perhaps the attractive prices of the past were the aberrations, not the full prices of today. Unlike Ted [Williams], we can’t be called out if we resist three pitches that are barely in the strike zone; nevertheless, just standing there, day after day, with my bat on my shoulder is not my idea of fun.”
Amen, Mr. Buffett.
Final Thoughts
If you’ll indulge me in an analogy, I view myself as the captain of a ship. Ideally, all of my passengers (clients) are planning to go to the same place. Scanning the horizon, I see foreboding skies and have plotted a course to steer us around the clouds. I hope you don’t mind that it could take a little longer to get to port because we’re avoiding the storm, but the primary goal is to make sure all souls on this vessel arrive safe and sound. As the saying goes, to finish first, you have to first finish.
“Investors should favor strategies and managers that emphasize limiting losses in declines above ensuring full participation in gains. You simply can’t have it both ways.” -- Howard Marks
We’re looking forward to seeing all of you at the FSI Bash on Sunday, October 7th.
And as always, we’re thankful to have such great partners in this wealth creation journey.
Jake & Lonnie
Bonus Section

Fasten your seat belts as we breeze through a handful of crazy charts and statistics:
- The August budget report showed that U.S. government outlays (aka total spending) soared to $433.3 billion. In one month. That’s not only thirty percent higher than a year ago, but the highest government monthly outlay of any month on record. Winning!
- It’s not just the United States. Governments of advanced economies have really put themselves in hock since 2007 (see Figure 1).
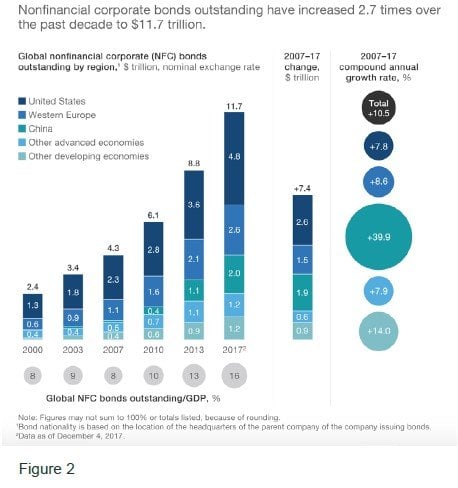
- Not to be outdone, the annual growth rate of debt by corporations around the world was an incredible 10.5% from 2007-2017. That’s almost 3x (see Figure 2). So. Much. Borrowing.
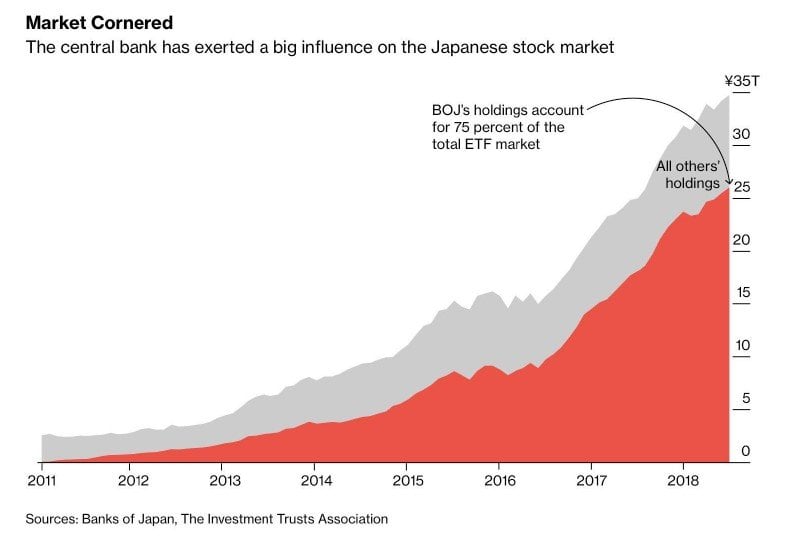
- Mr. Market in Japan deserves its own special mention. The Bank of Japan has now purchased seventy-five percent of the total ETF market. If you’ve sold anything in Japan in the last three years, it’s likely been to their central bank. That’s near-Soviet levels of intervention; can we even call this a “market” anymore? How do you unwind this craziness--does the BOJ sell ¥25 trillion worth of stocks someday? Bananas.
- The levels of fiscal stimulus (through government deficits) and monetary stimulus (through central bank action) have been without precedent. Government’s firm grip on the wrist of Adam Smith’s invisible hand is more than a little disturbing. We haven’t begun to understand all of the consequences. Yet the rest of the world might be starting to wake up to the thought that everything isn’t rosy. Here’s the percent below the all-time high we find various country ET Fs:
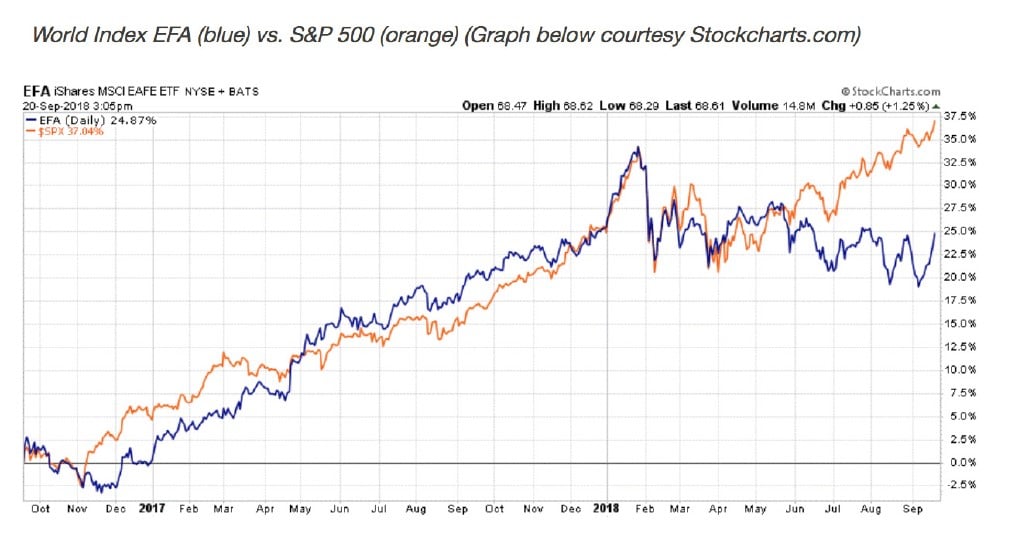
Turkey -67%, Russia -55%, Brazil -54%, Italy -42%, Indonesia -30%, Argentina -28%, South Africa -27%, Mexico -26%, China -23%, South Korea -14%, Germany -12%, India -9%, UK -8%, Japan -7%, Australia -6%, Canada -5%, France - 4%.
And the United States 0%.
We own a Russia ETF already and are keeping an eye out for future bargain prices on assets around the world. The graph below shows most of Earth peaked in January of this year. We aren’t hearing much about it Stateside as the U.S. continues to do its best Wile E. Coyote impression. Don’t look down.
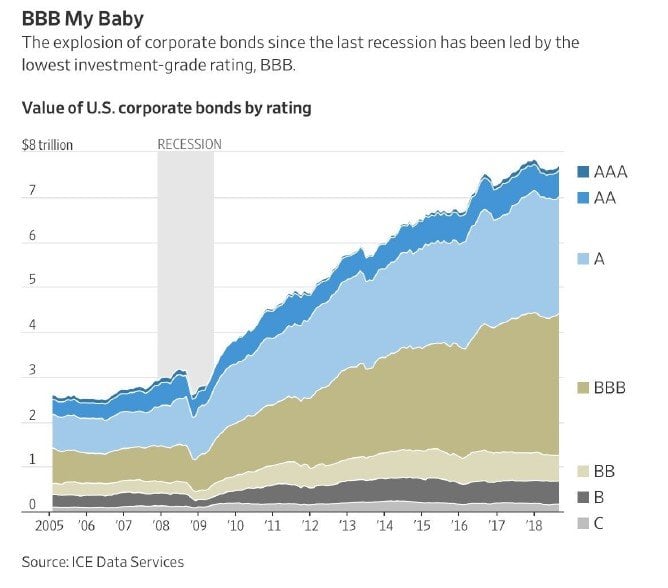
- U.S. corporations have borrowed a record amount of money. The biggest increase has been in BBB-rated debt. Investors have been starved for years by savings accounts which pay 0% and U.S. Treasuries giving them 1-2%. To scratch out more yield, they’ve loaned money to lower-quality companies while also relaxing covenants (terms of the loan that protect investors). This isn’t a problem when business conditions are favorable, the companies can meet their debt obligations, or rollover existing bonds into new debt. But there’s little margin of safety when default rates pick up and liquidity dries up. Sadly, many people who thought they were being conservative by choosing bonds over stocks are going to lose a lot of money.
“Observation over many years has taught us that the chief losses to investors come from the purchase of low-quality securities at times of favorable business conditions.” -- Benjamin Graham
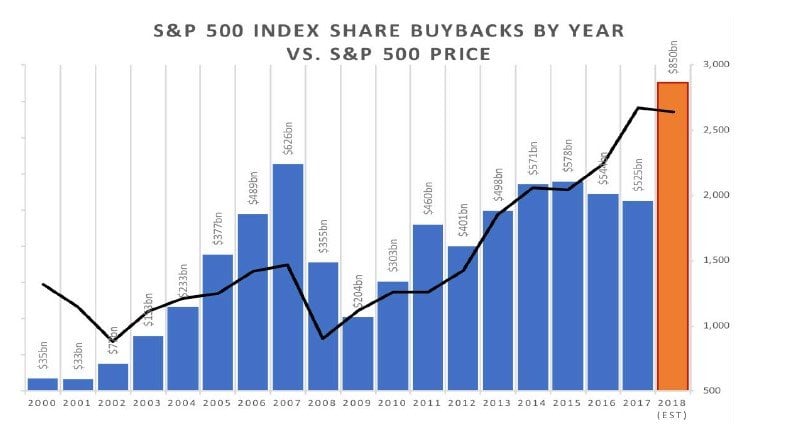
- What have the corporations done with all this borrowed money?
One answer is stock buybacks. We’ve already surpassed the previous high for record buybacks in a single year, and there are still a few months left in 2018. The previous peak? 2007. Whoops. Management teams of the S&P 500 don’t have the best track record when it comes to buying back their shares at bargain prices.
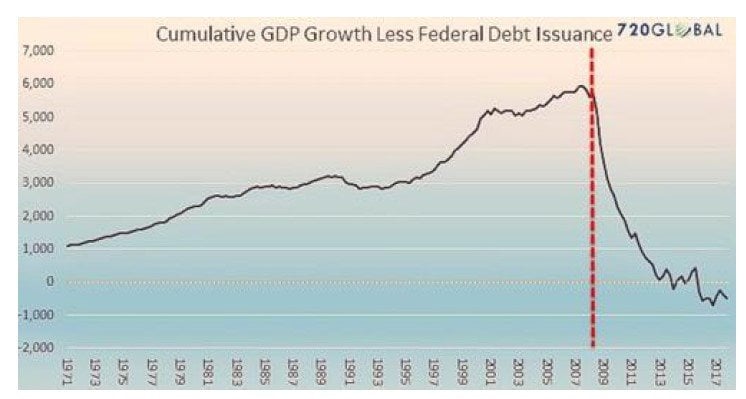
- All this debt makes me wonder how much of our historic economic “expansion” is just borrowed money. If you’re putting everything on credit cards, is that still considered good economic activity we should get excited about? The below chart attempts to address that question by showing U.S. GDP growth minus Federal debt issuance. That doesn’t look encouraging.


