Artemis Capital Management LP letter to investors for the second quarter ended July 2018, titled, “What is Water in Markets?.”
Volatility and the Fragility of the Medium
There are these two young fish swimming along, and they happen to meet an older fish swimming the other way, who nods at them and says, “Morning, boys, how’s the water?” And the two young fish swim on for a bit, and then eventually one of them looks over at the other and goes, “What the hell is water?”. – David Foster Wallace, This is Water (2005)
“This is Water” is the title of a commencement speech delivered by David Foster Wallace that has become a masterpiece of meta-thinking. If you haven’t listened to it, put down this paper and do so now. It is worth 20 minutes of your life. The Foster Wallace parable of two young fish ignorant of the medium that defines their reality is so important on many levels. Foster Wallace contends that we swim in a world defined by self-centered thoughts, that serve to make reality visible, but should never be mistaken as fundamental truth.

Q2 hedge fund letters, conference, scoops etc
In capitalism the medium that defines reality is fiat money. To this point, does money exist? This seems silly to ask but it is very important philosophically. Yes, money exists in the sense that you can purchase goods and services with it. At the same time, money is only important because of a collective belief in it, and is worthless without that. This is true of any human construct: markets, words, brands, and nation-states… all abstract mediums that have meaning because we collectively believe they do, and hence they give form to reality, but are not real independent of our thoughts.
In markets and in life, we swim in mediums of thought abstractions… the same way a fish swims in water. When the medium collapses, so does the reality… causing us to question the nature of both. As Foster Wallace eloquently explains, “The immediate point of the fish story is that the most obvious, ubiquitous, important realities are often the ones that are the hardest to see and talk about.”
Volatility is always the failure of medium…the crumpling of a reality we thought we knew to a new truth. It is the moment where we learn that we are a fish living in a false reality called water… and that reality can change... or there are other realities. True volatility isn’t the change of the thing, it’s the changing of the medium around it and the realization that the thing never really existed in the first place.
This is all you need to know to understand when the volatility storm will truly come. It is not about valuations, money printing, or where the VIX is at any point. When the collective consciousness stops believing growth can be created by money and debt expansion the entire medium will fall apart violently, otherwise it will continue to be real. The belief that the medium is the reality is what holds the edifice together temporally.
This letter is divided into three key themes: The first part will discuss fragility of the market medium; the second will discuss how the volatility in February was a symptom of a much greater liquidity problem; and the third will discuss how flows are more important than fundamentals when the medium dominates truth.
Out of the fishbowl and down the drain we go…
Fragility in the Medium
Investors swim in a pond of bid and ask prices. Without a bid and ask there is no price discovery… and the market… like a fish out of water… dies. Now here is an interesting question: does the market create value, or can value exist without a medium to facilitate it? A silent revolution is now being fought for the soul of investing between two contradictory schools of meta-thinking, each with their own strategies and central planning philosophies to support them. These two schools are the following:
1) Value is independent of the medium and intrinsic to the asset: The classic school of investing embodies the value investing principals of Graham and Dodd as put into practice by investors like Warren Buffet (younger version), Seth Klarman, and David Einhorn. In this school, the bid and ask prices of an asset do not represent value any more than a picture of a “pipe” is a real pipe. Liquidity is a highly flawed medium to express value. Although prices may fluctuate they are independent from the intrinsic worth of an asset. If you want to smoke a pipe, the picture is not sufficient to provide value.
2) Value is generated from the medium. In the second school, liquidity is the sole determinant of value as defined by a constant bid and ask price. An asset is only worth what someone is willing to pay for it at any given moment. If Facebook, Snapchat, Tesla, Ethereum, and Ripple keep going up, who cares why, as long as someone is willing to pay. When market participants gain confidence in a quantitative investment factor (growth, low volatility, cat ownership of company management), it becomes real, regardless of whether it makes sense. As long as people supply a bid and ask price, the medium is the reality, so to speak. The school is also supported by modern central banking policies. If a picture of a pipe looks like a pipe, it is a damn pipe, especially if people buy more tobacco.
The second meta-view of value is now winning the revolution and dominating central banking and institutional asset flows. Passive and factor-based investments are just the most obvious symptom of this new worldview. If value is “created” by the medium of money, you don’t need to pay people to find it, hence active investors should be replaced by passive index funds, systematic trading, and factor-based quantitative investments. Today fundamental discretionary traders only account for 10% of trading volume in stocks according to J.P. Morgan, while rules-based strategies account for 60%. Since the recession $2 trillion in assets have migrated from active to passive strategies. Starting this year, over 50% of the assets under management in the U.S. will be passively managed according to Bernstein Research. Almost a decade of unprecedented global monetary stimulus resulted in the best risk-adjusted returns for passive investing in over 200 years between 2012 and 2017. Large capital flows into stocks occur for no reason other than the fact that they are highly liquid members of an index, and those capital flows chase the hottest ETFs and collections of stocks (FANGs).
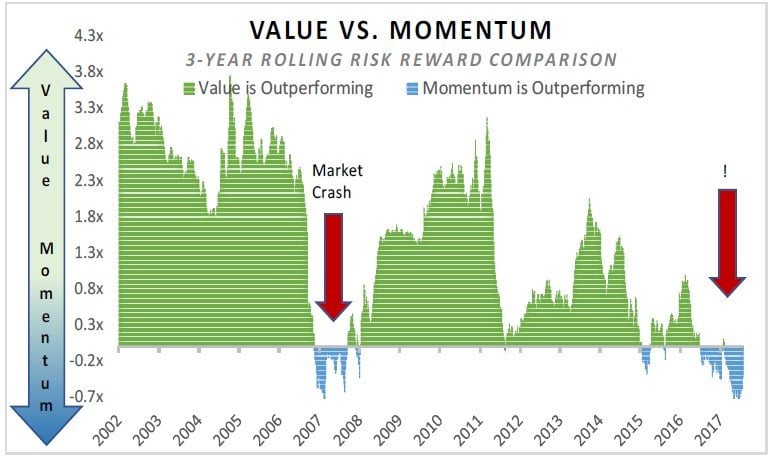
Value investing has had the longest period of underperformance in history when compared to buying whatever is “hot”. The chart to the right shows the performance of a pure value strategy versus momentum. Deep value significantly underperformed momentum just prior to recessions in 1999 and 2007. If you are old enough you may remember the December 1999 Barron’s cover article titled “What’s Wrong, Warren?”. The article asserted Buffet’s value strategy was old fashioned and he was “losing his magic touch”. Recently the WSJ has printed several similar articles discussing how active managers are underperforming and losing assets due to stubborn adherence to value principals.
As it turns out, the institutional investors herding into passive and factor investments may be smoking something out of their own Magritte Pipe. Passive is just a crowded “liquidity momentum” trade and its outperformance compared to active managers may be self-fulfilling and ultimately de-stabilizing in the long run. When passive investing becomes dominant ‘excess returns’ are actually diminished and volatility should rise. What they claim as being low cost, actually comes at great expense in the long-run. What they think of as diversification is actually dangerous herding. What they see as alpha is actually an illusion of value created by the reliance on the medium.
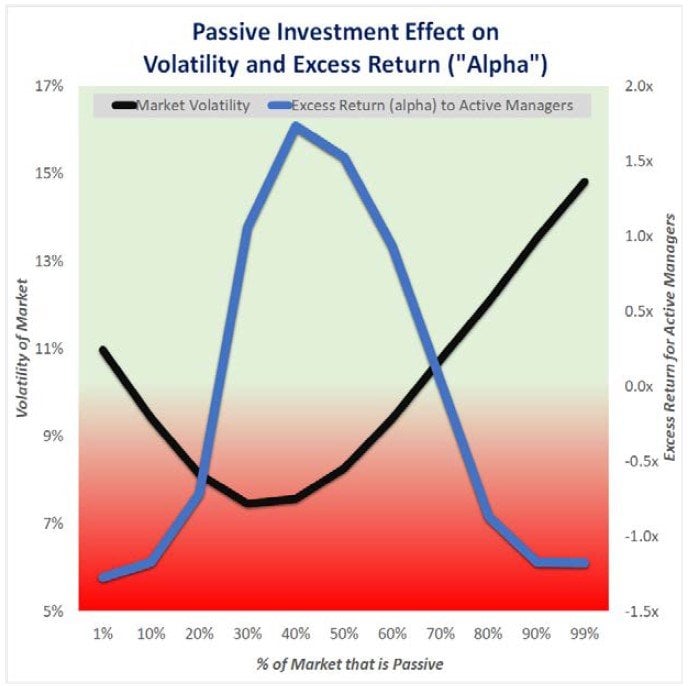
Michael Green at Thiel Macro first introduced me to his theory that passive investing crowds out the excess return (‘alpha’) available to active management. Mike also challenged me to prove it to myself by building my own theoretical model. I took his advice and built a market simulation whereby the main variable is the influence of passive vs. active participants. My simulation generates 25,000 days of equity returns using a supply-demand model randomized according to geometric Brownian motion with a drift factor based on constant percentage passive flows. Active participants become engaged based on varying degrees of intensity depending on whether the market drifts too high (selling pressure) or too low (buying pressure). The active players then impact the market by helping to push prices back into equilibrium. It is important to note that in this simulation the proportion of active to passive investors remains constant. In real life, this will shift over time. Two key themes emerge when the market is dominated by passive investing as seen to the right:
1) “Excess Return” or Alpha available to active managers is diminished (blue line in graphic)
2) Volatility is amplified. (black line in graphic)
Green’s theory that the alpha available to active managers is destroyed by the dominance of passive flows was not intuitive to me at first. I was inclined to believe the exact opposite: that the greater the degree of passive actors the more inefficiencies are available for exploitation. That is true to a certain point. When the market is dominated by passive players prices are driven by flows rather than fundamentals (see right tail of blue line). In my simulation, the excess alpha available to active participants peaks when passive investors comprise 42% of the market, then drops dramatically the more the passive share increases. When passive participants control 60%+ of the market the simulation becomes increasingly unstable, subject to wild trends, extreme volatility, and negative alpha. In the real world, because the ratio between active to passive is not constant, the instability threshold will occur at a much lower threshold as investors shift their preference to passive in real-time.
A good metaphor is to think of passive investors as a drunk man at the bar and active investors as his sober guide. The drunk man is hoping to walk home safely but is highly influenced by the prevailing flow of foot traffic. Fortunately, when the drunkard gets too far off the safe path, his sober guide takes over and corrects him. Now, the dual journey home is a choppy pull and push affair, but everyone gets home safe. Now in a world where passive dominates, the drunk become so strong that his sober guide is not strong enough to influence him. Unencumbered the drunk man can now move much faster in any given direction, right or wrong, but he is also more likely to get lost. The drunk man walks from the bar... starts heading toward his house…takes a wrong turn up a mountain… and right off a cliff... to his death.
The irony of the Bogle-head crowd is that they tout efficient market hypothesis to support passive investing while simultaneously failing to comprehend how the dominance of the strategy causes markets to become highly unstable and inefficient. The most immediate realities are the ones that are the hardest to see… If you want to know when volatility will truly arrive, watch the shift in the medium.
Volatility Reflexivity and Liquidity
“The post-modern volatility regime poses the question whether VIX ETNs and futures are large enough to influence the much deeper SPX options market. The existence of this dynamic would represent a self-reinforcing feedback loop with potentially dangerous repercussions.” - Artemis, “Volatility at Worlds End” March 2012
“The wrong ‘risk-off’ event may expose a hidden liquidity gap in the short VIX complex that could unleash a monster.” - Artemis, “Volatility and Allegory of Prisoners Dilemma” October 2015
“ The Global Short Volatility trade now represents an estimated $2+ trillion in financial engineering strategies that simultaneously exert influence over, and are influenced by, stock market volatility….Like a snake blind to the fact it is devouring its own body, the same factors that appear stabilizing can reverse into chaos.” - Artemis, “Volatility and the Alchemy of Risk, October 2017
Reflexivity in volatility has been a core focus of Artemis research for nearly a decade. The Artemis paper “Volatility at World’s End” published in 2012 contained the first of many warnings about the danger of VIX exchange traded products (see above). More importantly, before they imploded, short-VIX ETPs ($3 billion) were the smallest constituent of the $2 trillion Global Short Volatility trade. The impact they had on global markets and market liquidity is just the canary in the coal mine.
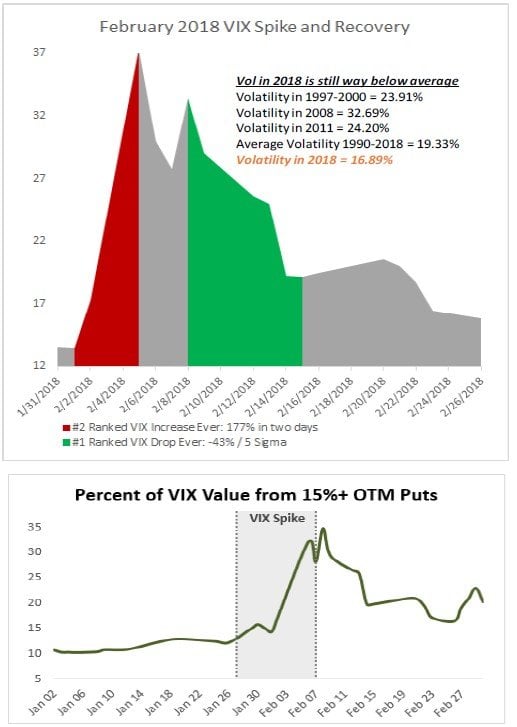
By now you know the story, a routine decline in equities caused a liquidity squeeze in retail-dominated short VIX products resulting in a self-reflexive spiral of buying pressure. At the end of the trading session, the VIX levered and short ETPs required more vega notional exposure than was available in the entire market, resulting in a feedback loop. The VIX registered the second largest draw up (+177%) and single largest drawdown (-43% over 5 days) in its 28-year history over a two-week span. During this wild round-trip to nowhere, the popular short VIX exchange traded products (“XIV”) were wiped out and many strategies that have consistently made money lost years of profits in an hour.
The volatility spike in February is widely misunderstood… it was not a “volatility event” but instead a “liquidity crisis” resulting in rapid re-pricing of tail risk. Put simply, it was the moment where many ignorant market players learned what ‘water’ really is. During a true volatility event implied variance and demand for options increases across the board. Fixed strike and at-the-money volatility actually moved more in January (+3.5%) than it did in February (+3%). The early-February spike in VIX was driven by unprecedented demand for far out-of-the-money S&P 500 index puts, or tail options. Normally these options comprise about 10% of the VIX price, but in early February these tail risk options comprised upward of 35% of the VIX price.
Traders were not buying options because they thought volatility would increase, they were buying options because they were facing insolvency. If you are a fish on dry land, how much will you pay for a glass of water?
Look, there has been so much talk about volatility and VIX exchange traded products lately… but that is yesterday’s news and is irrelevant. Everyone is missing the forest from the trees... the pond from the ripples… In April, the commissioner of a major regulatory agency visited Artemis to discuss my research on short-volatility from last year. He asked whether I thought the VIX eco-system represented a systemic risk. I told him, “Forget VIX, that’s over. Done. But you should be VERY worried about how the bigger implicit short volatility trade affects liquidity in the overall market... THAT is the systemic risk.”
The medium is liquidity… and it is vanishing.
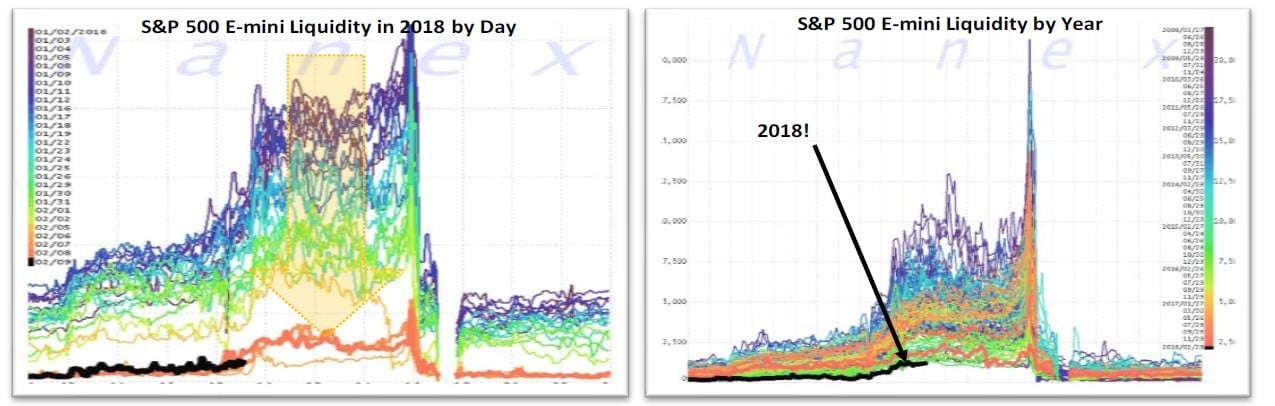
What makes February so scary is that the very medium of the markets… the water… the liquidity… vanished. Every fish was on dry land. Look at the charts below from NANEX showing tick-by-tick liquidity of S&P 500 index E-minis for visual evidence of the stark deterioration. The average number of S&P 500 e-mini contracts to be bought and sold at the best price collapsed 95% from late-2017 to February-March 2018. From our trading desk we observed that moving just 200 E-minis, representing just $26mm of S&P 500 index delta exposure, could have caused a $22 trillion market to move multiple handles, up or down. YIKES!
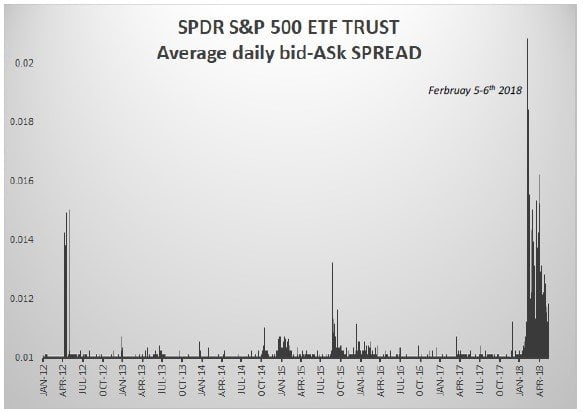
The liquidity crisis in February extended beyond derivatives. The SPDR S&P 500 ETF Trust (“SPY”) is one of the most liquid exchange traded funds in the world with a capitalization of over $260 billion. Normally this ETF trades very tightly with an average bid-ask spread of only 1 cent. On February 5-6th the average spread blew out to historical highs of over 2 cents wide, representing a 28 standard deviation move. SPX options had no bids or offers and option spreads that previously traded 5 cents the previous week went as much as $3.00+ wide. In a throwback to the 2008 financial crisis, the derivatives desks at major banks refused to provide quotes on liquidity over-the-counter derivatives like variance swaps. At a recent conference, one veteran hedge fund manager said that it was one of the worst liquidity environments he had seen in 26 years of trading.
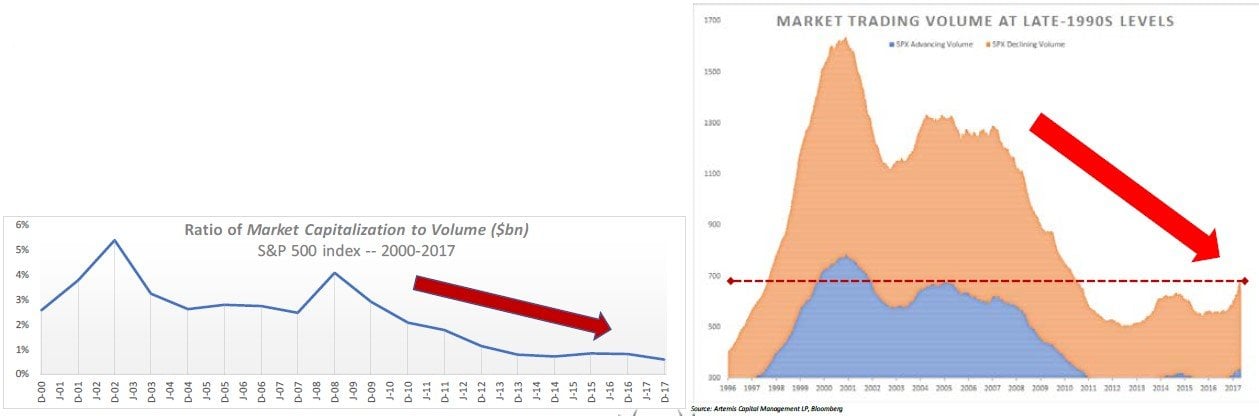
The bull-market in the S&P 500 index is now the second longest and second greatest percentage gain in history, but it is the ONLY bull-market in history that has occurred on lower and lower trading volume. Market trading volume and free float shares are now at levels last seen in the late-1990s (as evidenced by the chart to the right). In the U.S. stock market more than half of the 8,500 listed companies now trade less than 100,000 shares per day.
The volatility revolution will not be televised… the volatility revolution will be live.
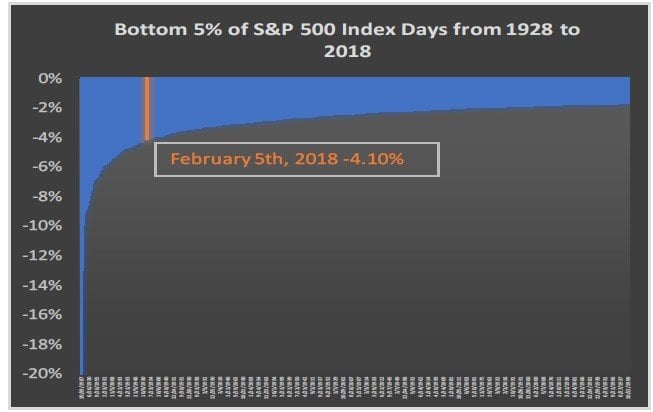
The liquidity in February was horrible, but what is even more alarming is the fact that it happened outside a true fundamentally driven market crash. Now a -4.10% loss is a bad day, but any student of market history knows things can get much much worse. For example, in October and December 2008, there were 15 days with declines greater than -4% including 2 days down more than -9%! In 2011 the market dropped nearly -7% in one day, and famously the market was down -9% and -21% on consecutive days in October 1987. The question we need to ask ourselves, what if a liquidity evaporation similar to February 2018 occurs during a period of actual systemic stress?
In the short term the liquidity fluctuations have made it very difficult for the entire volatility trading edifice. For the first time in history all actively managed volatility hedge fund strategies are down on the year. The CBOE Long Volatility Hedge Fund Index (-4.92%), Relative Value Volatility Index (-0.59%), Short Volatility Index (-8.87%), and Tail Risk Index (-4.03%) all lost money through the first half of 2018. This has never happened before.
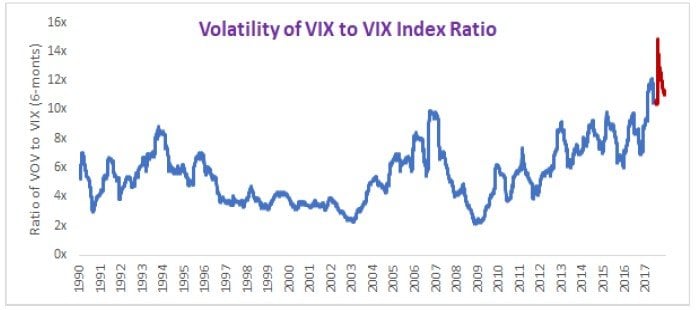
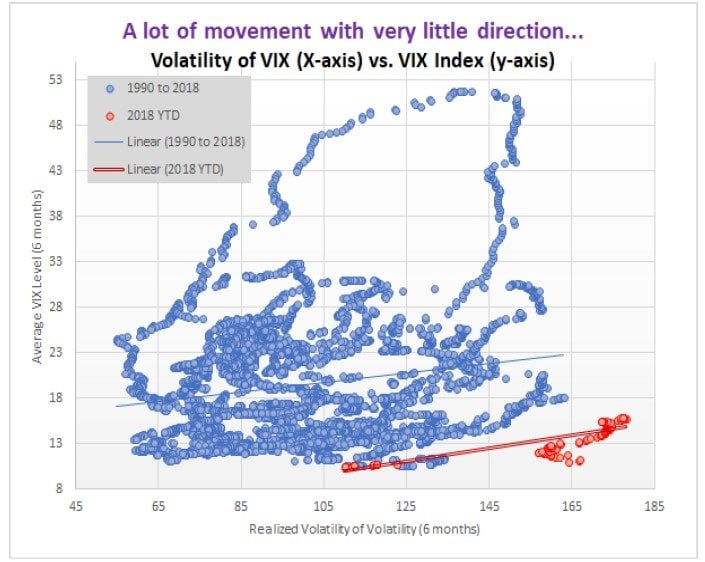
Volatility this year has been like the Incredible Hulk… a well-tempered scientist one minute, then without warning transforming into a giant rage monster the next, only to shrink back down to human size soon thereafter. Volatility moving violently up and down without a defined trend is really difficult for everyone. For evidence, notice that volatility-of-VIX as a ratio to spot-VIX reached all-time highs in 2018. If your mandate is to hold exposure to vol (long or short) you’ve been hurt either on the upswing or the reversal. Despite media attention, although the VIX has risen from all-time low levels in 2017, it is still trending well below historic averages in the mid-teens.
As repeated in our mid-February update, Artemis Vega does not monetize into volatility spikes. If we took a +15% gain in February when the market drew down -10%, we would not be able to achieve our objectives of portfolio changing 50-100%+ gains in the event a true crash emerged (SPX down -20% or more with an extended period of volatility).
Flows over fundamentals…
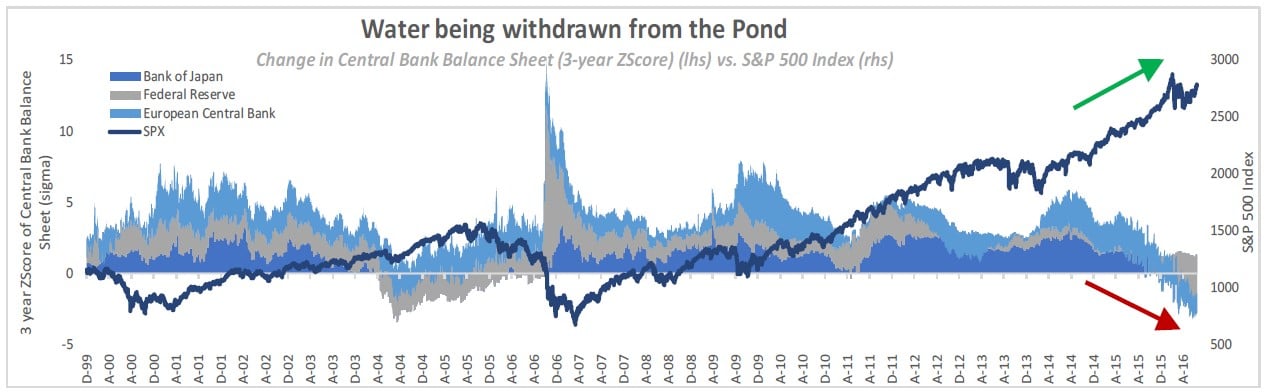
When you are a fish swimming in a pond with less and less water, you had best pay attention to the currents. The last decade we’ve seen central banks supply liquidity, providing an artificial bid underneath markets. Now water is being drained from the pond as the Fed, ECB, and Bank of Japan shrink their balance sheets and raise interest rates.
Despite this trend, U.S. equities will very likely escape 2018 without a crisis or volatility regime shift because of the one-time wave of corporate liquidity unleashed by tax reform. Expect a crisis to occur between 2019 and 2021 when a drought caused by dust storms of debt refinancing, quantitative tightening, and poor demographics causes liquidity to evaporate.
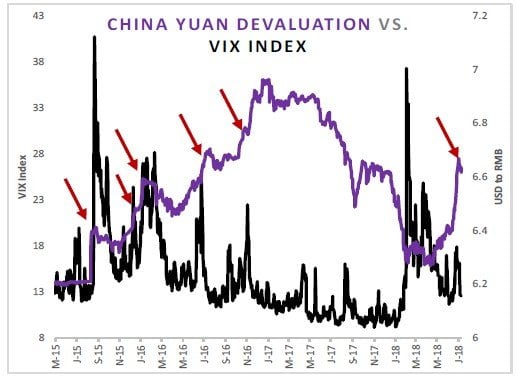
The first signs of stress from quantitative tightening are now emerging in credit, international equity, and currency markets. Financial and sovereign credits are weakening and global cross asset correlations are increasing. Meanwhile, China is executing a stealth devaluation of the Yuan which, since 2015, has been a reliable signal of turbulence in global markets. Artemis predictive models have been consistently bearish through June and July, and as a result we have tactically increased tail exposure in S&P 500 index options and VIX. A higher than average exposure to tail risk has contributed to negative performance the last few months as volatility has remained in the low-teens.
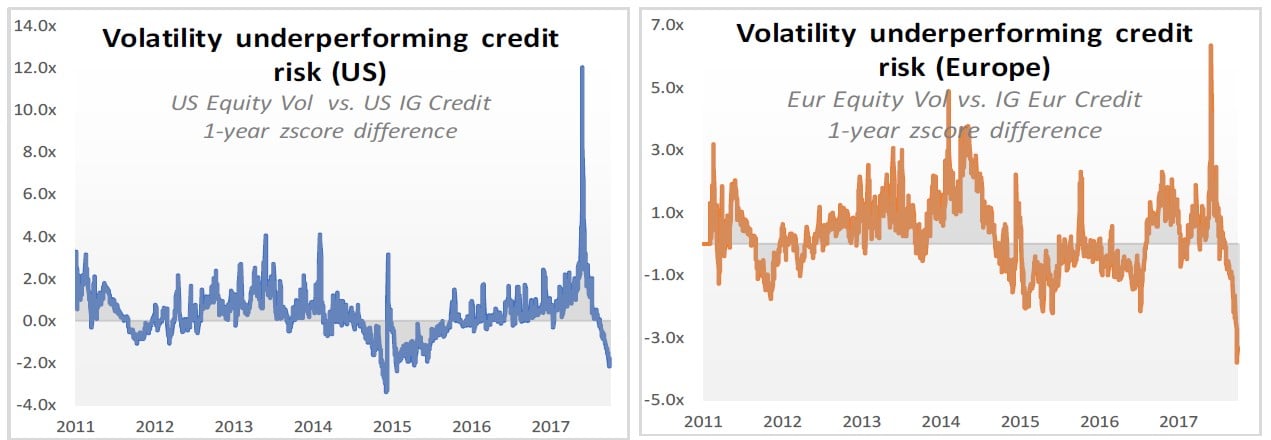
Equity volatility is underperforming credit risk trend by some of the widest margins in history in both the U.S. and in Europe (see below).
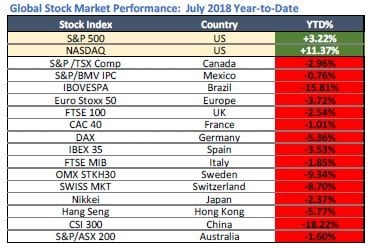
The year-to-date performance of global equity markets shows one outlier country in the sea of red (see chart). The US is now the only developed market in the world that has a positive year-to-date return (+3.22 % for S&P 500 and +11% for NASDAQ). U.S. equities have risen for nine years and the economy is entering its 10th year of expansion, the second longest bull-market in history, even as China as slipped back into a bear market. Despite all this, the S&P 500 index and NASDAQ have failed to make a new high since January and are now treading water. What is keeping the U.S. afloat while the rest of the world is struggling to find water?
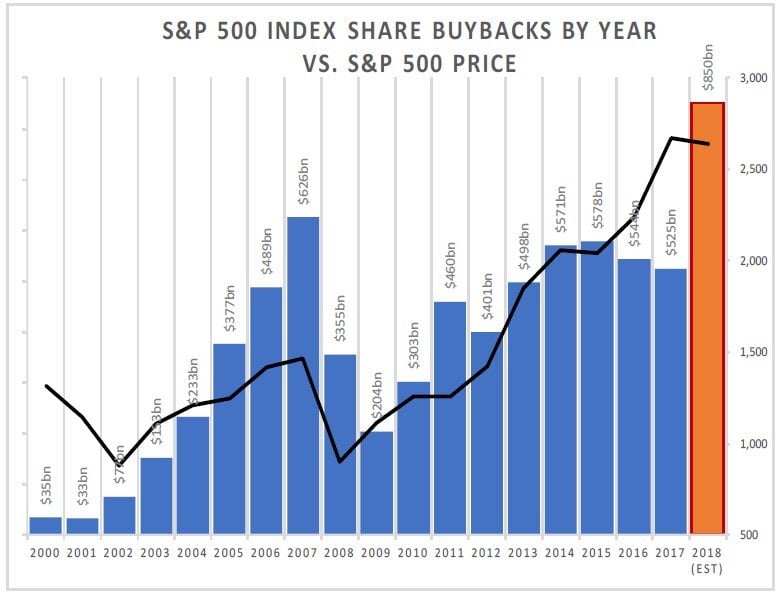
The earthquake of one-time Trump tax-reform has resulted in a multi-trillion-dollar tsunami in repatriated assets and corporate activity that will make any sizable correction in U.S. equities highly unlikely in 2018. U.S. companies are poised to spend an all-time record $2.5 trillion on share buybacks, dividends, and mergers and acquisitions in 2018. This amounts to 11% of the total capitalization of the overall market. In the first two months alone, U.S. companies spent almost $200 billion on share buybacks, more than all of 2009, effectively erasing the February swoon. As Artemis has discussed at length, buybacks serve as a price insensitive buyer underneath markets, dampening volatility and encouraging additional buying pressure from implicit short volatility strategies such as volatility control funds, risk parity, and low volatility factor investing.
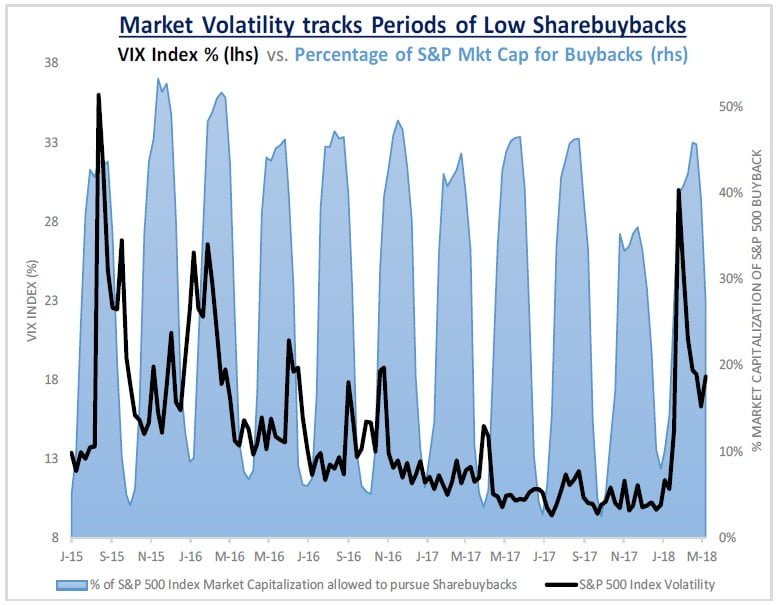
Naturally, the ebb and flow of volatility tracks the corporate buyback cycle as evidenced by the chart to the right. The historic volatility collapses occurring between August-September 2015, June 2016, and February 2018 all coincided with heavy resumption of buyback activity. It is well-known that in 2016 and early 2018 buybacks were the major flows causing the market to rebound from sharp losses. Despite systemic risks building in the market, it is very hard to see a meaningful decline in equities (-10% of more) with sustained volatility in 2018 so long as this wall of money in there.
Beyond buybacks, venture capital funds are spending cash at the highest levels since the dotcom era with $58 billion invested this year alone. Another dot-com era retro stat, 76% of the IPOs in 2017 were unprofitable, the highest level since 2000.
When does this all end? If or when the collective consciousness stops believing growth can be created by money and debt expansion the entire medium will fall apart, otherwise it is totally real… and will continue to be real.
A crisis-level drought in liquidity is coming between 2019 to 2022 marked by a perfect dust storm of unprecedented debt supply, quantitative tightening, and demographic outflows.
Quantitative easing has caused the natural relationship between corporate debt expansion and default rates to break down. U.S. debt is at an all-time high of $14 trillion (45% of GDP) and high yield default rates are near all-time lows at 3.3% (MarketWatch, 13d). This is not sustainable. Years of cheap money has led scores of investors to buy debt at levels that do not reflect credit risk. The poster child is the 2017 issuance of 100-year Argentina bonds (USD denominated) that were oversubscribed 3.6x with a 7.9% yield. It is hard to find a decade where Argentina has not defaulted, much less a century. That medium of bond market demand has already begun to show signs of cracking.
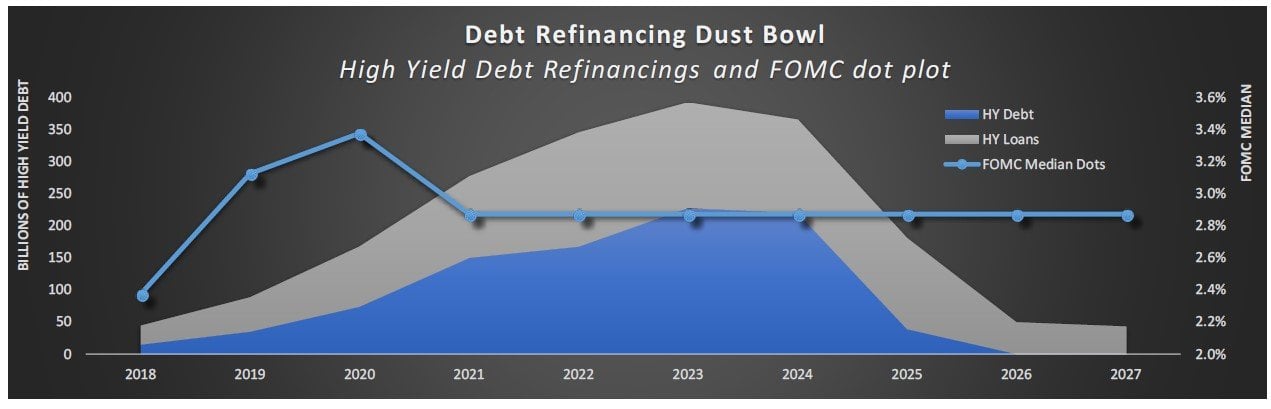
Starting in 2019-2021 a dustbowl of debt re-financings will hit markets when they are most vulnerable to a liquidity drought. Annual combined U.S. government and corporate debt supply is expected to exceed $2 trillion each year between 2019 and 2022 (Deutsche Bank). Leveraged corporations will need to roll $1.2 trillion of high yield debt starting in 2019 and peaking in 2023 (Bank of America). For the first time in modern history the U.S. government will require a massive supply of debt to finance fiscal deficits during a period of tighter monetary policy. The irony is we are simultaneously pursuing trade wars with the main foreign buyers of that debt (China and Japan).

As if all that is not enough, demographics will become amajor factor driving outflows from financial markets for first time in modern U.S. history further exacerbating the liquidity drought. The Baby Boom generation that formed after World War II (Mid-1940s to 1962) drove massive in-flows into financial markets when they starting working and saving in the 1980s. Following 30 years of financialization all that Baby Boomer money will now start flowing out of markets to support their golden years. As Boomers age, they will draw down on their retirement assets and spend less, and this includes redemptions of about $17 trillion in 401(k) and IRA accounts. The U.S. tax code requires 401(k) account holders to begin selling assets at 70 ½ years old, and the first wave of Baby Boomers began these forced redemptions starting last year. In 1980 there were 19 U.S. adults age 65 and older for every 100 citizens. By, 2017 the number of older adults increased to 25 for every 100, and this number is expected to climb to 35 for every 100 by 2030, and 42 by 2040. Deteriorating demographics is a global phenomenon and by 2030 Canada will have 40 retirees for every 100 people, Germany 44, Japan 58, and China 22. Social Security is now reaching into the trust fund for the first time since 1982. Demographics in the developed world will have a major negative impact on capital market flows right as passive investing, which relies entirely on flow, becomes dominant.
How is the water over there?
An entire generation of investors takes the medium of liquidity for granted, and the rest may be experiencing cognitive dissonance. It is odd but understandable, if you are paid a flat salary as a portfolio manager at a highly political investment institution, it doesn’t behoove you to know what water really is… you are incentivized to adopt the largest and cheapest institutionally accepted practices regardless of any greater reality. As social animals, we are punished for calling out any abstraction that is not confirming to status quo reality. Contrarians are punished economically and socially. A common refrain for any contrarian position is, “how can you be right if you’ve been wrong all along”. It’s a stupid argument if the regime shift happens, but the same reason why irrational exuberance can continue for extended periods.
For a fish it is very difficult to perceive a world beyond the water…if you want to change you have to crawl out of the ocean… find a way to breath …and evolve into a new reality.
“The immediate point of the fish story is that the most obvious, ubiquitous, important realities are often the ones that are the hardest to see and talk about.”
Volatility is the failure of the medium…the crumpling of a reality we thought we knew.
What is water in markets? Here are my best guesses…
Exchange traded markets are liquid and safer than over-the-counter derivatives
Technology is disrupting the world so the old rules of valuation no longer apply
Stocks and bonds are anti-correlated and provide excellent diversification
Stocks and real estate will always go up if you hold them for long enough
Passive investing offers higher returns at lower cost
Central banks can support markets indefinitely
Volatility accurately measures risk
Liquidity will always be there
Debt can be refinanced
Money creates value
Christopher R. Cole, CFA
Artemis Capital Management LP
Artemis Vega Fund LP


