Saga SMID Cap Portfolio commentary for the second quarter ended June 30, 2018.

Q2 hedge fund letters, conference, scoops etc
Updates
Thank you for everyone that was able to attend Saga Partners’ first annual luncheon in June. We also want to thank Umberto Fedeli for taking the time to speak. Since we moved our office into the Fedeli Group’s space earlier this year, he has been very gracious with his time and support as we have continued to grow. We plan on hosting our second annual luncheon next summer and hope to see you all there.
We raised the minimum investment for new investors in the Saga SMID Cap Portfolio to $75,000 starting this quarter. We may increase the minimum again in the future depending on how fast the fund continues to grow in both dollar size and number of investors. When the Portfolio first launched in 2017, we accepted initial investments for as little as $25,000 because we wanted to include as many close family and friends as investors that made sense for this investment strategy. A higher minimum investment makes sense given our size as well as from an administrative perspective.
2Q18 Results
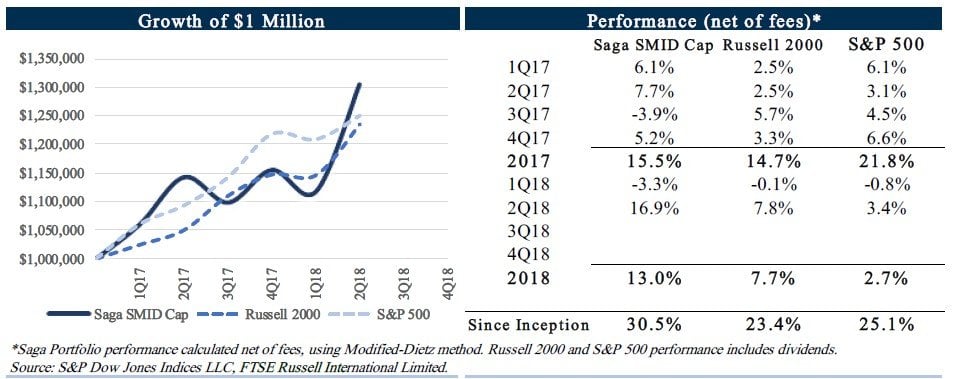
During the second quarter of 2018, the Saga SMID Cap Portfolio increased 16.9% net of fees. This compares to the overall increase, including dividends, for the Russell 2000 and S&P 500 Index of 7.7% and 2.7%, respectively. Since inception on January 1, 2017, the Saga SMID Cap Portfolio returned 30.5% net of fees, compared to the Russell 2000 Index and the S&P 500 of 23.4% and 25.1%, respectively.
Interpretation of results
Writing quarterly letters could instill a sense of shorter-term thinking, but we believe these letters are the best way for us to communicate our thoughts about investing and portfolio management. Providing regular updates and reiterating our investment philosophy will help investors better understand how we think and manage their capital.
It was a very strong quarter in absolute terms as well as relative to the indices. The purpose of the Saga SMID Cap Portfolio is to compound capital over the long-run at the highest risk adjusted rate, but it will not come in predictable, consistent returns every quarter or year. As you may recall from last quarter’s letter we stated, “it does not concern us one iota if we underperform in any given quarter, just like we will not get overly ecstatic in any quarter if we significantly outperform.” Quarterly, and even annual results, are almost as capricious as monthly or daily performance. In five years from now, few people will remember how the Portfolio performed in the month of June or the second quarter of this year. While it’s nice to lock in a strong quarter, we continue to ask investors to evaluate performance for periods in excess of five years, preferably including both up and down markets.
Over the short-term, stock prices fluctuate for various and often unimportant reasons. What is important is how much the company’s intrinsic value fluctuates. We do not care if a company’s stock price drops in half but its intrinsic value remains the same, except for the fact its price to value relationship becomes much more attractive. However we would care if the intrinsic value drops in half. Intrinsic value is simply the discounted value of cash that can be taken out of a business during its remaining life. It is the all-important number in investing, but it is an estimate rather than exact figure which means it takes both art and science in calculating it. Key to mitigating this fuzzy aspect of investing is only owning companies we understand with a durable competitive advantage, purchased at a price with a large margin of safety.
We take the approach that when buying stock, we are going to hold it forever. Similarly, if we were to buy a bond, we would expect to hold it until maturity. You know that if you bought a 10-year U.S. treasury today you would receive a 3% annual return. While this approach seems like common sense, it’s not a very common practice on Wall Street. Many purchase long-term bonds in the hopes of getting slightly higher yields but plan on selling before maturity when they need the money. What one might think is a 3% return on a $1,000 10-year U.S. treasury can quickly turn into a realized loss if rates increase to 4% and you have to sell a bond that is now only worth ~$900.
Unlike an owner of a private business who is not concerned about the day-to-day value of their company, the typical Wall Street analyst is judged by whether they can predict where a stock will trade within the next year. They make recommendations and price targets based on expectations of what they think other people’s expectations are likely to be in the near-term future. One might consider them renters of the company rather than owners of the company. They focus on price over value while we prefer focusing on the latter, thinking as owners by taking a much longer-term outlook.
This “forever” approach is a huge edge. It helps focus the investment process, forcing us to have a very high level of conviction before making any actionable decisions. It does not mean we never sell a company in the Portfolio. We sell a company if we find another opportunity with higher expected risk adjusted returns (opportunity cost), the price-to-value no longer provides attractive expected returns, or if we make a mistake in estimating its intrinsic value. While we are not completely immune to making mistakes, we believe our approach filters out many potential unforced errors and largely removes much of the emotional blunders investors commonly make when markets become irrational.
The End Game - Beating Mr. Market
The goal of the SMID Cap Portfolio is to beat the market over the long-run. Whenever one makes that assertion your first initial reaction should be skepticism, as ours would be. How can two guys managing a relatively small fund in Cleveland beat the large institutional money managers on Wall Street with infinite resources? The simple answer is, we are playing a different game than them.
Large mutual funds managing billions of dollars will typically own anywhere from 100 to 250 stocks in a portfolio. After netting out fees, it’s no surprise that over 90% of mutual funds underperform their benchmark. How is their 100th or even 250th best idea able to provide market beating returns? We follow a different strategy, preferring to add more capital to our best idea than our 21st best idea. If you had Lebron James on your team, would you take him out of the game to make room for a bench warmer? Too soon Cleveland?
The alternative to giving your money to large mutual funds is to passively invest in low cost ETFs. This passive strategy seems like an increasingly good option following nearly 10 years of seemingly uninterrupted strong market returns. Warren Buffett even states, “an investment in a low-cost S&P 500 index is the best choice for the most investors.” We agree that passive strategies do make the most sense for the most investors, but not all investors.
Evolution literally programmed humans to feel safest in the herd. For hundreds of thousands of years those who wandered outside the herd were less likely to pass on their contrarian genes when they encountered a hungry saber tooth tiger alone. If most investors are going to continually compare themselves to an index (herd) and underperforming the index for any period of time is going to cause distress, we agree they would be better off focusing on reducing fees rather than increasing outperformance.
So what does the competition look like? Using the S&P 500 index as a proxy for the market, it is currently trading at ~18x this year’s earnings, with net income margins at historic highs and long-term interest rates near historic lows. Refer to our 1Q17 letter where we discussed our thoughts on the general market level in more detail. While we are not ones to make macro-economic market calls and do not think the general U.S. equity market is in any kind of bubble territory, we think it is fair to say that future results will likely be lower than returns over the last 10 years. Even last year Jack Bogle, the founder of Vanguard and biggest index advocate, stated the S&P 500 returns over the next decade will likely only be 4% per year, including inflation. While this passive strategy might be the best option for the most people, we believe those with the right temperament and right approach have a much better alternative.
In order to get market beating returns over the long-term, you need to invest differently than the market. Investors in the SMID Cap Portfolio are comfortable thinking independently, avoiding the crowds, and taking advantage of unique opportunities. The Portfolio is built on the belief it is possible to carefully select a handful of companies that are more likely to provide higher returns than the market over the long-term. By continually digging through the forgotten nooks and crannies of the public markets, we occasionally find an opportunity that is largely undiscovered or misunderstood. We are not trying to reinvent the wheel, just following the same strategy that some of the world’s greatest investors did when they were managing smaller sums of money. We think this is a much better alternative for us and our investors than going with the herd.
Part of the Portfolio’s success will be determined on the ability for us and our investors to remain rational especially when the rest of the world is acting irrationally. If you look around at the different funds that have followed a similar investment strategy, the ones that have succeeded over the long-term emphasized the importance of having the right investor base. Typically those that failed to get market beating returns chose growth in assets by including investors that did not make sense for their strategy.
As we have grown, a number of prospective investors have approached us with an interest in investing. While several have been a perfect fit, investors that indicated a need for first loss protection, short-term stock market predictions, smooth returns, or constant liquidity do not make a lot of sense for the Portfolio. We take the “forever” approach to investing in stocks and ask our investors to take a similar approach to investing in the SMID Cap Portfolio. If one needs to spend money in the next year or two, it should not be in equities at all. It is a very risky game if you potentially have to sell assets at distressed prices. Anything can happen in the markets over the short-run and if you need money that is invested in stocks when panic sets in, it will cause a lot of unwelcome emotions.
We choose a quality investor base over growth which we believe will lead to the Portfolio’s greater success over the long-term. If you know of someone looking for an investment strategy like the SMID Cap Portfolio, feel free to forward on our information. We would love to meet and grow with people that share a similar philosophy and join our already great investor base.
Top five positions
The Trade Desk: See write-up at the end of the letter.
Platform Specialty Products (PAH): The company announced the sale of its Agricultural Solutions segment to UPL Corporation for $4.2 billion. This was largely inline with our expected value of the segment. Proforma EBITDA of the remaining Performance Solutions segment is $450M-$470M. Proceeds from the sale will go towards paying down debt resulting in a net debt of $1 billion. At a current market cap of $3.3 billion, shares are trading at 9x-10x proforma EV/EBITDA. Free cash flow is expected to be in the range of $275M-$300M, or only 11x-12x the current market value.
The market is looking through the rearview mirror instead of the windshield and over-discounting Platform’s mistakes of the past. The Performance Solutions segment is a high quality, high margin, capital-light company with a sticky customer base and potential to grow high single digits organically. Leverage is no longer a risk after the sale of the Ag Solutions segment. The current CEO has a strong track record running his prior company Sigma-Aldrich and was not at PAH during their acquisition spree. PAH learned from the past mistake in overpaying for the Arysta acquisition and has stated they are going to focus on operating their Performance Solutions operations and only making smaller bolt-on acquisitions going forward. We think PAH is a high-quality company and looks very attractive at its current market price.
Liberty Latin America Ltd. (LILAK): There’s no new information since our write up on the company in the 1Q18 letter except that its primary competitor in the Central America, Digicel, continues to struggle with an overleveraged balance sheet. In July, Moody’s downgraded its outlook on Digicel from stable to negative with its gross debt approaching 7x EBITDA. LILAK reports 2Q18 earnings on 8/9/18 which will provide an update on their operations and Puerto Rico recovery.
Under Armour (UA): The company reported 2Q results which reflect ongoing operational improvements. The investment thesis remains the same. Kevin Plank started the company in 1996 from his grandma’s basement and has grown the brand over the last 26 years. It has focused on growing with the sports apparel market and gaining share from Nike and Adidas, growing sales since going public in 20015 at over a 20% rate through the end of 2016. However starting in late 2016, North American sports apparel industry headwinds combined with an unsuitable operating cost structure hurt profitability.
Under Armour was a “Wall Street darling” up to 2015. Sales were expected to grow exponentially and any valuation multiple placed on shares could be rationalized. As one would expect from any high growth company, UA hit a few company specific growing pains, as well as general North American sports apparel industry headwinds. Sales growth slowed, outlook became less sanguine, and Wall Street did a quick about-face.

It’s an interesting phenomenon when groceries or clothes get cheaper people get excited and want to buy more, but when stocks get cheaper it makes people want to sell. Not even the highly paid Wall Street analysts are immune to this condition. At its peak of $53 in September 2015, when one would think UA shares might look expensive, 20 out of 34 analysts had a buy rating. At its low of $12, when the same exact company was 80% cheaper just two years later, only 6 out of 35 analysts had a buy rating. This interesting behavior occurs because when people buy groceries or clothes, they typically do not intend to sell them back. With stocks, there is always an ability to sell shares back, which causes panic when investors see big price declines. Contrary to what most of Wall Street seems to recommend, we try and follow the general rule of thumb in investing, buy low and sell high.
Yes, Under Armour’s fundamentals deteriorated in 2017, however the nearly 80% drop in share price more than adjusted for any decrease in expected earning power in our opinion. The company is now in the middle of a restructuring plan which includes lease and contract terminations and inventory/asset-related charges which are expected to total $190-$210 million during 2018. We think the company will continue to be one of the largest sports brands in the world and will resume growth and increased profitability once industry conditions improve and it completes the restructuring plan. Even if UA does not grow sales ever again but is able to reach historic operating margins, they are trading at a very attractive valuation. It is a high-quality company with a strong brand, going through temporary growing pains which provided an attractive buying opportunity.
Linamar Corporation (LIMAF): Linamar is a high-quality auto OEM with long-term customer relationships and a global manufacturing presence. A second-generation family member is CEO who has a strong track record and significant insider ownership. The company is benefitting from secular industry tailwinds from further outsourcing of propulsion systems, growing market share, and is pursuing strategic acquisition opportunities. While it operates in a cyclical industry, we expect the company to potentially grow at double digit rates throughout the full auto-cycle and provide high returns on its invested capital.
Shares of companies touching the auto sector have been hurt by fears of peak auto sales and uncertainty surrounding tariffs. While these risks are very real and can potentially impact fundamentals, Linamar continues to fire on all cylinders, growing sales in 2017 by 9% and operating income providing 24% returning on tangible invested capital. Following their MacDon acquisition in February, consensus estimates expect Linamar to grow 2018 sales and operating income 16% and 22% respectively.
Investing in a cyclical company at the potential peak of the cycle can be risky. If auto unit sales fall materially it will negatively impact Linamar’s current fundamentals and potentially share price. That said, we do not think we are any good at making macro forecasts on auto production. While unit sales will likely not grow at the rapid rate of the recent decade, we’d expect Linamar to grow throughout the next full cycle, even if there is a down year or two like 2008 and 2009.
The valuation looks extremely attractive at 6x expected 2018 earnings and an EV/EBIT of 6x. Even if imposed tariffs cause auto demand to fall and unit volumes tumble, we expect Linamar to continue to grow throughout a full cycle. We do not care if over the next four years, a company earns a lumpy $100, $0, $0, $100 or consistent $50, $50, $50, $50, as long as the valuation provides an attractive return on today’s selling price.
Looking Forward
We have no idea what stocks will do in the next month or even year. What we do know is if we have the right temperament and the right approach, continually try to search for a few compelling opportunities and find one every once in a while, we have a high probability of providing market beating returns over the long-term. If you know someone that may align with this investment philosophy, feel free to forward this letter on or direct them to sagapartners.com/smid-cap-strategy.
Thank you again for trusting us with your hard-earned capital. We hope you found this update helpful in understanding your portfolio. If you have any questions or comments please reach out, we are always happy to hear from you!
Sincerely,
Saga Partners
Joe Frankenfield, CFA
Michael Nowacki
Tech investing and The Trade Desk (TTD) - Avg. purchase price $50
Many “value investors” have generally avoided investing in technology companies, following Warren Buffett’s aversion towards the sector. Buffett refuses to invest in anything he can’t understand, meaning not knowing what a company’s competitive dynamics will be in 10+ years.
Technology is simply the application of knowledge which is an essential part of increasing productivity in any business. What technology really means is change. In investing, change means increased uncertainty and therefore greater risk. All businesses will innovate and change to a certain degree. New technology can be devastating to the competitive dynamics of a specific company if it gets left behind. If you look at the ten largest U.S. companies by market cap each decade you can see how changing technology will even impact what were once considered the strongest companies in the world. What caused a company’s success or failure? Is their success durable? Oftentimes a general shift or change in the competitive atmosphere creates an opportunity for a Microsoft to rise or an IBM to fall. Change is hard to predict and therefore when a company is subject to a lot of change, whether it’s a “tech company” or not, estimating its future earning power is made all the more difficult.
Making up over a quarter of the S&P 500’s market capitalization, the tech sector is a large part of the total economy and incorporates a wide variety of companies. In the 1960s it only included semiconductor, computing hardware, and communication equipment companies. Later software and any coding companies were added, soon followed by internet companies and then their subcategories of ecommerce, social media, the sharing economy, and cloud-based computing enterprises.
While many typical tech companies are subject to a greater degree of uncertainty because of rapidly changing products and services, it has not stopped us from looking and trying to find an opportunity we can potentially wrap our heads around. Late last year after combing through what seems like thousands of ideas we came across a very interesting company we never heard of before called The Trade Desk. It has a software as a service (SaaS) business model that provides a platform for helping ad buyers value and purchase digital advertisements.
SaaS companies have several favorable qualities. They are very scalable with high operating leverage and fairly predictable, recurring revenue. Most costs to develop the product are associated with writing the software and essentially nominal costs to produce each additional subscription/service. This high fixed cost operating structure can be very profitable, providing strong operating margins and returns on invested capital if end demand is large enough to spread the fixed costs across enough subscriptions. At least that is the argument many investors make for earlier-stage, money-losing software companies. Most of the costs are up front, showing losses in the early years of development, with subsequent profits once the product reaches the market for mass production.
This all works very well in theory, however projections are often optimistic. It’s difficult to differentiate software which can easily be copied by a smart computer scientist with a laptop working from their garage. The key with any SaaS company is determining if it has a moat. Why can’t a smart competitor with unlimited capital copy their product and compete away profits? When The Trade Desk came across our desk, we quickly realized it was something very interesting and potentially one of the best opportunities we discovered since launching the Portfolio.
History of Ad Tech
Following the rise and fall of companies such as Rocket Fuel and Rubicon, Wall Street and Silicon Valley have generally disliked the digital advertising space. However, the digital advertising industry is fairly complex with many different players with different qualities and when a whole industry gets thrown out with the bathwater, it potentially leads to some misvalued opportunities. We are sure few readers have ever really cared to know the complex and esoteric inner workings of the digital ad world, but some background will prove helpful in understanding The Trade Desk.
In the early days of the internet, advertisers bought media/advertisements through agencies. Publishers such as forbes.com, msn.com, or some blog owned impressions/ad space called inventory where marketers wanted to advertise to potential users of their product or service. Inventory was sold to marketers manually, at a set rate per a thousand impressions which depended on the type and quality of the inventory. As the internet grew, there were eventually billions of impressions to sell with varying types of inventory quality. Transparency became an issue with advertisers not knowing where their ads were being placed and publishers not knowing who was buying their inventory. Ad exchanges emerged to help trade inventory in an auction-based model where advertisers could bid on varying qualities of inventory and more specific audiences. This led to advertisers use trading desks or demand-side platforms to carry out the bidding directly with ad exchanges and publishers doing the same thing with supply-side platforms to sell inventory.
Overview of Ad Tech Players
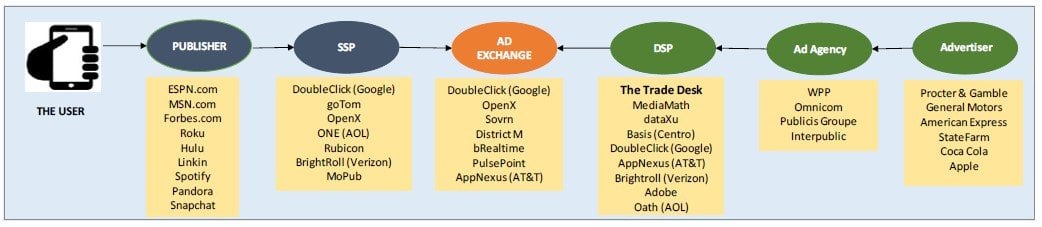
- Users: The end consumer/customer that navigates/browses the internet and other digital media.
- Publishers: Sellers of inventory. They own the media/web pages and generate the content or inventory that reaches users.
- Supply Side Platform (SSP): Allow publishers to access demand from ad exchanges to sell their inventory.
- Ad Exchange: A marketplace that enables advertisers and publishers to buy and sell ad space.
- Demand Side Platform (DSP): Allow advertising clients to buy digital media from an ad e exchange, through a single interface.
- Advertisers: Buyers of inventory (often through ad agencies) who want to reach the user by placing ads on the publisher’s inventory.
Founding of The Trade Desk
Jeff Green, the founder and CEO of The Trade Desk, helped pioneer the ad tech industry. He was a digital media buyer at an ad agency in the early 2000’s where he discovered his passion for digital advertising. He believed advertising could be done more effectively than the traditional “spray and pray” model by using data. In 2003 he started AdECN, the world’s first online ad exchange where media publishers could sell their inventory directly to ad agencies, functioning like a stock market for ads. Microsoft acquired AdECN in 2007 where Green lead the group until deciding to leave in 2009 to start the The Trade Desk.
His goal was to create a platform where advertisers could value media inventory through data-driven decisions. With the ability to buy and sell advertising inventory electronically or programmatically, advertisers could use data to make better decisions on what, when, and whom to show an ad impression. Historically most advertising inventory was sold in bundles or blocks based on a set price with limited targeting, customization, or attribution. For example, with broadcast TV, ads could only target a specific network, program, or geography, but not a single household or individual. If every ad impression is worth something different to every advertiser, they should be transacted and valued separately. With the rise of the internet and now programmatic advertising, ads can be digitally delivered on a 1-to-1 basis.
Competition: Where others have failed, The Trade Desk prospers
As expected, a lot of capital was invested and numerous companies were started to take advantage of the emerging ad tech opportunity. Many companies in this space have failed for different reasons. Some platforms served as both a demand side and a supply side platform which created a conflict of interest between buying inventory for advertisers and selling inventory for publishers. There was little transparency and companies would charge a spread, or take rate, that was unsustainably high. Other platforms used decision tree/line item queries when analyzing inventory for customers. The process utilizing line item permutations become exponentially complex for marketers when adding each additional variable to target users. Not only was the process highly manual and unmanageable for marketers, it took an unscalable amount of memory (RAM), increasing operating costs to pay for the data storage.
The Chief Technology Officer and co-founder Dave Pickles saw the inefficiency of using decision tree line items and created a system called bid factoring. Bid factoring is essentially a linear equation that enables marketers to apply multipliers to different targeting parameters. This approach makes it easier to value each user individually and dynamically, allowing marketers to more easily reach their target users, save time through automation, and removes the need to store tons of line item permutations therefore lowering data storage costs.
When Green started The Trade Desk his goal was to “build a company for the next 100 years.” He did not want to follow the same mistakes that other companies in the space made. The Trade Desk would be transparent, not charge unsustainable take rates, and only be a demand side platform to avoid any conflicts of interests with customers. He believed the demand side of the advertising transaction will always have the advantage. In advertising, it will always be a buyer’s market because it is easy to add supply by having an extra impression on a web page or additional 30 second spot to a commercial break to meet increased demand. This basic economic reality means supply is more elastic than demand and will forever put the buy side in the power position.
Are there barriers to entry?
It’s rare to find a fairly young company in a high growth industry with barriers to entry. The Trade Desk has developed a business that is scalable, takes nominal capital to grow, and very difficult for any new competitors to enter the field.
Economies of scale. There is high operating leverage in the DSP cost structure meaning scale is important. Every time someone lands on a web page or connected device, millions of auctions occur in 1/10 of a second in order to sell the ad space. When a DSP runs an ad campaign for a customer, they plug into an ad exchange where SSPs make their inventory available. The DSP “looks” at the inventory, analyzes the impressions, and places bids on the auction. Every time a DSP looks at an auction it costs them money and every time an SSP sends an impression to a DSP it costs them money. Both parties only get paid if the auction is monetized. As the ad market has grown, the number of auctions have increased exponentially. In order for a DSP to win an auction, it now takes many more looks. For each ad campaign, costs have increased while revenues remained fairly flat, increasing operating leverage. DSPs that have half the ad spend as The Trade Desk will struggle because they will incur the same amount of expense per an ad campaign but monetize less making it much more difficult to be profitable if you are a smaller player and don’t have the scale.
SSPs also do not send every impression to every possible bidder/DSP because every new bidder will cost them more money. They want to send impressions to DSPs that will likely win the auction so they can control expenses. If a DSP is getting fewer looks sent to them, they have less inventory to choose from, which lowers the potential quality of inventory they can provide to the advertiser.
Additionally, agencies/advertisers do not want to log into dozens of different platforms to buy digital advertising, preferring one platform with the all available inventory to run campaigns. These simple operating characteristics create a huge disadvantage for smaller DSPs and makes it nearly impossible for a new player to become competitive against the larger, more established companies like The Trade Desk.
Customer stickiness/switching costs. There are several similarities between Wall Street and the inner workings of the ad tech trading world. In Wall Street there are stock exchanges, brokers, money managers, and research analysts. We think the Wall Street equivalent for The Trade Desk is Bloomberg, the difference being analysts pay a terminal subscription fee for Bloomberg and The Trade Desk earns revenue by taking a spread on the ad inventory purchased. The similarity is The Trade Desk provides a platform, or terminal, for the agencies/advertisers to analyze data and value inventory/securities.
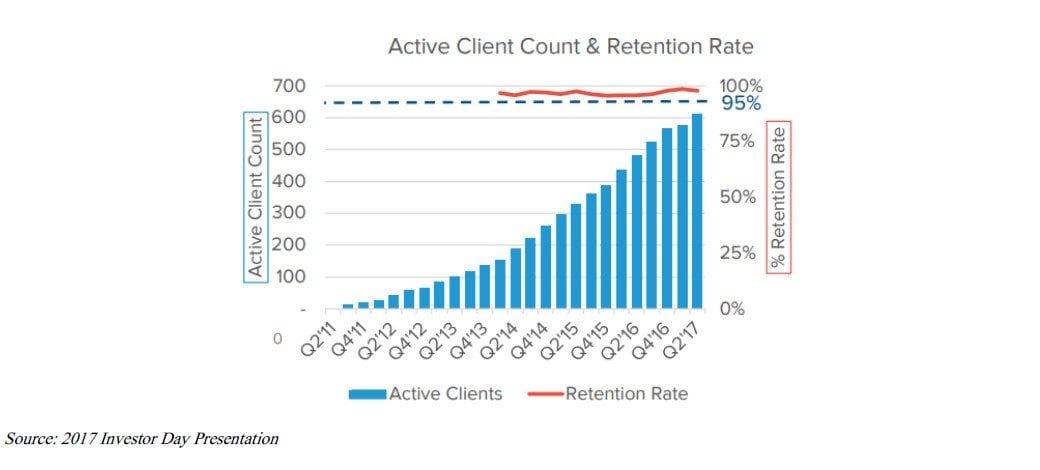
To get an idea of customer stickiness, The Trade Desk has consistently maintained over a 95% client retention rate. It is pretty clear from client reviews online that The Trade Desk provides a valuable and highly rated service to their customers.
Everyday The Trade Desk’s customers log into their platform to use the data and analysis to value ad inventory and run marketing campaigns. Advertisers provide their customer data and publishers provide their user data which The Trade Desk uses to help advertisers value media for their specific needs. As The Trade Desk accumulates more data over time, their insight and analysis add more value to their customers, creating a self-reinforcing virtuous cycle.
Objectivity as an independent DSP. Largely reflecting the significant economies of scale described above, DSP consolidation is expected to continue. The number of DSPs continues to decline with only a handful of them being independent.
Previously independent DSPs such as AppNexus, BrightRoll, or DoubleClick have been acquired by larger media companies. There is an inherent conflict of interest when an advertiser uses Google’s DSP DoubleClick or Verizon’s Brightroll. For example, Google’s primary business model is monetizing their media buy selling ad inventory on google.com and youtube to marketers. They are biased towards selling their inventory over competitor’s inventory, not to mention any company that directly competes with a Google, AT&T, or Verizon will likely be reluctant to share their customer data.
We expect the buy side to consolidate over time, resulting in only a token few major players and at least one of them being an objective independent DSP. As the largest independent DSP today, we think The Trade Desk is favorably positioned to benefit from these industry trends.
What about Google and Facebook? – Walled Gardens
The Trade Desk does not directly compete with Google or Facebook. While Google does have its own version of a DSP, their core businesses is generating revenue from selling ads by monetizing their media inventory. Google and Facebook essentially dominate the digital ad space with estimated U.S. digital ad market share of nearly 60% between the two of them. Because they have access to so many users and their data, they believe it is to their advantage to operate in what is called a “walled garden”. A walled garden is a closed off ecosystem, where outside platforms cannot access their inventory or data. If you want to advertise on Facebook or YouTube, you must buy inventory through Facebook and they do not provide data to help value their inventory.
Walled Gardens don’t enable ad buyers to value siloed inventory on a relative basis to other inventory because they don’t give enough data for them to actually know what they are buying and selling. The Trade Desk takes more of a free market view to walled gardens. They believe that reducing buyer’s access to inventory will decrease demand and therefore lower the potential selling price of the inventory within a walled garden. Google and Facebook are able to maintain their walled gardens because they are big enough today that advertisers have relatively few alternative options to reach their target markets. However, as the rest of the internet becomes more accessible and aggregated through platforms like The Trade Desk, advertisers will have increasingly better opportunities to access users.
One of The Trade Desk’s five-year goals is to have a larger user footprint than any other single company’s login footprint. For reference, Facebook currently has 2.2 billion monthly active users, or over half of the 4 billion people in the world with internet access. While billions of users do not log into thetradedesk.com, The Trade Desk has access to advertisers’ client data and publisher’s client data which aggregates to create a user footprint that will likely surpass any other single company. Green predicts that by enabling real price discovery on the rest of the internet, walled gardens will eventually feel enough economic pressure to come down and all advertising will get accessed and purchased on a relative basis instead of in walled off silos.
Is data privacy an issue?
The internet generally works by publishers providing interesting content to consumers for free in exchange for their data. Consumer data is then used to target advertisements that fund the “free” content. Rightfully so, consumers have become increasingly concerned about how their data is collected and used. The recent Facebook data scandal was related to an outside party that found a way to take directly identifiable data out of Facebook’s platform and use it in a way Facebook never intended. Unlike social networks, The Trade Desk does need personally identifiable information such as emails, phone numbers, credit card numbers, or social security numbers, to target advertising effectively. This data is not allowed on their platform so a similar scandal cannot occur, so they not have the same data regulatory risks as a Facebook, Google, or Equifax.
Valuation
While shares have increased since our average purchase price of $50, we still think The Trade Desk offers a very attractive investment over the long-term.
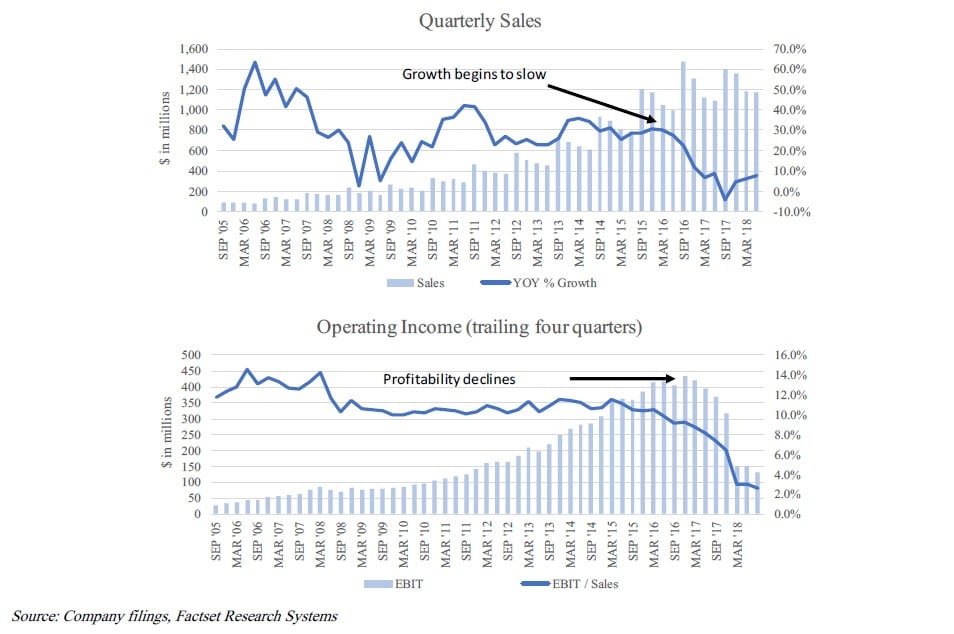
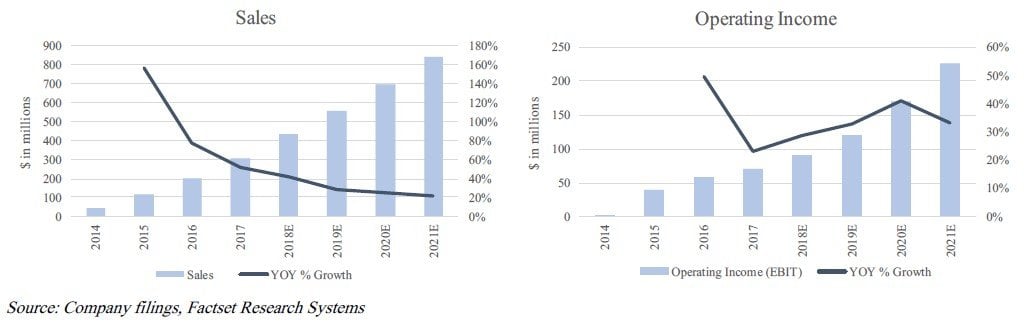
Unlike almost every other young, high growth software company that went public in recent years, The Trade Desk actually makes money. The company officially launched their platform in 2011 and has been profitable since 2012. The charts below show historic results since 2014 and consensus estimates through 2021. While we only consider consensus estimates with a grain of salt, it helps frame Wall Street’s expectations. In 2017, sales and operating income grew 52% and 23% respectively and are expected to grow 42% and 29% in 2018. Sales growth is expected to slow to about a 20% rate which is inline with expectations for programmatic advertising growth in upcoming years. If programmatic advertising continues to grow at a 20% rate, and the DSP space consolidates with The Trade Desk gaining market share, they should be able to grow at a faster pace than the general programmatic industry.
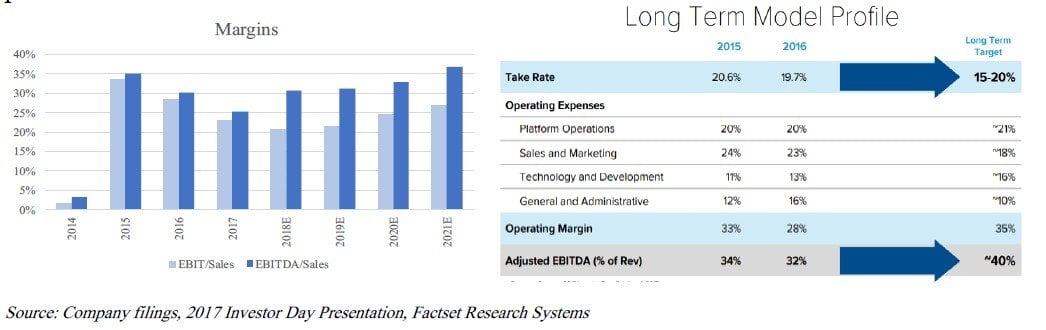
One of the company’s 5-year goals is to reach EBITDA margins of 40% as it continues to benefit from scale. Take rates are expected to remain within historical ranges of 15%-20%, while sales and marketing expense and general/administrative costs should decrease as a percent of sales.
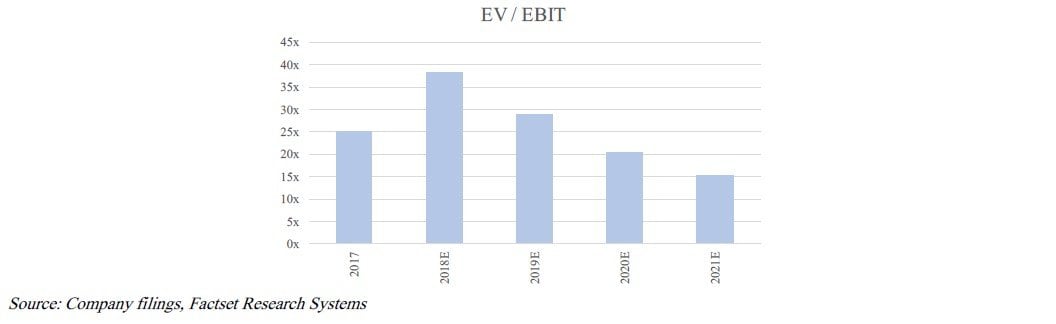
Based on current consensus estimates, which assumes sales and operating income grow at 25% and 35% rates respectively, The Trade Desk is selling for 38x 2018 EV/EBIT and 15x 2021 EV/EBIT. Operating income could be considered understated because none of the technology & development expense is capitalized.
When valuing a high growth company with barriers to entry like The Trade Desk, current and near-term fundamentals are poor proxies for future earnings power and valuation metrics. This is contrary to how most “value investors” think, however we think The Trade Desk’s qualitative characteristics make it look very attractive.
What will the advertising industry look like in 10 years? According to International Data Corporation (IDC), global ad spend was estimated to be ~$677 billion in 2017 and is expected to grow mid-single digits, reaching $1 trillion over the next ten years. Global digital ad spend was $229 billion in 2017 and is expected to compound at a 12% rate to reach $360 billion by 2021 or comprise nearly half of total global ad spend. While programmatic advertising currently makes up a relatively small part of the total advertising pie, it is not unreasonable to expect all digital advertising to ultimately be delivered programmatically.
One overly optimistic scenario would be global ad spend reaches $1 trillion in 10 years. Three quarters of global ad spend is digital and purchased programmatically. If there are four to seven DSPs that evenly split the market share of $750 billion programmatic ad spend, $110B-$190B will go through one DSP platform. If the take rate is 15%-20%, revenues would be $16-$38 billion, with EBITDA margins of 35%-40% providing $6-$15 billion in EBITDA. Putting a reasonable multiple on the potential $6-$15 billion in EBITDA would indicate a lot of upside to Trade Desk’s current $3.5 billion market cap over a 10-year period.
Several variables would have to work out in The Trade Desk’s favor for the above scenario to actually occur and there is a lot of uncertainty looking out 10 years in a high growth space. What we do know is The Trade Desk is the largest independent demand side platform, providing a valued and highly rated service to its clients. It has a large addressable market, takes nominal capital to grow, and has signs of increasing barriers to entry.


