In addition to reporting fraudulent profits, TAL has been misleading investors about the health of its core Peiyou business. TAL’s core Peiyou business appears to be in decline. We believe that Peiyou offline Q3 revenue YoY growth was likely negative, despite TAL CFO Rong Luo stating the growth rate was “healthy” and implying it was in line with small class revenue growth of 52.4%. We also suspect that Peiyou online is not doing well. Peiyou online Q4 sequential growth seems to have been at best high single digit, and quite possibly negative.

Q2 hedge fund letters, conference, scoops etc
TAL needs to stop playing games with its disclosures and clearly tell investors what respective Peiyou online and offline enrollments and ASPs were FY2017-FY2019 by quarter. We have shown that TAL’s profits are fraudulent. This report and the previous one answer part of the question “why?” – because TAL cannot grow its core business in a healthy manner. The lack of health is probably due to a combination of being too large to generate meaningful returns and / or disruption by more established China online education players.
TAL needs to disclose for FY2017 – FY2019 by quarter, respective Peiyou offline and online enrollments and ASPs. We dare it to.
Background
TAL’s disclosures are opaque, which fits the pattern of a fabricator. It is significantly harder to defraud investors when providing consistent, granular data. TAL has reports its different businesses as one segment in its SEC filings, which eliminates requirements to provide more granular detail in its formal disclosures.1 In its earnings calls, TAL primarily discusses three metrics: Enrollments, average selling prices (ASP) and revenue. For a given business unit and the company as a whole, enrollment times ASP equals revenue. The company is split into small class, one-on-one, online (Xueersi.com), and “other” units. Peiyou constitutes the vast majority of small class revenues and three-quarters of total revenues; and, Peiyou online (Speiyou.com), which effectively started contributing in Q3 2018, is also part of the small class segment. TAL seems careful not to disclose enrollment or ASP numbers at the unit level, but we believe that with some effort, one can extrapolate them. We believe TAL has revealed enough information
that we can see its FY2018 Q3 and Q4 statements about Peiyou do not mesh with management’s portrayal of a healthily growing business.
Our analyses are based on our historical model, which, in some cases, is based on extrapolations from TAL’s disclosures. It is unclear whether TAL will produce missing granular information in response, particularly given that it has seemed uninterested in defending itself.
Model
We modeled Peiyou’s respective offline and online enrollments and ASPs through FY2018 Q4. These do not reconcile with TAL’s disclosures and management statements, depending on which of them you accept as accurate.
To construct this model, we went back to FY2015 and built forward. In a given quarter, the company discloses total revenue and enrollments, and it usually gives revenue contribution data as well as the percentage of enrollments contributed by the online segment (Xueersi.com). From these, you can derive equations for segment revenues, total enrollment, and online enrollments.
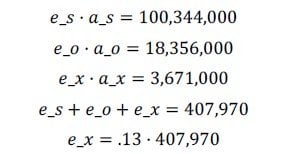
For FY2015 Q2, for example, small-class revenues were about $100.344 million, so we can say that small-class enrollments, e_s, times small-class ASPs, a_s, equals 100,344,000.2 Likewise, one-on-one enrollments, e_o, times one-on-one ASPs, a_o, equals dollar revenue of approximately 18,356,000.3 Online enrollments, e_x (the x being for Xueersi.com) times online ASPs, a_x, equals dollar revenue of about 3,671,000.4 Total FY2015 Q2 enrollments were 407,970, so e_s, e_o, and e_x sum to 407,970.5 Finally, for the quarter, online enrollments constituted 13% of the enrollment total, so e_x is .13 times 407,970.6 Putting these all together yields:
However, we need as many equations as we have variables. Our fieldwork showed that one-on-one FY2018 ASPs were about 3x small-class ASPs, a ratio that we extrapolate back to FY2015.7 This data point allows us to solve the system of equations:
![]()
After solving the system of equations, we get that for FY2015 Q2, small-class enrollments are 334,535 with an ASP of $299.95; one-on-one enrollments are 20,399 with an ASP of $899.85; and online course enrollments are 53,036 with an ASP of $71.28. One can repeat this for the rest of FY2015 in order to get ASPs and enrollments for the remainder of the year. Assuming TAL’s disclosures are correct, we believe we have an accurate view of how enrollment and ASPs have changed over time.
In the following section, we present our model results. We look at TAL’s assertions from several different angles: in each case, we lay out what we take to be true regarding growth rates and other management assertions. Then, we show our model output, check it against stated results or management commentary, and note the difference.
A note on model construction: We conducted sensitivity analysis with respect to the ratio of one-on-one ASPs to small-class ASPs. Modulating the ratio of one-on-one ASPs to small-class ASPs between 2 and 4 does not produce significant fluctuations in small-class figures or results. Our starting small-class enrollments and ASPs—the absolute values—did not change by more than 4.8% in any quarter, as one-on-one is quite a small segment. Across this ratio range, outputs either remained directionally the same or got much worse. We also constructed the same system of equations for 2016, rather than 2015, to see if seeding the model with those other values yielded different results. Again, there was no material impact to our outputs or conclusions, since 2016 small-class figures changed by less than a percent from 2015’s system of equations as brought forward a year using TAL’s stated ASP, revenue, and enrollment growth rates.
FY2018 Q3: Peiyou Disclosures Do Not Reconcile
We tried to reconcile FY2018 Q3 disclosures about Peiyou four ways. Because our model has ASP, enrollment, and revenue data, we held different elements constant—i.e., trusting different slices of management’s statements—to see if we could recreate what TAL reported.
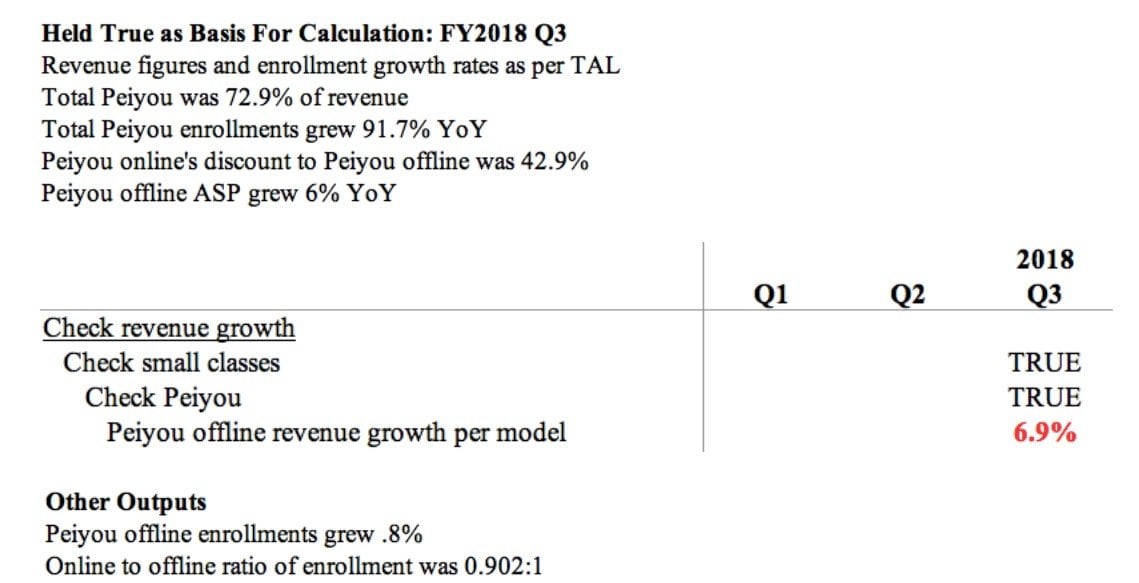
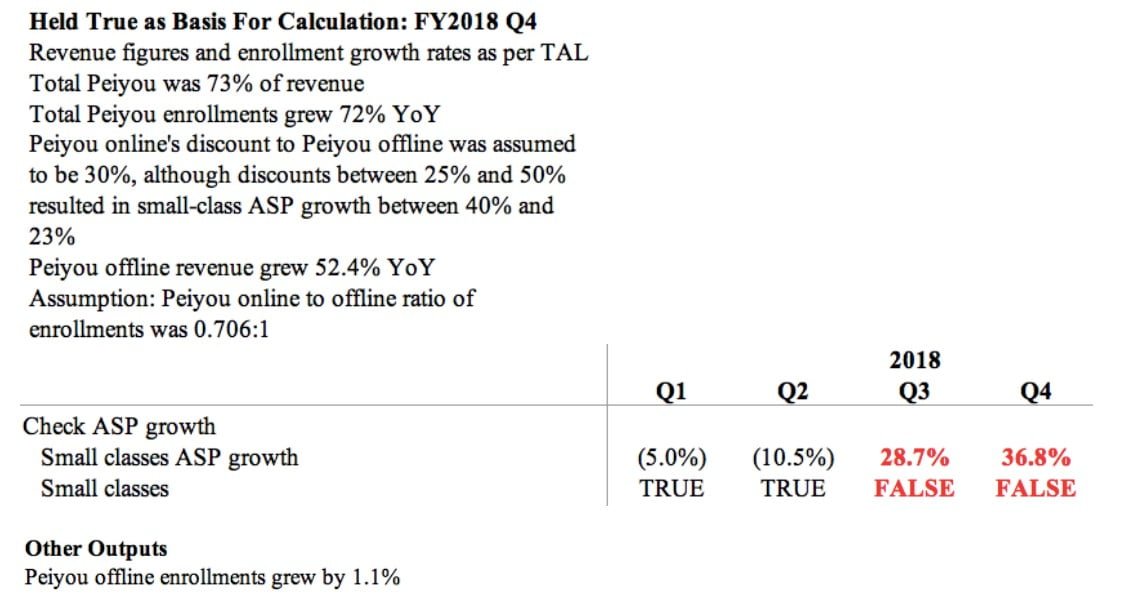
Method 1: Assuming FY2016 to FY2018 revenue figures and enrollment growth rates for TAL’s three business units are accurate, as is FY2018 Q3 Peiyou offline ASP growth
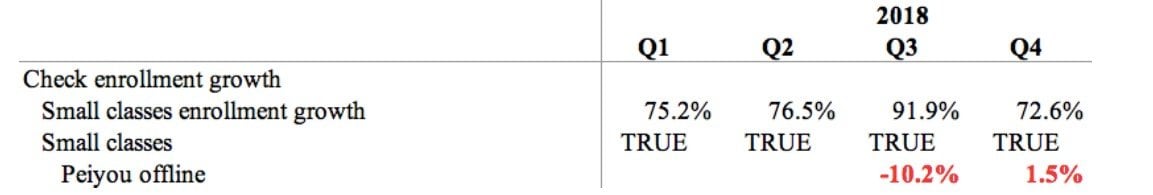
If we assume that historical small-class, one-on-one, and Xueersi.com revenues are as stated and that their associated enrollment increases are credible, then Peiyou offline revenue growth should have been negative. This would seemingly contradict Rong Luo’s statement on the FY2018 Q3 call that “Offline is also very stable. I think their net revenue from the Peiyou small class segment, that was up by 52.4% this quarter.”8 Peiyou offline revenue growth looks negative regardless how one interprets “high single digit” Peiyou offline YoY ASP growth, ranging from 6.5% to 9.5%. This results from the fact that stated enrollment numbers, coupled with the “high single digit” ASP increase and Peiyou online’s 40% discount to Peiyou offline, would imply a massive shift to online in Q3, resulting in online enrollments nearly equaling or even exceeding offline enrollments. Here, we show the result of 7.5% ASP growth.
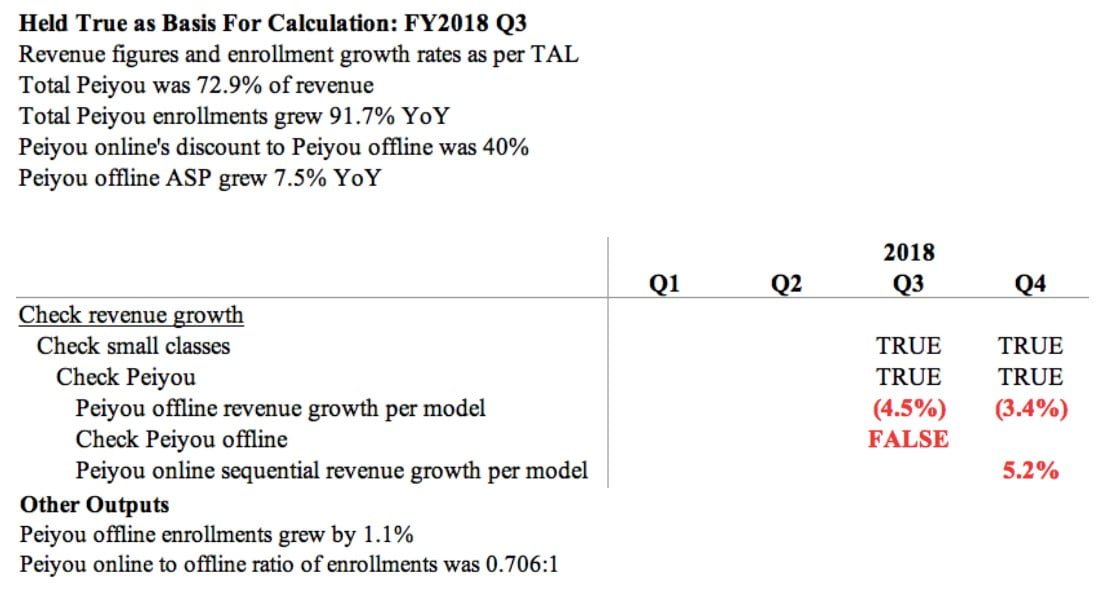
An offline revenue decline of 4.5% is quite different from even the “healthy” or “stable” Peiyou core business which management described, let alone the 52.4% CFO Rong Luo implied.
Method 2: Assuming FY2016 to FY2018 revenue figures and enrollment growth rates for TAL’s three business units are accurate, as is the implied 52.4% FY2018 Q3 Peiyou offline revenue growth
We next asked: Could TAL’s Peiyou offline revenue growth have hit 52.4% in Q3? If not, then Rong Luo’s answer in which he cited the purported small class growth rate is greatly misleading. To run this test, we solve for total small class ASP growth to see whether it matches management’s claim of 15.3% total small class ASP decline.
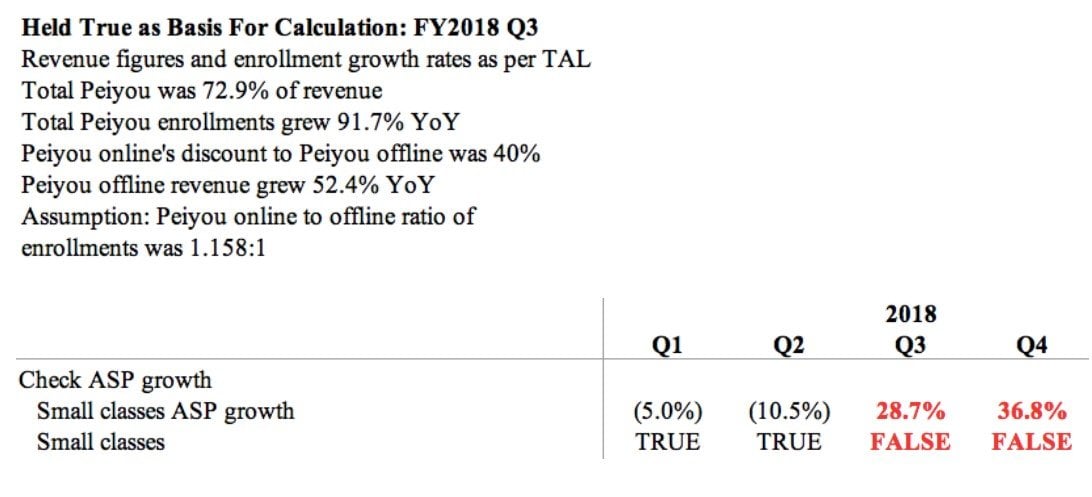
Total small-class ASPs would need to have increased significantly more than disclosed, rising 28.7% YoY in FY2018 Q3 to meet TAL’s Peiyou offline revenue growth claim. This does not reconcile with TAL’s claim of a 15.3% total small-class ASP decline for the quarter.
Method 3: Assuming FY2016 to FY2018 revenue figures and ASP growth rates for TAL’s 3 business units are accurate, as is FY2018 Q3 Peiyou offline “high single digit” ASP growth
If we take TAL’s statements about historical revenue and ASP growth for small class, one-on-one, and Xueersi.com to be true and compute enrollment based on those, then we get negative revenue growth for Peiyou offline in FY2018 Q3 once again for all “high single digit” Peiyou offline ASP growth values. This too contradicts Rong Luo’s statement about Peiyou offline revenue growth being positive. Consistent with the conclusion we detailed in our last report, Peiyou offline enrollment growth comes out negative, as well.
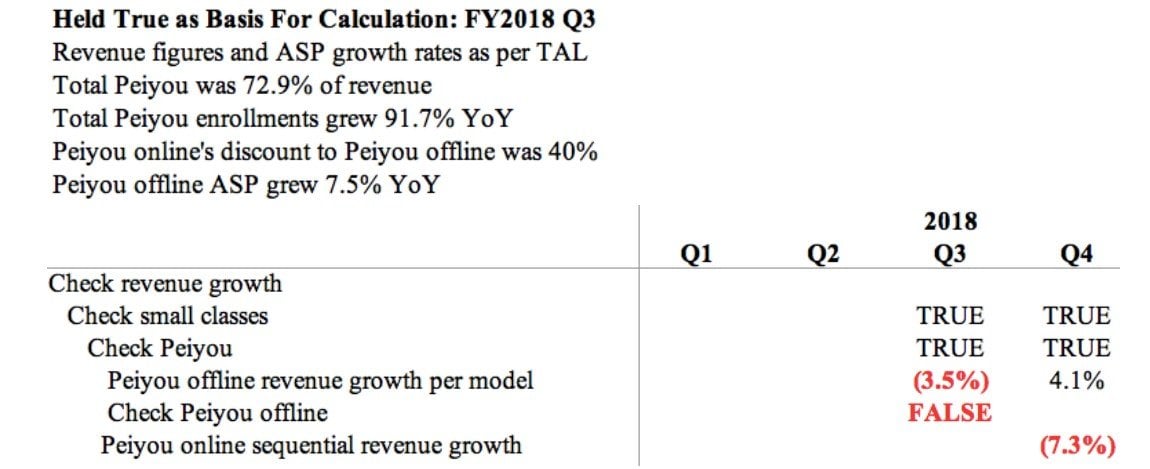
A FY2018 Q3 offline revenue decline of -3.5% once again contravenes the implication of “healthy” growth.
Under all high single digit ASP growth conditions, FY2018 Q3 Peiyou offline enrollment also shrank.
Method 4: Trying to square the circle
In attempting to reconcile TAL’s FY2018 Q3 statements as best as possible, we stretched the values of two data points to come up with a workable variant that approximately matches TAL’s representations while producing a modicum of Peiyou offline revenue and enrollment growth. This required pushing the online ASP discount to 42.9%, closer to approximately 45% than the “approximately 40% (4-0)” that TAL disclosed. Additionally, Peiyou offline FY2018 Q3 ASP growth had to dip to 6.0%, slightly below what we think most would consider to be “high” single digits.
Even this best-case scenario, which takes liberties to give TAL the benefits of most doubts, it still implies only single digit revenue growth in Peiyou offline.
FY2018 Q4: Decreased Disclosure
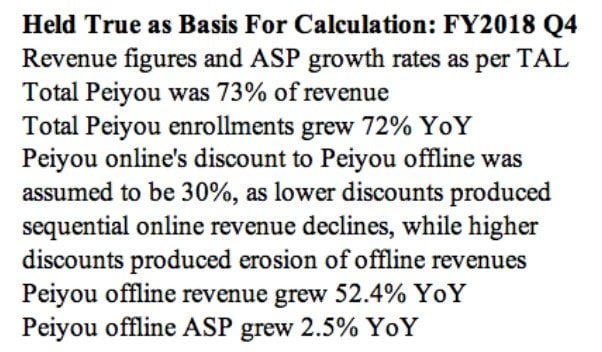
As noted in the previous report, we believe that in response to the common size Peiyou model we sent to TAL investor relations (prior to the Q4 call), TAL ceased disclosing Peiyou online’s ASP discount. Keeping the discount information hidden prevents us from analyzing the split between Peiyou online and offline to determine the exact root of the misstatement. However, assuming different discounts, from 50% to the improbable 0%, gives us a range to work with in order to try to reconcile TAL’s disclosures. We believe that under any reasonable set of conditions, the representations made by management do not make sense.
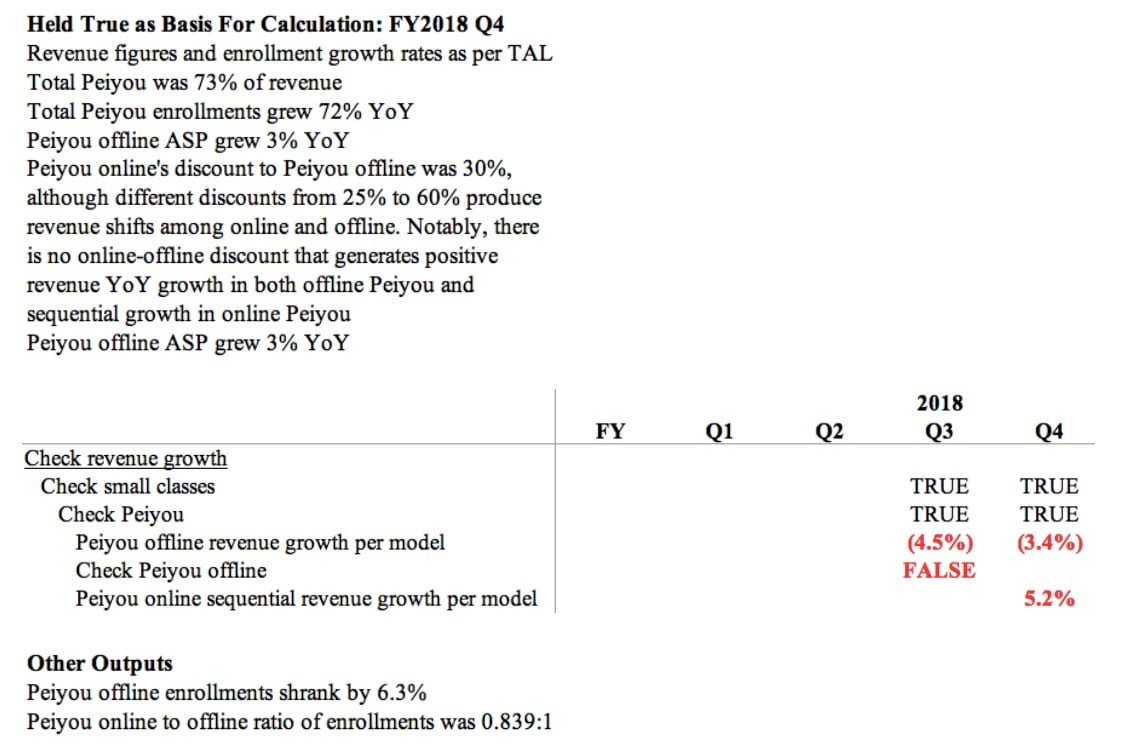
Method 1: Assuming FY2016 to FY2018 revenue figures and enrollment growth rates for TAL’s three business units are accurate, as is FY2018 Q4 Peiyou offline ASP growth
In the FY2018 Q4 call, TAL’s Head of IR stated that Peiyou offline ASP grew by low single digits.9 If we assume this means 3% ASP growth and apply Method 1 to Q4 results, we get that Peiyou offline revenue declined by 3.4% YoY, while Peiyou online revenue only rose by 5.2% sequentially quarter-over-quarter. In fact, across all low single digit offline ASP growth rates and reasonable offline-online discount assumptions, either YoY Peiyou offline revenue declined or Peiyou online revenue even fell sequentially. YoY declines in Peiyou offline contradict the company’s statements about the stable state of the business unit. A Peiyou online revenue decline from Q3 to Q4 also seems unexpected, unless the discount was much steeper than the 40% offered in Q3. (In the calculation below, we model the discount at 30%, which we found to produce the most logical Peiyou online and offline trends.10 Applying a 40% discount tended to produce highly uneven enrollment splits between Peiyou online and offline.)
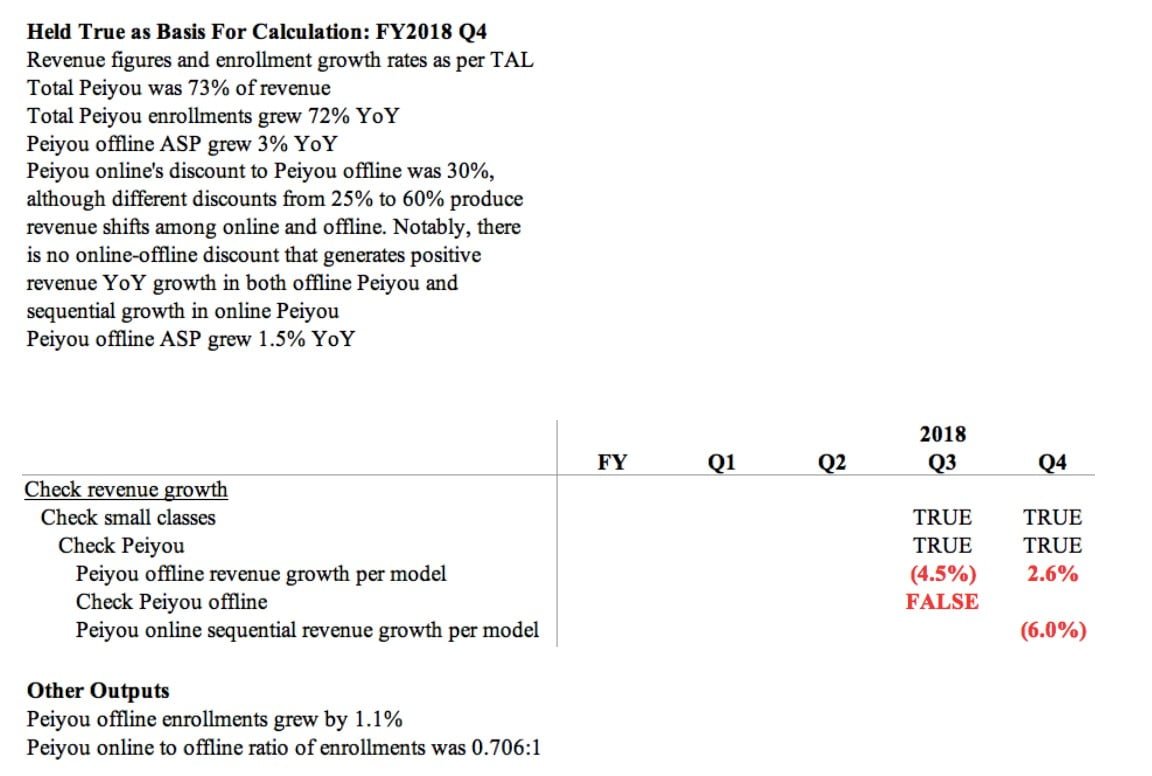
Peiyou offline revenue shrank 3.4%. YoY, while online revenue grew 5.2% sequentially quarter on quarter. In our model, there is no combination of low single digit Peiyou offline ASP or Peiyou offline-online discount assumptions that yields positive YoY Peiyou offline growth and positive sequential Peiyou online growth simultaneously. If we assume a different interpretation of single digit Peiyou offline ASP growth, 1.5%, the picture reverses:
Under a scenario of 1.5% offline ASP growth, Peiyou offline revenue grew 2.6% YoY, while online revenue declined by 6.0% sequentially quarter-on-quarter.
Method 2: Assuming FY2016 to FY2018 revenue figures and enrollment growth rates for TAL’s three business units are accurate, as is FY2018 Q4 Peiyou offline ASP growth
On the other hand, if we assume strong growth in Peiyou offline revenues—for example, an FY2018 Q4 continuation of the 52.4% offline growth insinuated in FY2018 Q3—, this would result in enormous Q4 small-class ASP growth as compared to TAL’s stated decline of 9.9%.11
This scenario of strong Peiyou offline growth results in 36.8% small-class ASP growth, whereas TAL disclosed that small-class ASPs declined by 9.9%.12
Method 3: Assuming FY2016 to FY2018 revenue figures and ASP growth rates for TAL’s three business units are accurate, as is FY2018 Q4 Peiyou offline ASP growth
Applying Method 3 from above, FY2015 Q4 growth in Peiyou offline continued to be flat to negative, depending on one’s exact choices within the “low single digit” Peiyou offline ASP growth range provided by management.13
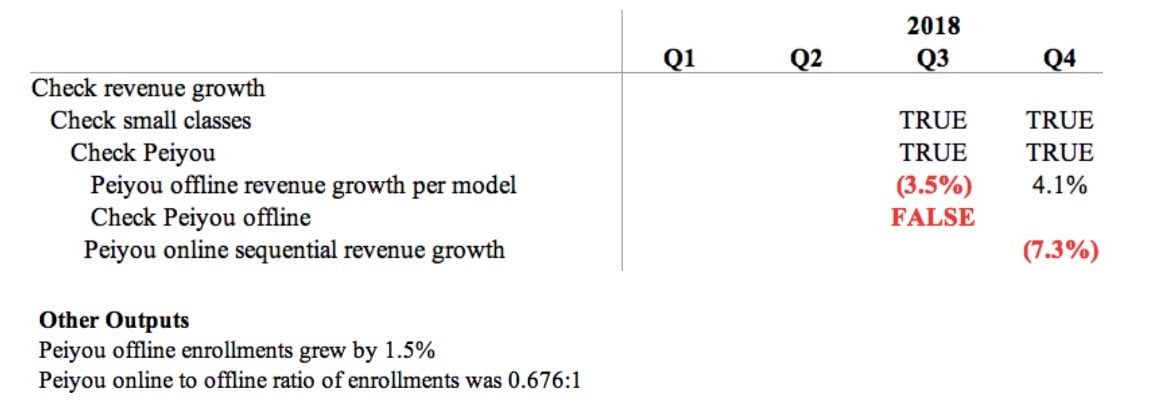
No matter which offline ASP growth values or reasonable Peiyou online-offline discount selections we made, one of three things happened: either Peiyou offline revenue declined year-over-year, Peiyou online revenue declined sequentially quarter-on-quarter, or all were flat. None of these outcomes suggest Peiyou is displaying the continuous healthy growth that management implies.
Conclusion
We believe that FY2018’s declining disclosures are intended to mislead investors and analysts from meaningfully understanding the company. Whereas before we could verify, now we just have to trust. TAL’s incongruous utterances have shown they are not a company that merits investor faith.
Article by Muddy Waters


