
The NBA finals are upon us, a repeat of the 2017 finals in which the Warriors dominated the overwhelmed Cavaliers. This year may prove a similar outcome. Out of curiosity, given that there are at most only 4 more wins for either team, which teams would you bet got their money’s worth this season? Here’s a look at NBA team salaries, team wins, the correlation between salaries and wins, and the cost per win. Before reading, which teams would you bet had wise general mangers (GMs) in 2017-18? Which teams’ GMs would you guess were the chumps? An inspection follows.
Salaries by Team
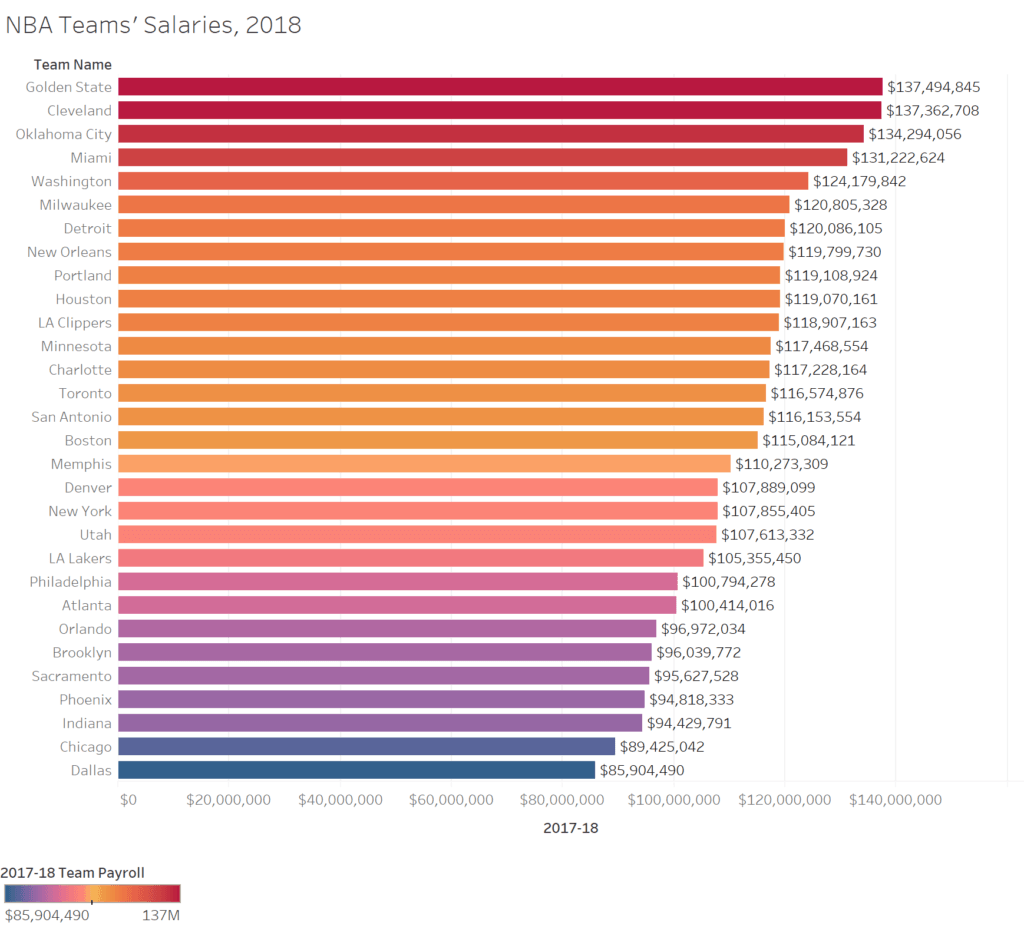
First up, a look at salaries by team. Intriguingly, the two teams with the highest payrolls – the Golden State Warriors and the Cleveland Cavaliers – had this season’s highest payrolls at about $137 million each. This was a fair bit more than the losers in this year’s conference finals – the Boston Celtics had a team payroll ranked 16th at $115 million and the Houston Rockets had a payroll ranked 10th at $119 million.
On the other end of the payroll spectrum, the Dallas Mavericks had the NBA’s lowest payroll at just $86 million. Other poorly compensated teams included the Chicago Bulls ($89 million), the Indiana Pacers ($94 million), the Phoenix Suns ($95 million), and the Sacramento Kings ($96 million).
Wins by Team
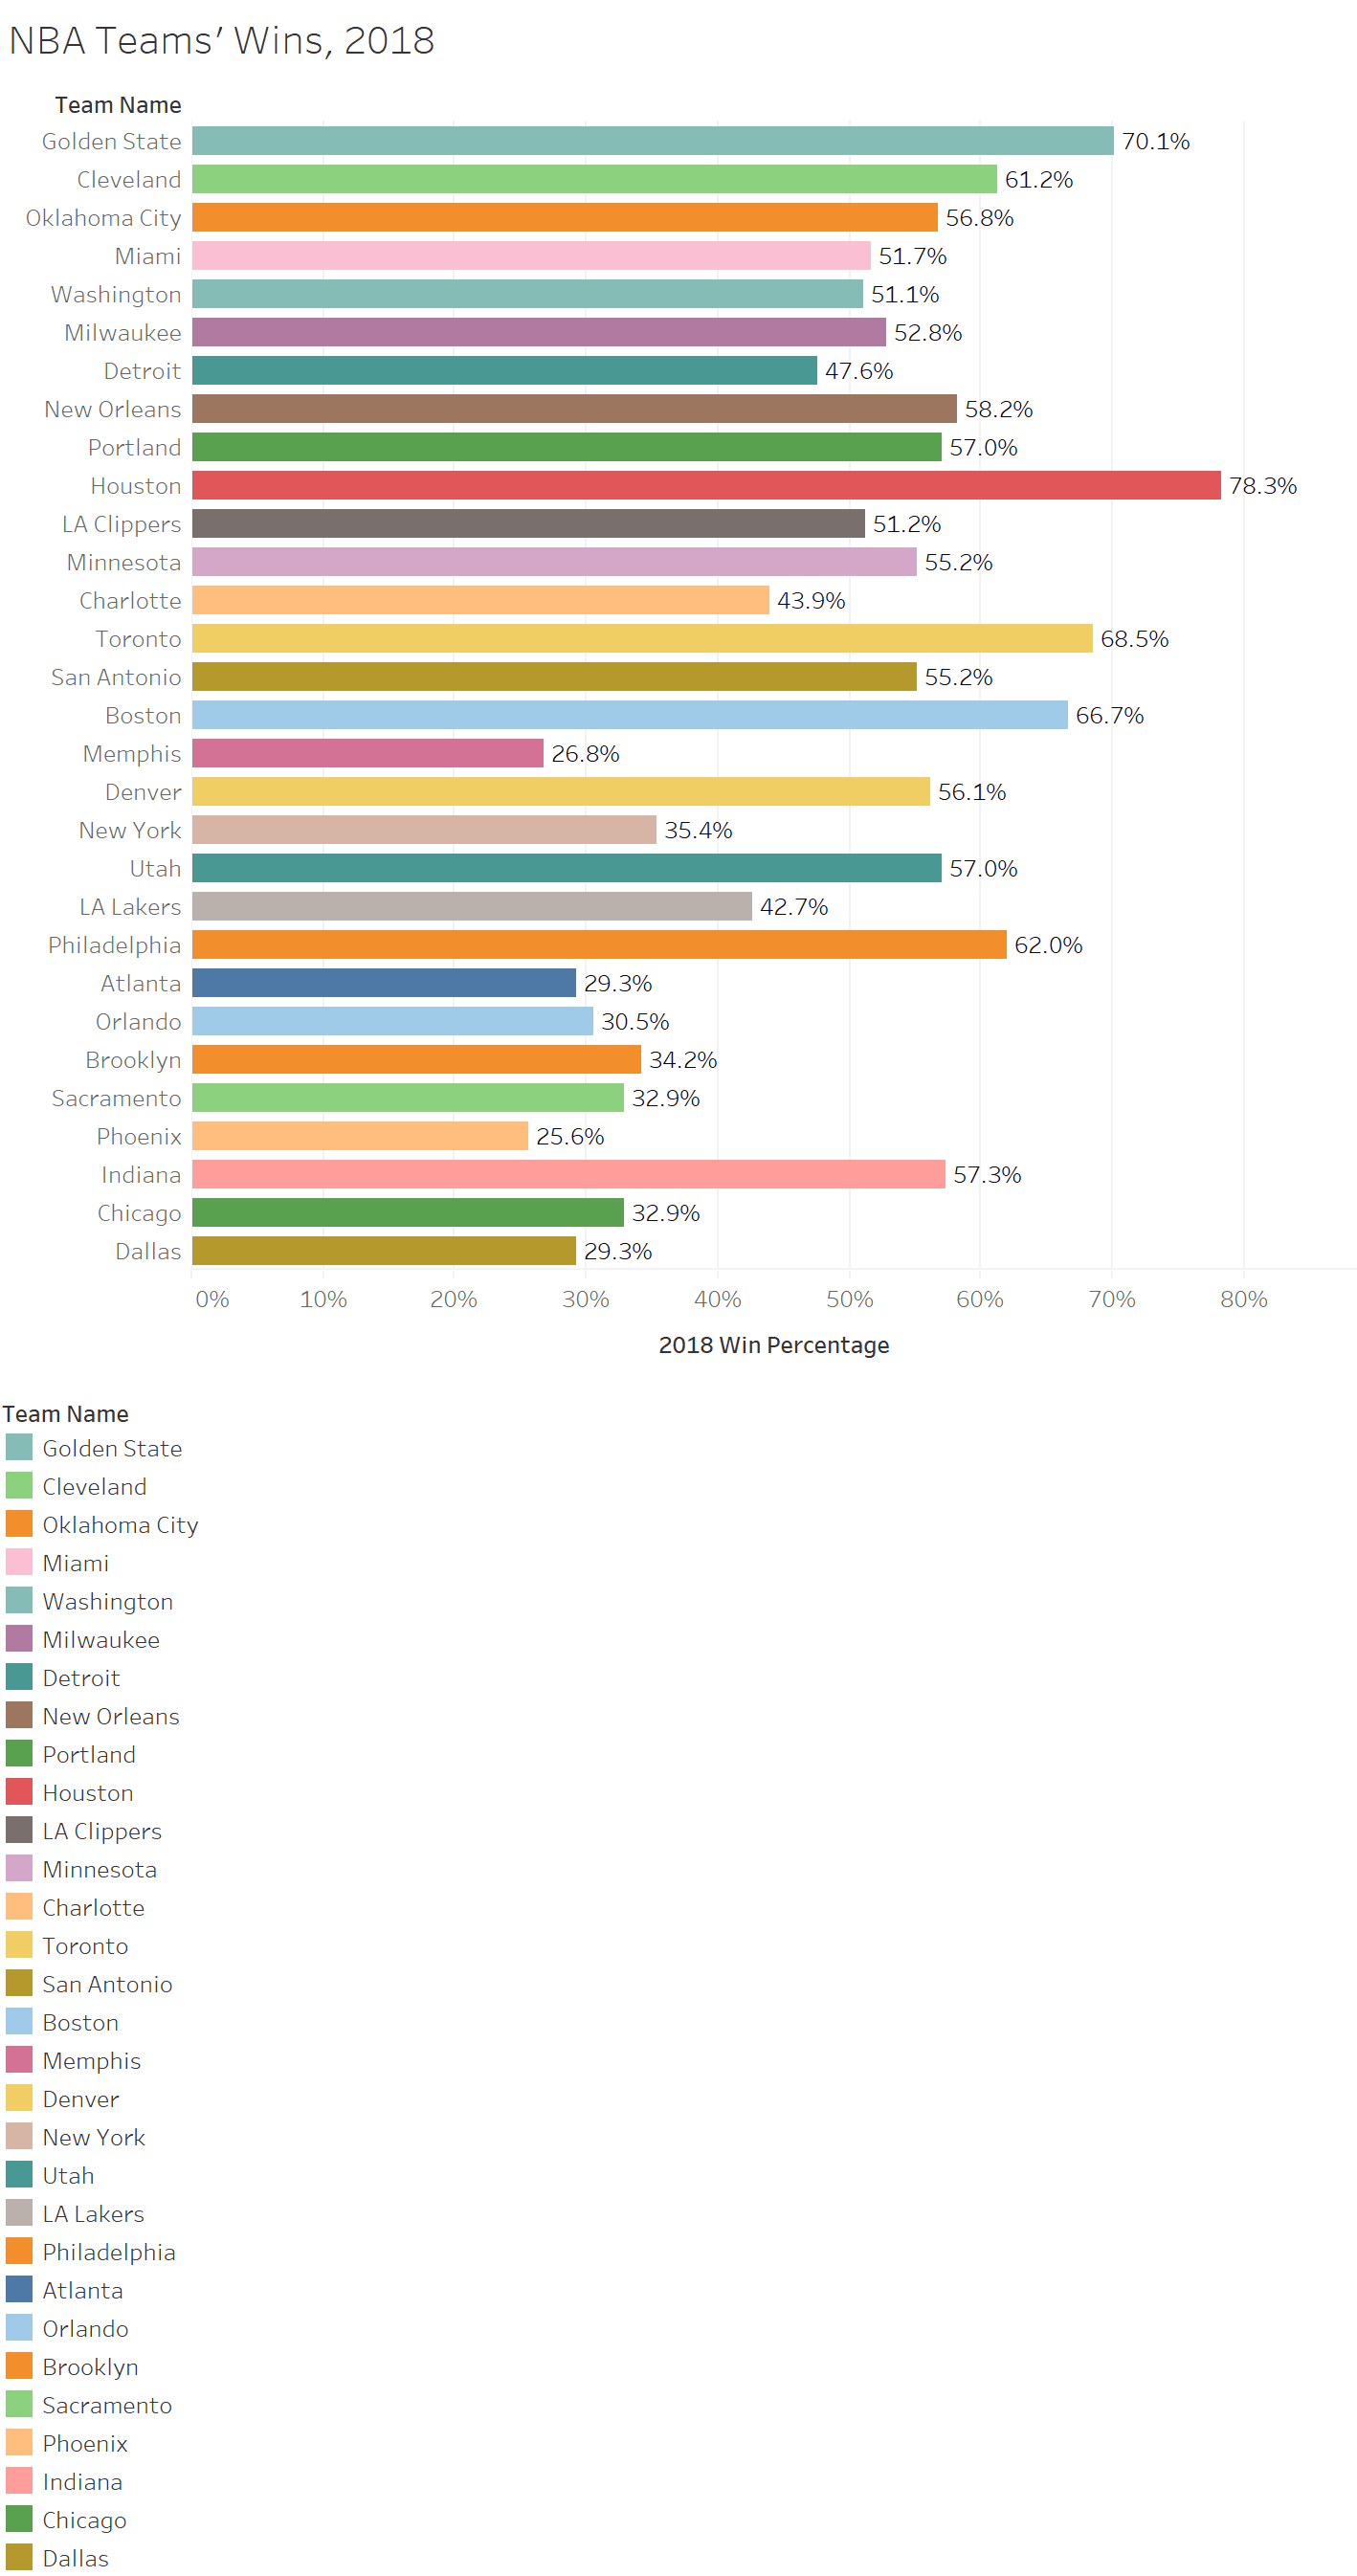
Shifting to what that money paid for – wins. The following is a look at the number of wins by team through the conference finals (meaning, it includes the 12 wins by Golden State and Cleveland so far, as well as the 11 wins by the Boston Celtics and Houston Rockets, and so forth). The figure is sorted by the size of the teams’ payrolls.
Interestingly, the ranking looks more random that directly connected, although the two end up being connected. Oklahoma City, for example, which lost to the Utah Jazz in the first round of the playoffs, had the third highest payroll, while producing the 11th best winning percentage. Miami performed even worse, coming in 16th in winning percentage although having the fourth highest payroll. The remaining figures are self-explanatory.
The Correlation Between Salaries and Wins
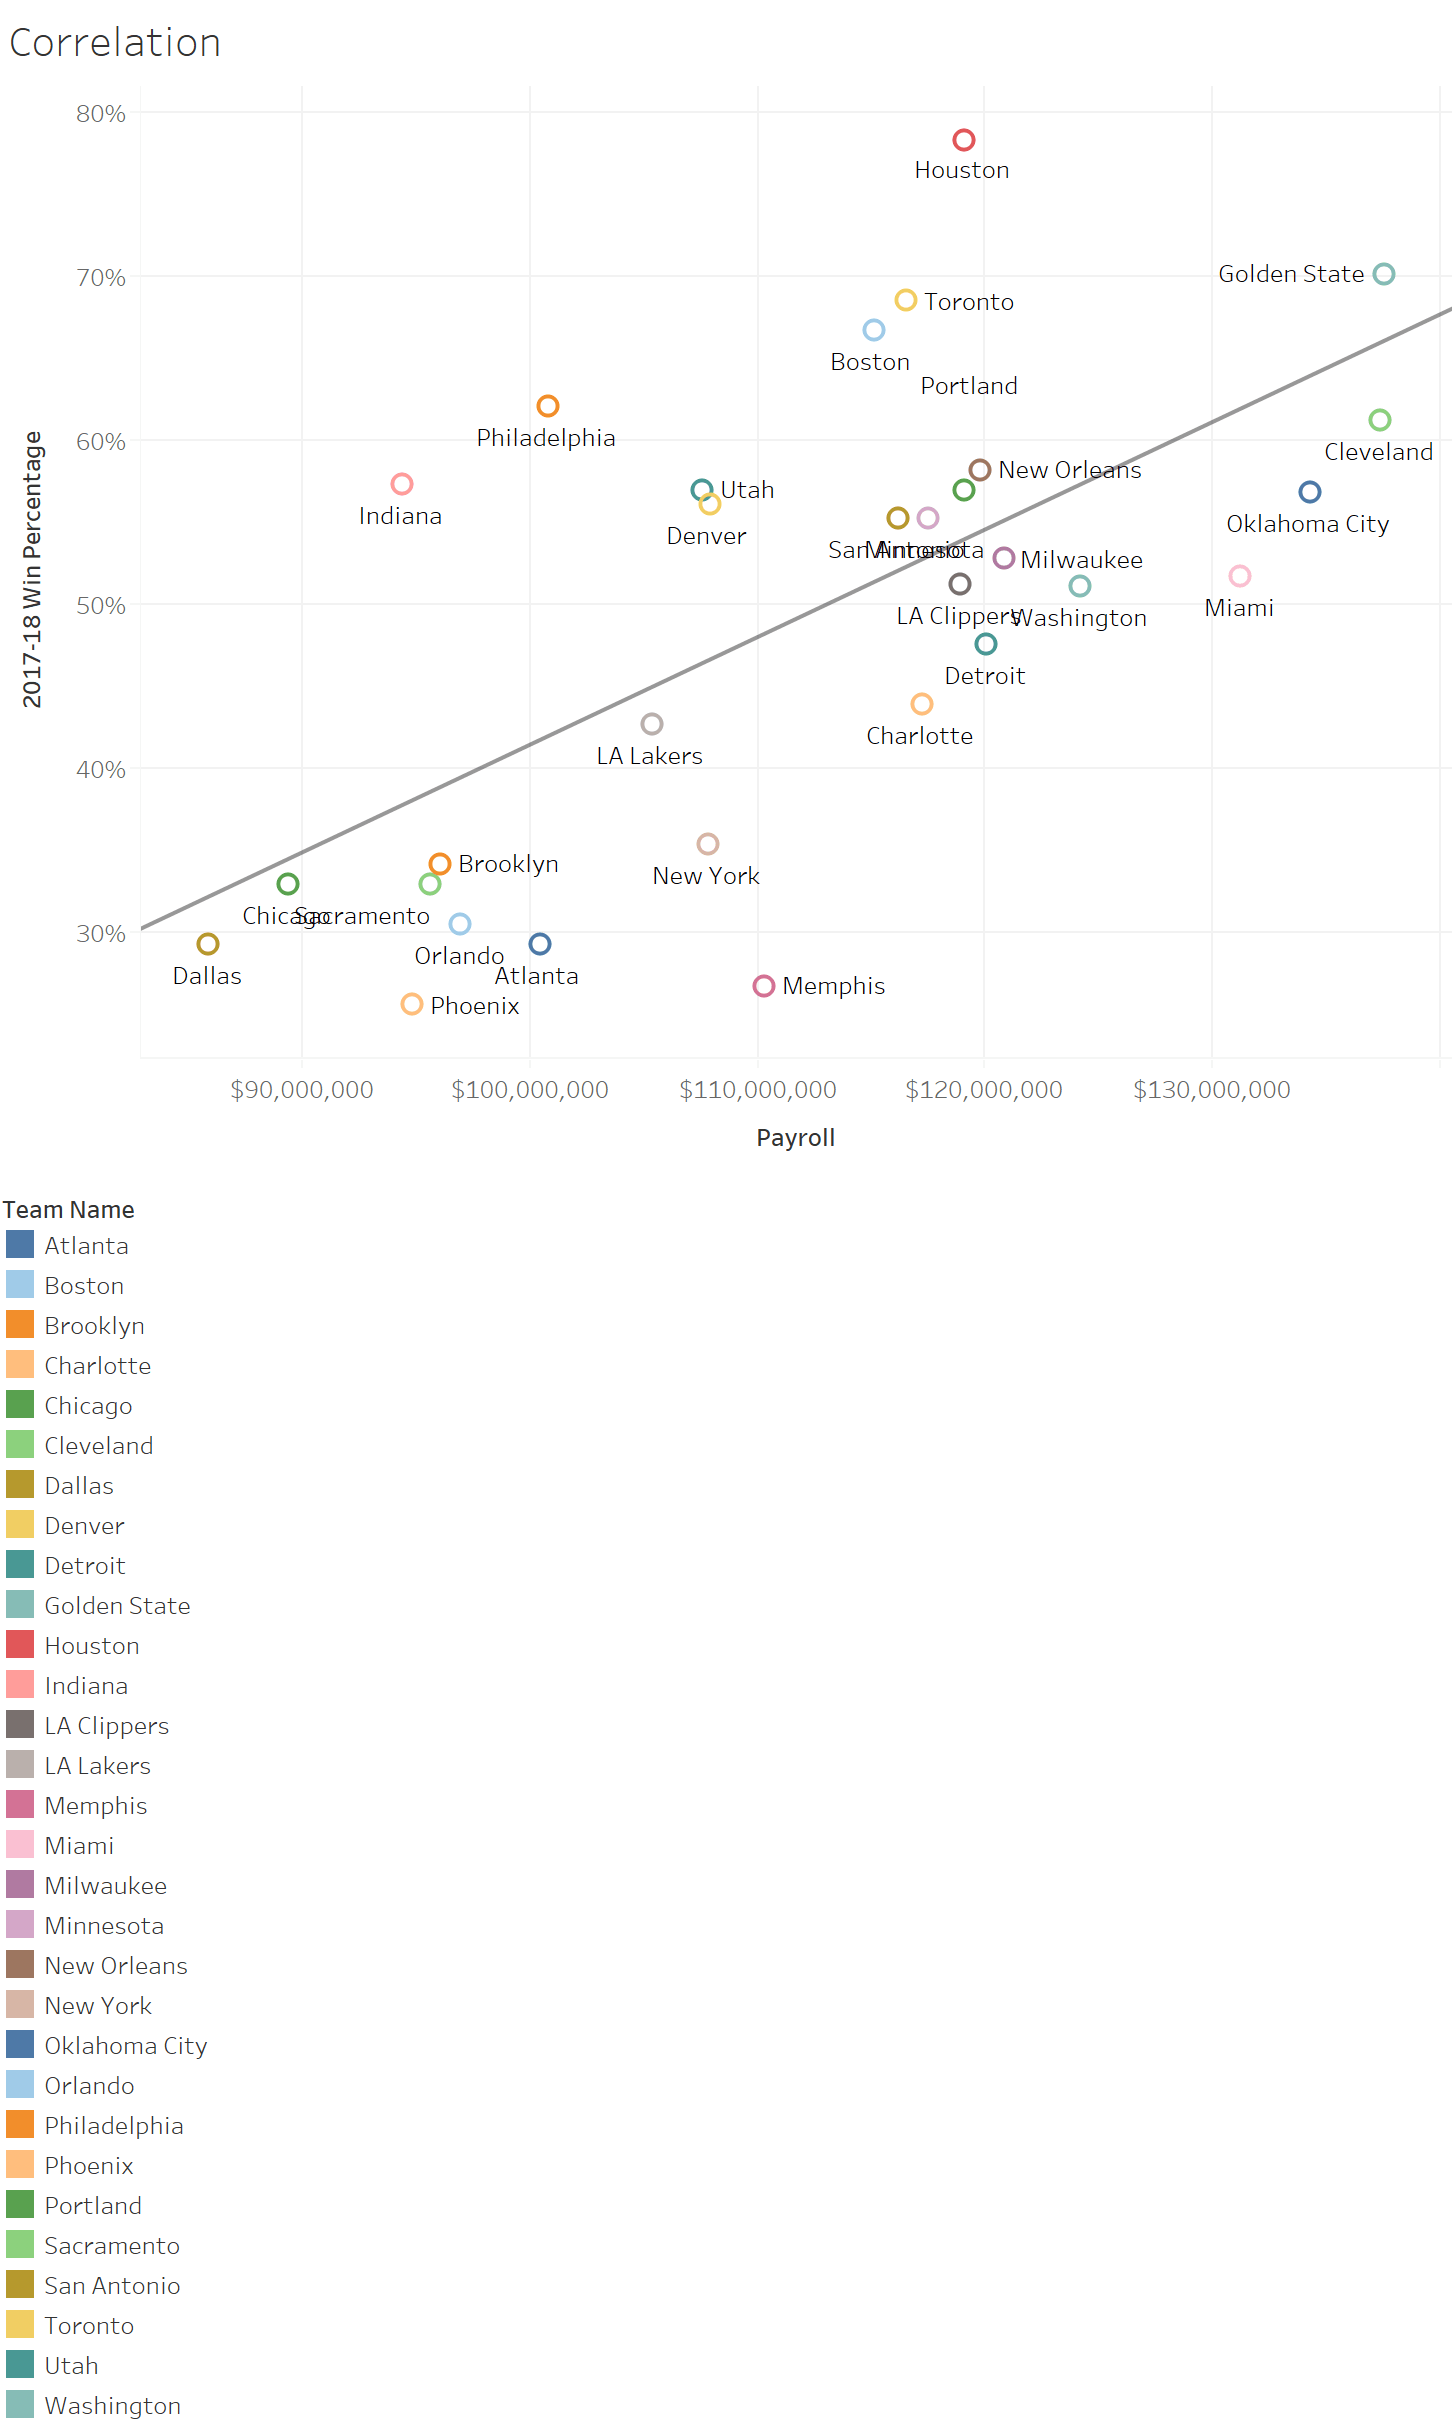
With the two components now established, here’s a look at the correlation between win percentage and team payroll. Perhaps somewhat surprisingly, the two are generally correlated.
The teams above the linear regression line are teams that over-performed, meaning they won more games than what their payroll would predict.
Interestingly, teams in this group include Golden State, Houston, Toronto, Boston, New Orleans, San Antonio, Denver, Philadelphia, Indiana, and a few others.
On the other end, underperforming teams Cleveland, Oklahoma City, Miami, Washington, Detroit, Charlotte, New York, Memphis, LA Lakers, Atlanta, Brooklyn, Phoenix, Chicago, Dallas, and a few others.
Cost per Win – The Chumps and the Wise Ones
Now to the question that matters – which teams had chump GMs (and owners) and which teams made their owners look wise.
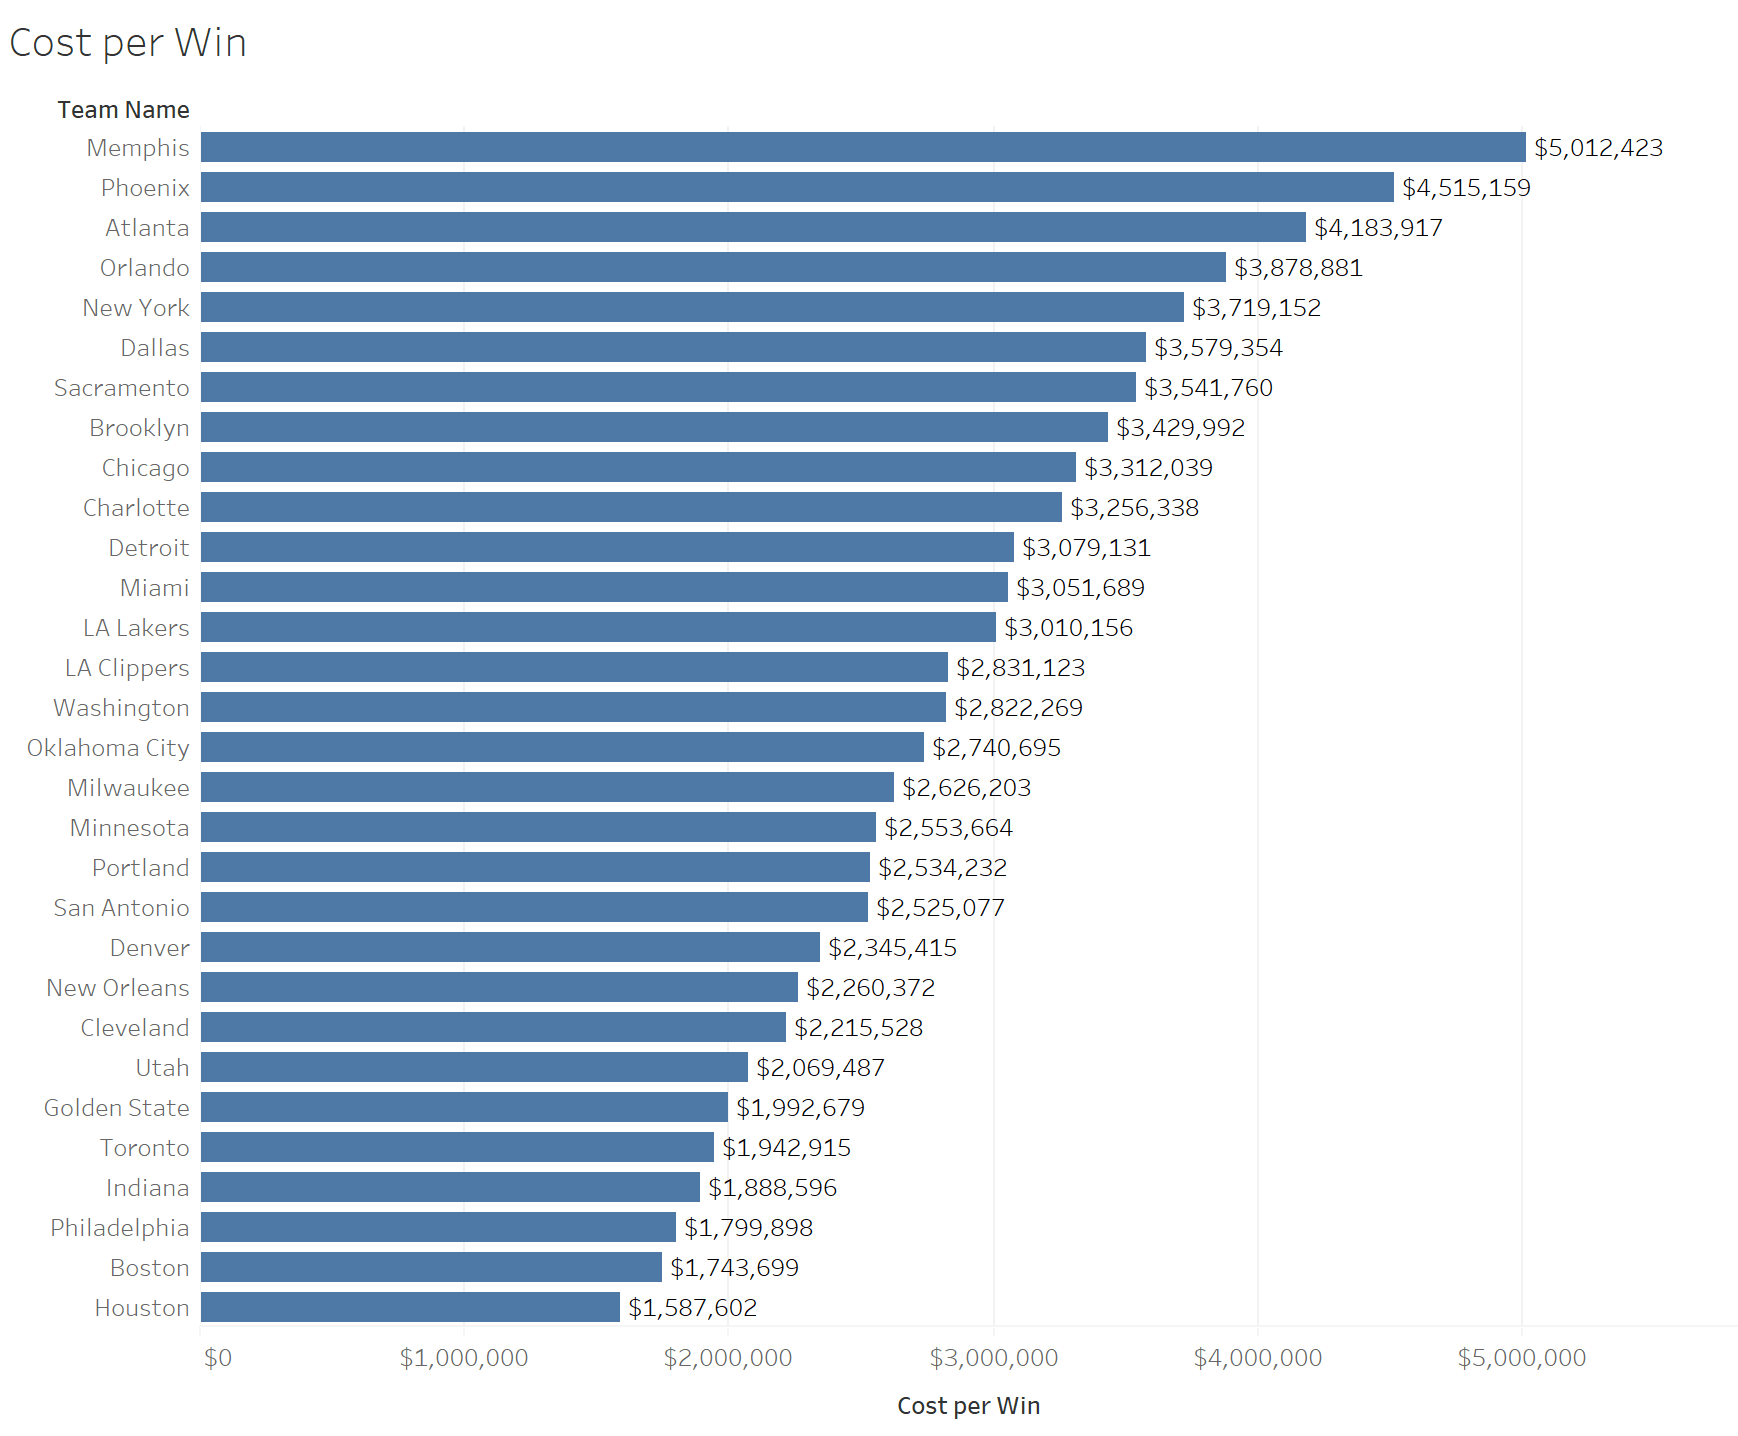
Fascinatingly, the sucker owners include Memphis (cost per win in parentheses) ($5.0 million), Phoenix ($4.5 million), Atlanta ($4.2 million), Orlando ($3.9 million), and New York ($3.7 million).
On the other end, the genius GMs and owners include Houston ($1.6 million per win), Boston ($1.7 million per win), Philadelphia ($1.8 million), Indiana ($1.9 million), and Toronto ($1.9 million).
Conclusion
Overall, when judged by how much owners paid per win, the NBA is packed full of wise ones and more than just a few suckers.


