Unbeknownst to no one, the yield curve bumped above 3 percent this past week. The “psychologically” important threshold hasn’t spooked the s&p 500 (yet?), but the news hasn’t been met by the market as a grand achievement.
Since moving above 3 percent, the yield on the 10-year Treasury Note subsided to end the week, and so far has floated below 3 percent through Tuesday.
Given that the 10-year continues to float around the 3 percent level, the question here is simple.
How do equities perform when the yield curve bumps above 3 percent?
Here’s a look.
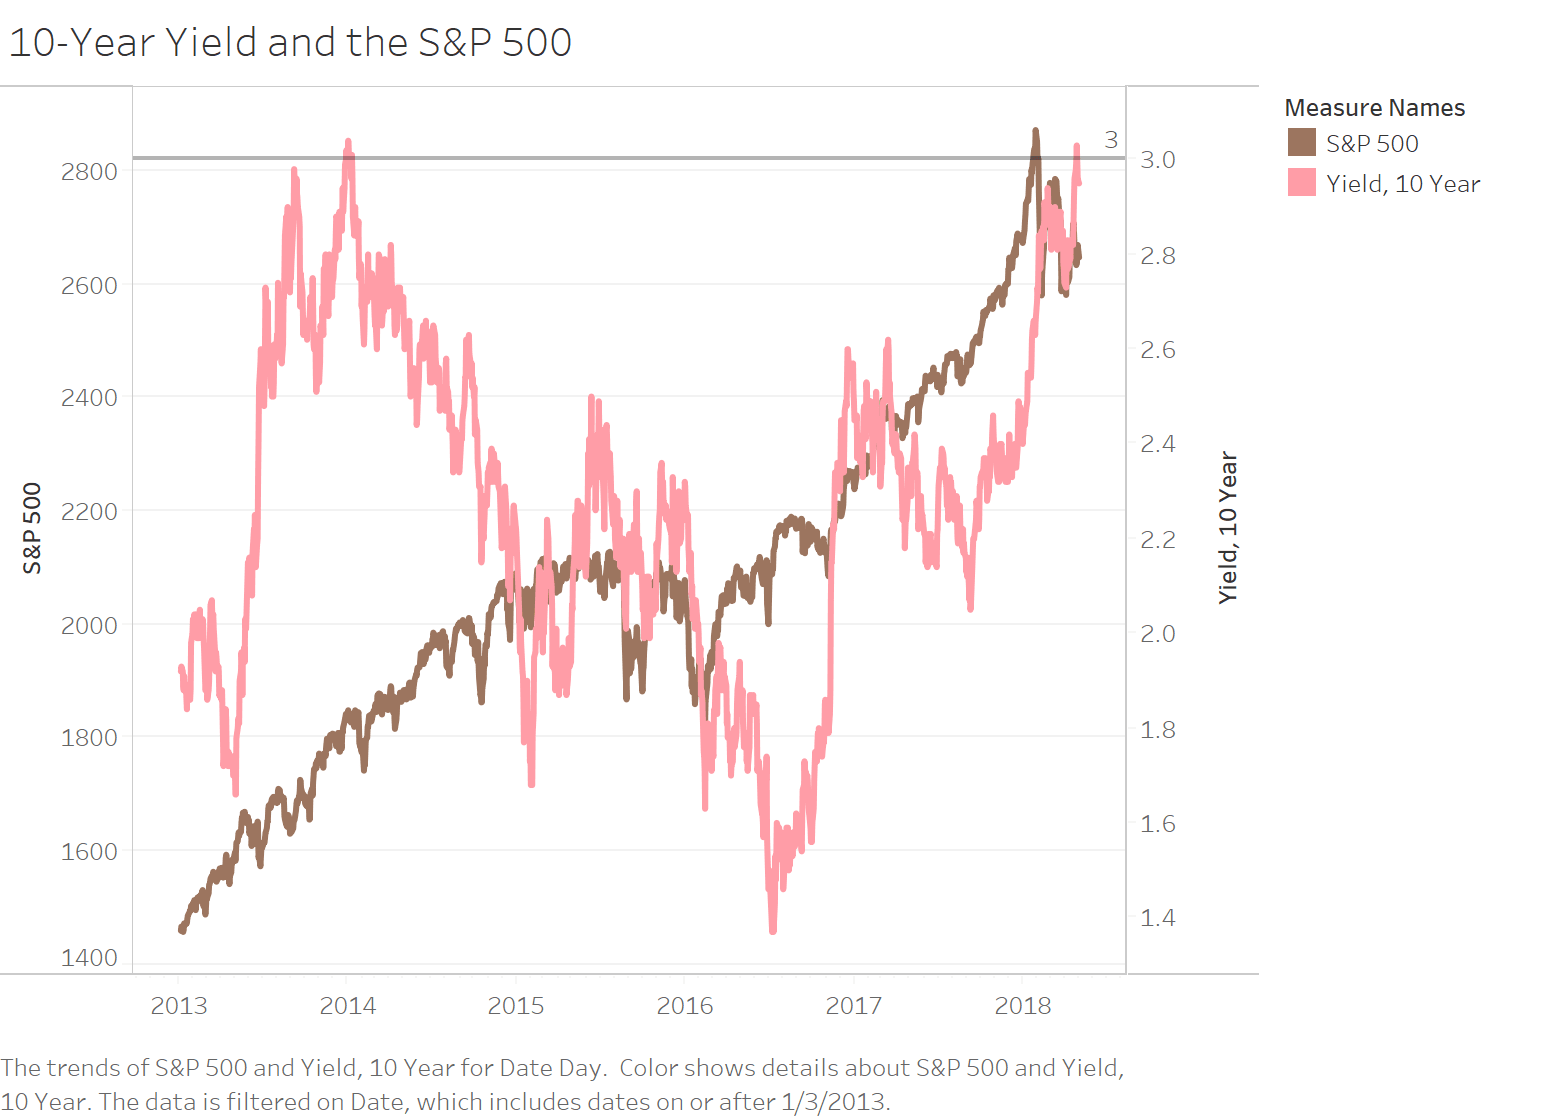
The 10-Year Treasury Yield and the S&P 500

First, the following is the raw connection between the 10-year Treasury yield and the S&P 500.
For most of the history of trading in the 10-year Treasury Note, the yield has floated above 3 percent. It is only recently, when the Federal Reserve decided to be unreasonable about it's interest rate manipulations, that the 10-year yield has consistently floated below 3 percent.
Perhaps the second observation from the following figure is that it's difficult to see a strong connection between the return of the S&P 500 and the yield on the 10-year Treasury. Maybe a zoomed view will help.
A Zoomed View of the 10-Year Yield and the S&P 500 Return
The zoomed view below, keeping only observations since 2013, makes it a little easier to see the relationship, although not easily. At the end of 2013, the yield curve bumped above 3 percent, after which the S&P 500 turned south quickly. Other recent 3-plus movements occurred prior to 2013, with the exception of the April 2018 3-plus yield movements.
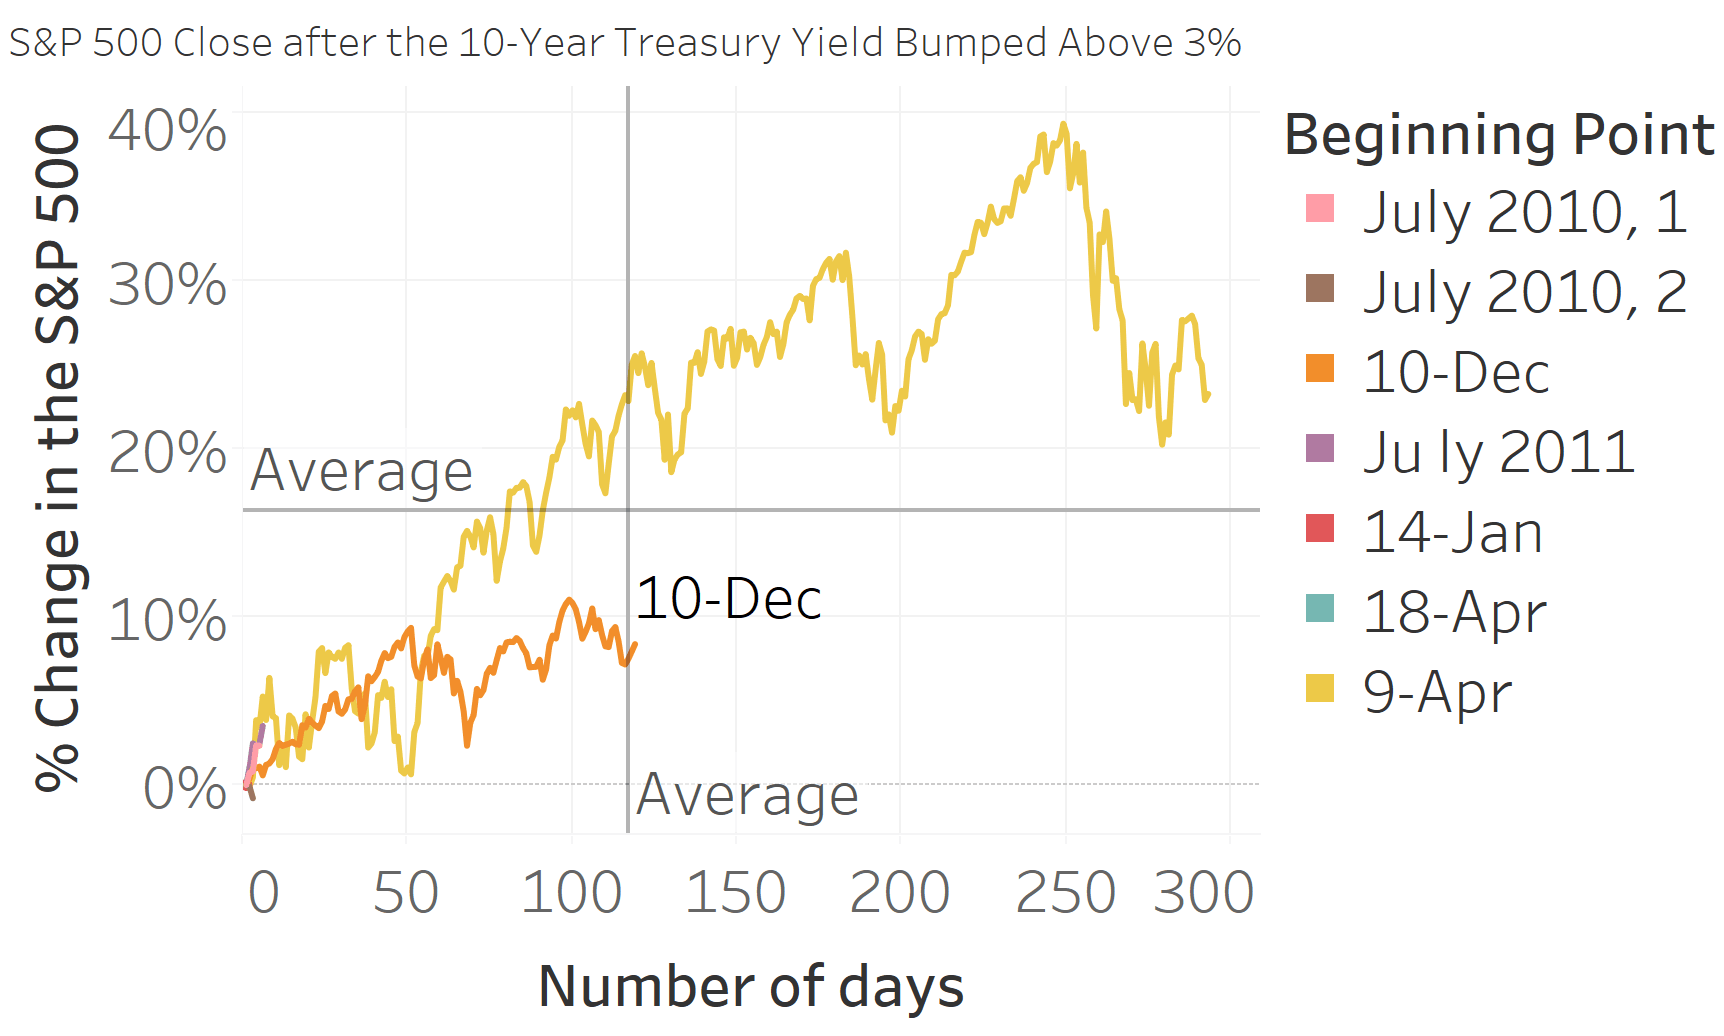
S&P 500 Return When the Treasury Yield Bumps Above 3 Percent
Here's a look at the return of the S&P 500 when the 10-year yield curve bumps above 3 percent for at least 3 days.
Since the 10-year's trading existence, there's only been 8 instances when the yield curve has moved from sub-3 percent to above 3 percent (again, for most of the 10-year yield's history, the yield has floated above 3 percent - it's only recently when the Fed engineered such low interest rates).
Here's a look at those 8 instances.
Interestingly, although probably not unsurprisingly, most of the 8 have been quite short (the December 31, 2018 experience is not shown because it lasted only 1 day (for 3 consecutive days) above 3 percent.
There are two very long periods - April 2009 and December 2010. In both cases, the S&P 500 performed well. The S&P 500 gained 23 percent for the 292 days the 10-year yield stayed above 3 percent in the April 2009 experience. The December 2010 experience wasn't as strong, with the S&P 500 gaining 8 percent over the 119 days of above 3 percent 10-year yield trading.
The average lasting period for above 3 percent trading for the 10-year Treasury yield is 117 days and an S&P 500 return of 16 percent. Not bad, not bad at all.
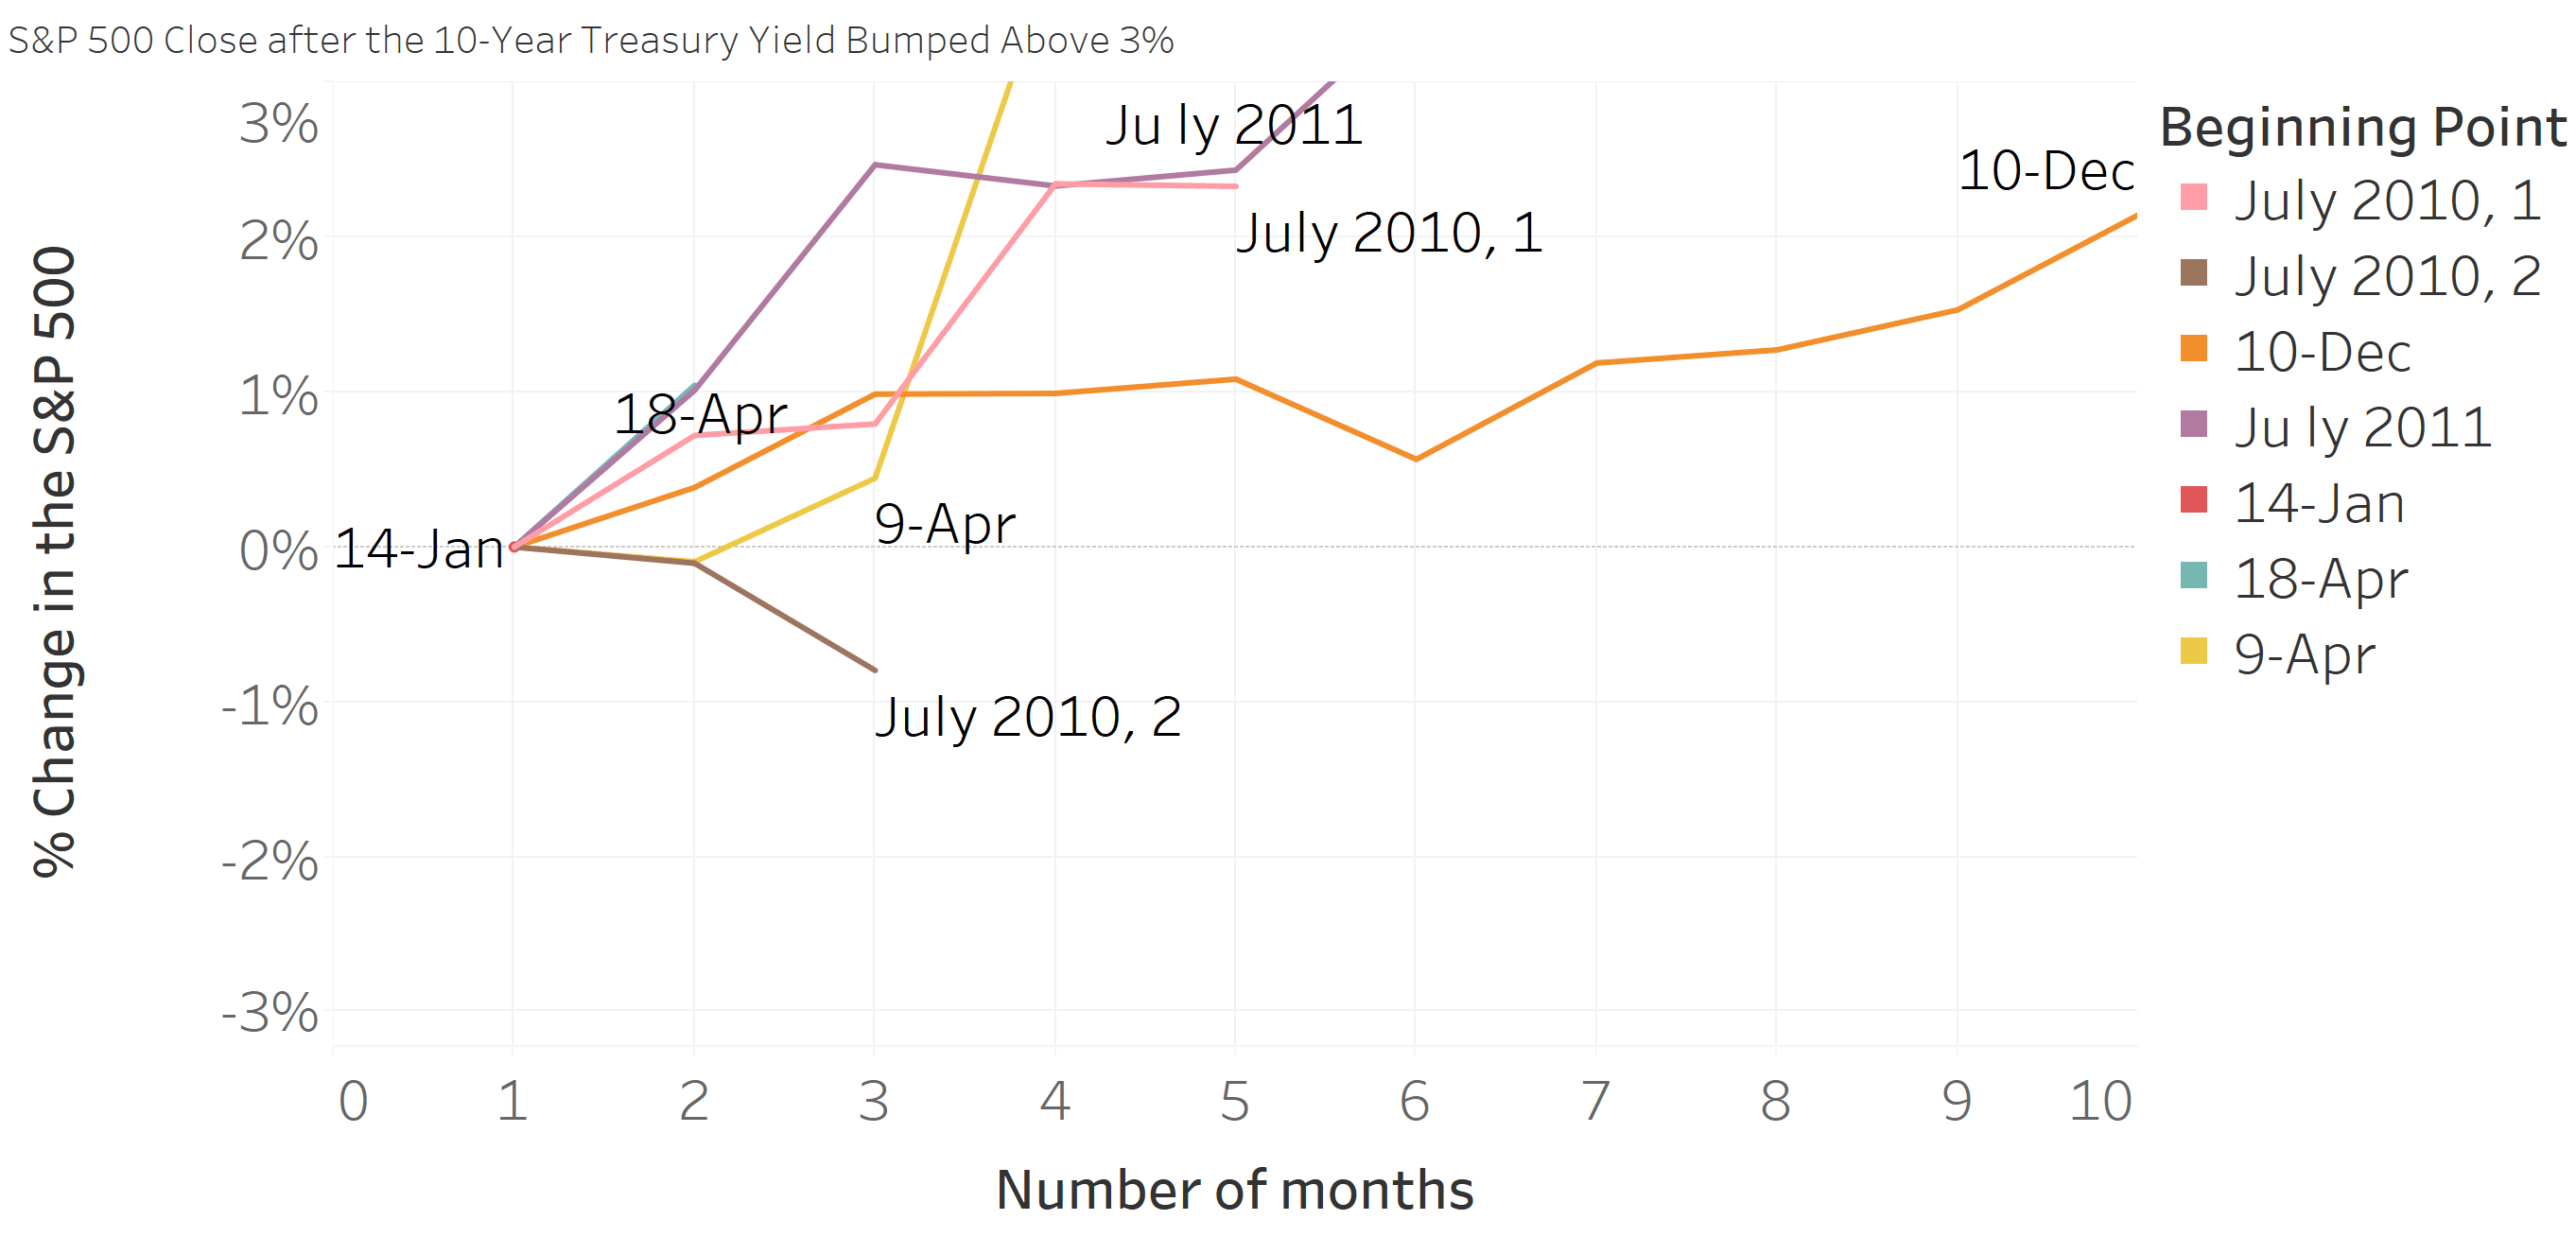
The Short-Lasting Instances
The previous graphic is impossible to read for the short duration periods. The following is a zoomed view.
Interestingly, with the exception of a few days in July 2010 and April 2009, most of the above-3 percent 10-year Treasury Note trading days have seen the S&P 500 perform just fine - in fact, better than normal.
Conclusion
Overall, any preoccupation with the 10-year Treasury Note yield moving above 3 percent is probably overplayed. In most cases when the yield has moved above 3 percent, the market return has been just fine - usually positive.


