Here’s the second installment of the new “What the EPS?” series, where I look at earnings trends across sectors, countries, regions…. taking my usual top-down approach. This week we look at earnings trends for the S&P500, specifically the path of forward earnings (up sharply), trailing earnings (up slowly), and estimates of long term future earnings growth (up sensationally*).

Q1 hedge fund letters, conference, scoops etc, Also read Lear Capital
The key points on the S&P500 earnings outlook are:
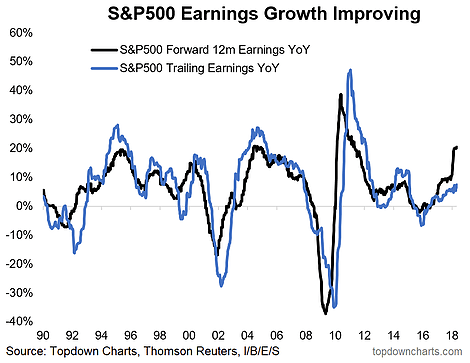
-Forward earnings growth is running hot (thanks to a spike in upward revisions driven by the tax cuts).
-Trailing earnings are plodding along, following a recovery from the 2015/16 earnings recession.
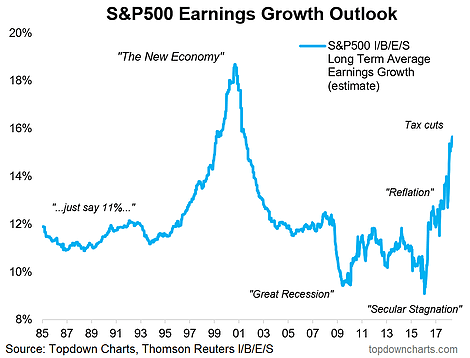
-Long term growth estimates have spiked to the highest levels seen since the dot com boom.
- Forward vs Trailing Earnings Growth: This is an important chart for anyone who cares about the S&P500. It shows the pace of growth in forward earnings (consensus estimates of the next 12 months earnings) vs trailing earnings (actual earnings over the last 12 months). The obvious standout is the surge in forward earnings (thanks to tax cuts), the less obvious standout is the earnings recession in 2015/16, and relatively lackluster pace of earnings growth thereafter - no signs of overheating there! (yet)
- Consensus Long Term Earnings Growth: The next chart shows a rather interesting indicator I found as I sifted through the dozens of series on Thomson Reuters Datastream, termed "Weighted Average Long Term Growth Forecast". As you might guess, this is the weighted average long term expected earnings growth rate for the S&P500. The chart below provides an interesting, if cautionary, look at this indicator across time... compare and contrast the peak of the dot com boom vs the depths of the global financial crisis. Something tells me this one might be more of a sentiment indicator than anything! Still, what a turnaround from the lows of 2016.
Looking for deeper insights? Why not take a free trial for an extra level of insight and service...
Follow us on:
LinkedIn https://www.linkedin.com/company/topdown-charts
Twitter http://www.twitter.com/topdowncharts
Article by Top Down Charts


