They say the pen is mightier than the sword.
However, what they often fail to mention is that the pen is even mightier when it comes with massive amounts of leverage, influence, and power backing it up on every stroke.

Q1 hedge fund letters, conference, scoops etc, Also read Lear Capital: Financial Products You Should Avoid?
How to Win Friends and Influence Countries
Every country is interested in gaining influence, and earlier this week we showed you an interactive infographic from the Lowy Institute that compared the strength of Asian powers to the United States.
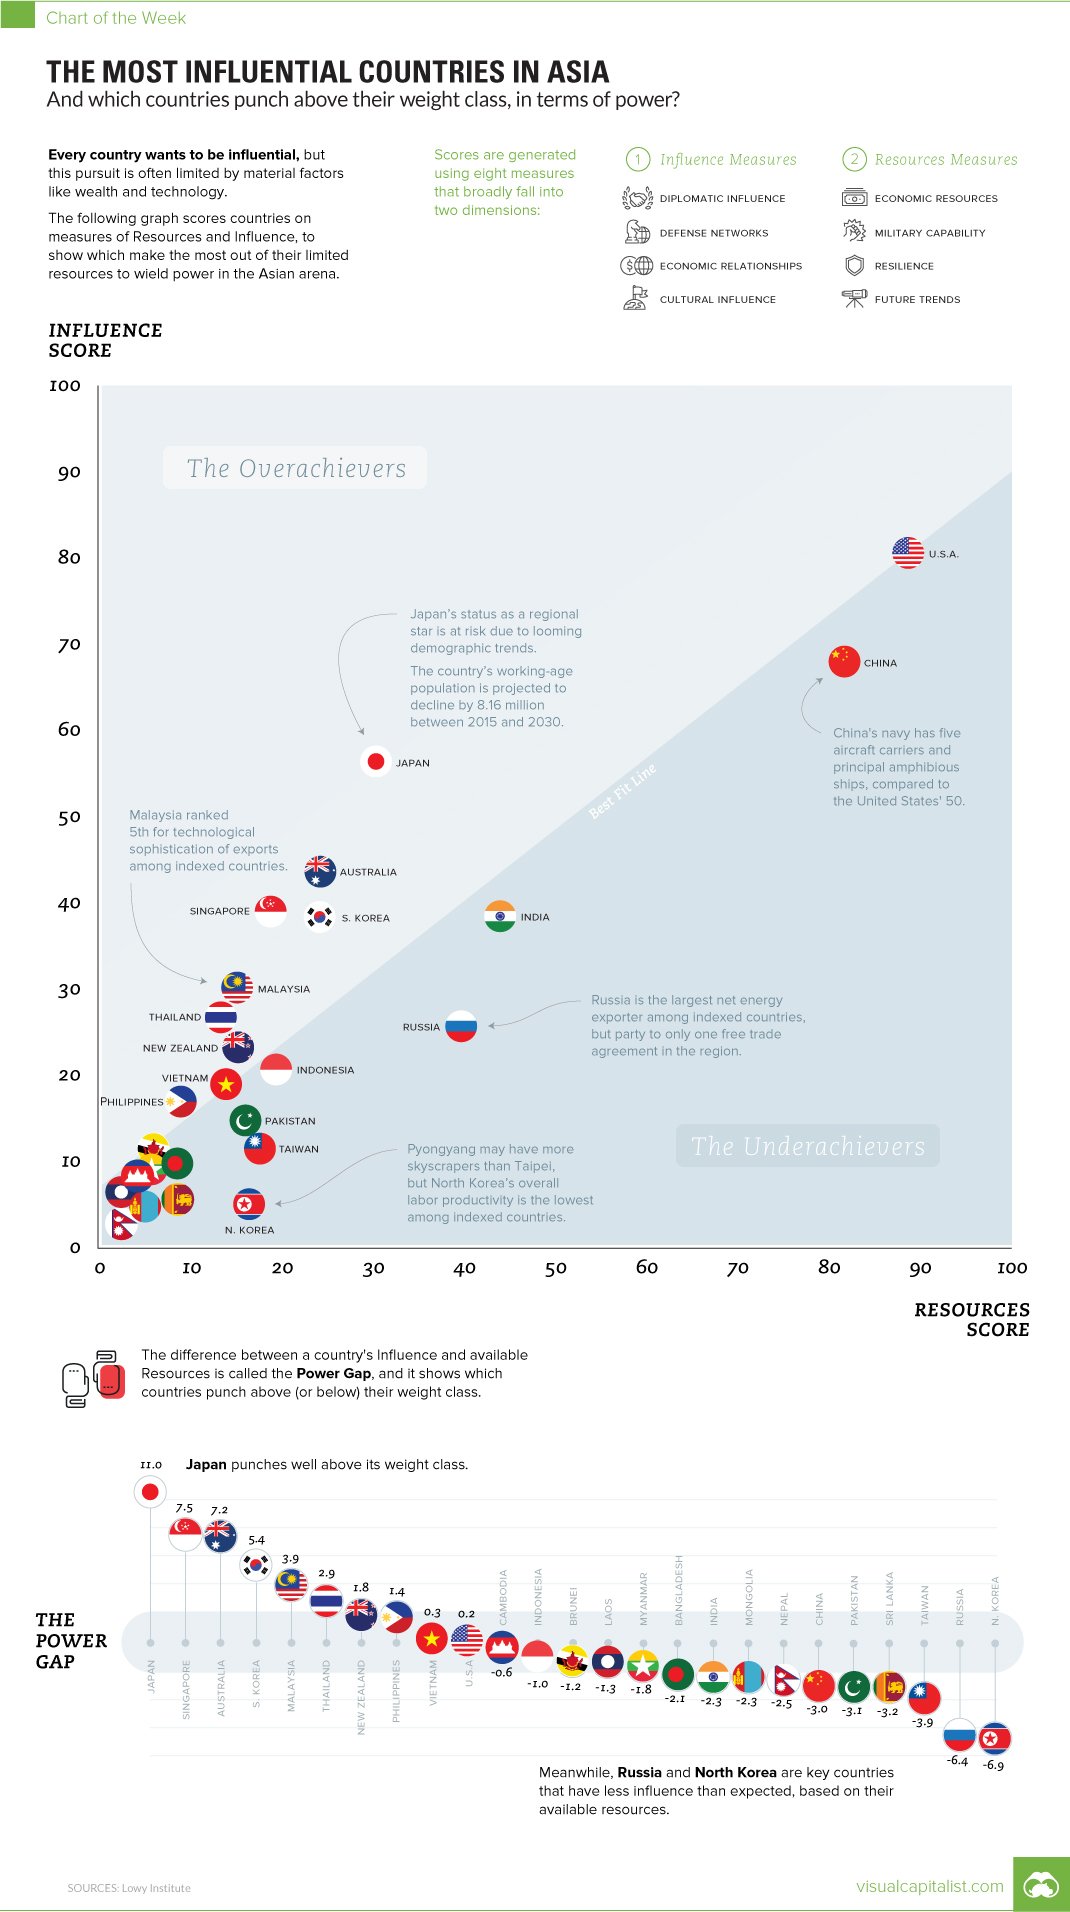
Today’s chart uses the same data set, and it not only highlights the most influential countries in the Asian arena, but it also plots resources (i.e. the potential for power) of countries against their actual level of influence. The Lowy Institute calls this the “Power Gap” and it is intended to show whether a country is overperforming or underperforming in terms of fulfilling its expected level of influence on the region.
Here are descriptions of the two measures which are used for the Power Gap:
Resources: A score based on economic resources, military capability, resilience, and future trends, this measurement provides an assessment of a country’s material capabilities and robustness, which are requisite factors in the exercise of power.
Influence: A score based on diplomatic influence, economic relationships, defense networks, and cultural influence, this measurement is used to assess a country’s level of influence on other countries in the Asian arena.
Next, we’ll look at the actual numbers to see what we can learn.
Measuring Influence
Here’s how countries perform – as a reminder, this is based on the Asia Power Index, which is made up of countries in the Asia-Pacific region and the United States.
| Rank | Country | Overall Power | Expected Power | Power Gap |
| #1 | United States | 85.0 | 84.8 | 0.2 |
| #2 | China | 75.5 | 78.6 | -3.0 |
| #3 | Japan | 42.1 | 31.1 | 11.0 |
| #4 | India | 41.5 | 43.8 | -2.3 |
| #5 | Russia | 33.3 | 39.7 | -6.4 |
| #6 | Australia | 32.5 | 25.4 | 7.2 |
| #7 | South Korea | 30.7 | 25.3 | 5.4 |
| #8 | Singapore | 27.9 | 20.4 | 7.5 |
| #9 | Malaysia | 20.6 | 16.7 | 3.9 |
| #10 | Indonesia | 20.0 | 20.9 | -1.0 |
| #11 | Thailand | 19.2 | 16.3 | 2.9 |
| #12 | New Zealand | 18.9 | 17.1 | 1.8 |
| #13 | Vietnam | 16.5 | 16.2 | 0.3 |
| #14 | Pakistan | 15.1 | 18.2 | -3.1 |
| #15 | Taiwan | 14.9 | 18.8 | -3.9 |
| #16 | Philippines | 12.4 | 11.0 | 1.4 |
| #17 | North Korea | 11.4 | 18.3 | -6.9 |
| #18 | Bangladesh | 8.7 | 10.9 | -2.2 |
| #19 | Brunei | 8.2 | 9.4 | -1.2 |
| #20 | Myanmar | 7.6 | 9.4 | -1.8 |
| #21 | Sri Lanka | 7.6 | 10.8 | -3.2 |
| #22 | Cambodia | 6.1 | 6.7 | -0.6 |
| #23 | Mongolia | 5.0 | 7.3 | -2.3 |
| #24 | Laos | 4.8 | 6.1 | -1.3 |
| #25 | Nepal | 3.1 | 5.6 | -2.5 |
In terms of absolute power, the U.S. and China top the list. Interestingly, Russia is only 5th place overall.
The “Power Gap” partially seems to explain this, as Russia appears to have the biggest gap between its expected power and its actual power. The country has the second worst power gap at -6.4.
Looking at the opposite end of the spectrum, it appears Japan, Singapore, and Australia are all punching above their weight in terms of influence. Meanwhile, Malaysia has the 5th best power gap, which may be unexpected for many.
Article by Jeff Desjardins, Visual Capitalist


