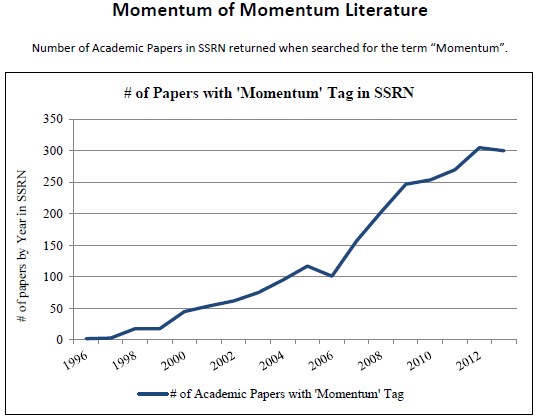
As evidenced by the image below, interest in momentum research has taken off since the original 1993 Jegadeesh and Titman paper:

Source: “Two Centuries of Multi-Asset Momentum (Equities, Bonds, Currencies, Commodities, Sectors and Stocks)” https://papers.ssrn.com/sol3/papers.cfm?abstract_id=2607730
Most of the research on momentum is repetitive and reaks of data torture, but Geczy and Samanov have been conducting some fascinating out of sample research on the topic.
We have discussed prior research by Gezcy and Samonov here on U.S. equity momentum over 200 years of data. The evidence is similar to the academic finding that, on average, intermediate-term winning stocks continue winning, while intermediate-term losing stocks continue losing–otherwise known as a continuation of momentum for stocks.(1)
But studying 200+ years of equity data was not enough for Gezcy and Samanov — they have a new paper titled, “Two Centuries of Multi-Asset Momentum (Equities, Bonds, Currencies, Commodities, Sectors, and Stocks).”
This paper builds on the original paper (mentioned here), but adds (1) other asset classes and (2) examines time-series momentum. The paper also looks at how momentum performs in other asset classes and international equities. (similar to what Asness, Moskowitz, and Pedersen show in, “Value and Momentum Everywhere:” the momentum premia exists in international equities as well as other asset classes.
To follow-up on the “Value and Momentum Everywhere” study, this paper digs into how momentum works both within and across asset classes, over a longer time-period. The image below gives a graphical depiction of the number of asset classes studied in the paper across time.

Source: “Two Centuries of Multi-Asset Momentum (Equities, Bonds, Currencies, Commodities, Sectors and Stocks)” https://papers.ssrn.com/sol3/papers.cfm?abstract_id=2607730
Below we dig into the results from the paper.
The Results
First, the paper examines how momentum works within (and across) each asset class. This is done by sorting securities into a relative “winner” and a relative “loser” portfolio by using the classic 12_2 momentum screen — this is the twelve-month momentum of each security excluding the last two months (so 10 months of returns). Within each universe, the top third are deemed “winners” and the bottom third are deemed “losers.”
The table below examines the returns for each asset class to the Winner, Loser, and Winner minus Loser portfolios.
Results are shown below:
The results are hypothetical results and are NOT an indicator of future results and do NOT represent returns that any investor actually attained. Indexes are unmanaged, do not reflect management or trading fees, and one cannot invest directly in an index.
As shown before, intermediate-term momentum has a continuation pattern, whereby winners continue to win and losers continue to lose. This basic strategy seems to work across all universes examined over a 200+ year sample. Talk about robustness!
However, while the 200+ years of data show winners beating losers, does this work all the time?
To study this question the author’s document the returns to the L/S portfolios (summary results shown above) for each decade.
The results are documented below:
The results are hypothetical results and are NOT an indicator of future results and do NOT represent returns that any investor actually attained. Indexes are unmanaged, do not reflect management or trading fees, and one cannot invest directly in an index.
As is shown above, while the summary statistics, over 200+ years, show positive returns to the L/S portfolios, there can be decades of negative returns!
Another way to view this result is in the time-series charts of the winner and loser portfolios, shown below:
The results are hypothetical results and are NOT an indicator of future results and do NOT represent returns that any investor actually attained. Indexes are unmanaged, do not reflect management or trading fees, and one cannot invest directly in an index.
So while the long portfolio outperformed the short portfolio, there were many instances of underperformance. As pointed out here, momentum investing can be painful!
And not only can momentum investing be painful, but the correlations across asset classes for the L/S portfolios have been increasing, as evidenced below:
The results are hypothetical results and are NOT an indicator of future results and do NOT represent returns that any investor actually attained. Indexes are unmanaged, do not reflect management or trading fees, and one cannot invest directly in an index.
The correlation table (above) should be accounted for when making future investment decisions, as correlations across asset classes have increased, thus lowering the potential benefit of diversifying across asset classes.(2)
Additional Momentum Factor Results
The paper also digs deeper into sector-momentum strategies (buying the winning sectors and shorting the losing sectors) within each country.
The results are shown below:
The results are hypothetical results and are NOT an indicator of future results and do NOT represent returns that any investor actually attained. Indexes are unmanaged, do not reflect management or trading fees, and one cannot invest directly in an index.
Overall, sector momentum appears to work for most (but not all) countries.
Now, portfolio construction can matter, especially for stock momentum portfolios. We describe the effects of portfolio construction on U.S. equity momentum portfolios here. In addition, if one holds a momentum stock portfolio too long there is actually a momentum “reversal” effect (so make sure you have turnover!). Within this paper, the authors examine how long the momentum “premium” lasts for the L/S portfolios by tracking the monthly returns to the portfolio after the formation date.
The results are hypothetical results and are NOT an indicator of future results and do NOT represent returns that any investor actually attained. Indexes are unmanaged, do not reflect management or trading fees, and one cannot invest directly in an index.
Overall, one notices (especially for stock portfolios), that intermediate-term momentum returns are generally the highest right after the rebalance date, indicating that intermediate-term momentum portfolios (generally) should be rebalanced more often.(3)
Last, the paper examines a “time-series” momentum or trend-following approach. We are big fans of trend-following, as a tool to help reduce left-tail events (A full list of our trend-following research can be found here).
The paper examines the returns to a trend-following strategy below:
The results are hypothetical results and are NOT an indicator of future results and do NOT represent returns that any investor actually attained. Indexes are unmanaged, do not reflect management or trading fees, and one cannot invest directly in an index.
As evidenced above, time series momentum generally had positive L/S portfolio returns.(4) The paper ends by comparing the results from (1) cross-sectional momentum and (2) time-series momentum (trend), and finds that while both are significant, cross-sectional returns have greater statistical significance. Our thought is the following — the two types of momentum can work together, that is, they are friends and not enemies.
Conclusions
This paper adds to the literature by documenting the returns to cross-sectional momentum strategies going back 200+ years on multiple asset classes. As is found by other researchers with more recent data, cross-sectional momentum strategies historically have worked, but do not work all the time and can be painful. Last, the paper finds that time-series momentum worked in the past, but the cross-sectional momentum strategies had more significance. We, along with Gary Antonacci, believe that one can use both time-series and cross-sectional momentum. (although we differ in our approaches).
Two Centuries of Multi-Asset Momentum (Equities, Bonds, Currencies, Commodities, Sectors, and Stocks)
- Christopher C. Geczy and Mikhail Samonov
- A version of the paper can be found here.
Abstract:
Extending price momentum tests to the longest available histories of global financial assets, including country equities, government bonds, currencies, commodities, sectors and U.S. stocks, we create a 215-year history of cross-sectional multi-asset momentum, and confirm the significance of the momentum premium inside and across asset classes. Consistent with stock level results, we document a large variation of momentum portfolio betas, conditional on the direction and duration of the state of the asset class in which the momentum portfolio is built. A significant recent rise in pair-wise momentum portfolio correlations suggests features of the data important for empiricists, theoreticians and practitioners alike.
- The views and opinions expressed herein are those of the author and do not necessarily reflect the views of Alpha Architect, its affiliates or its employees. Our full disclosures are available here. Definitions of common statistics used in our analysis are available here (towards the bottom).
- Join thousands of other readers and subscribe to our blog.
- This site provides NO information on our value ETFs or our momentum ETFs. Please refer to this site.
References
- Note that when momentum is measured over either (1) short or (2) long time horizons, there is a reversal effect.
- The assumption here is that more recent correlations should be more relevant in the future.
- For stock portfolios, we see the reversal effect take place the longer one holds the portfolio.
- An exception is the insignificant bond (price) L/S return
The post "The World's Longest Multi-Asset Momentum Investing Backtest!" appeared first on Alpha Architect.


