This article proposes tail risk hedging (TRH) as an alternative model for managing risk in investment portfolios. The standard risk management approach involves a significant allocation to hiqh-quality bonds. However, this approach has historically reduced expected returns over the long term (see article here and PDF available here). Accordingly, it could be sensible to pursue an alternative approach by managing equity risk directly, rather than avoiding or reducing it – thereby allowing investors to maintain higher overall equity allocations, which tend to deliver higher expected returns.

But how can one manage equity risk directly? Answer: market timing…I know, I know…a bad word in the world of investing but hear me out.
Market timing has rightfully been associated with poor investment performance in many situations. In my view, however, much of this underperformance can be attributed to inefficient implementations that involve uncomfortable tracking error (i.e., watch markets continue higher from the sidelines).
Instead of making wholesale changes to a portfolio, a tail risk (a.k.a. black swan) strategy might only comprise a 1-5% allocation. However, these positions would embed significant leverage to amplify their impact. Like card counting in blackjack, these strategies should only be employed opportunistically (i.e., when markets are vulnerable to tail risk). Moreover, their risk/reward profile should be extremely asymmetric with limited downside but significant upside potential (i.e., measured in multiples instead of percent returns).
Interestingly, I believe equity derivatives markets (e.g., put options, VIX products, etc.) could offer attractive risk/reward opportunities due to price distortions resulting from the popularity of short-volatility products.(1)
Figure 1: Allocate Capital According to the Attractiveness of the Opportunity
Overview
Tail risk hedging (TRH) strategies are effectively geared to profit from significant market corrections. They may be used alongside, or to replace, traditional risk management strategies (e.g., diversification via asset allocation) where the core portfolios have a significant allocation to equities or other volatile assets. They may also be used on a standalone basis to speculate and profit from market corrections (think The Big Short). We briefly discuss various applications at the end of this article.
Before delving into the details of TRH strategies, I first discuss the traditional approach to managing risk within investment portfolios. I then explain some of the vagaries associated with the often ill-fated strategy of market timing.
It is worth noting the TRH strategies discussed here are based on the equity and equity derivatives markets. However, I have also made a comparison to some of the speculative credit derivative strategies used to profit from the collapse of the housing bubble approximately 10 years ago.
Diversification via Asset Allocation
The conventional approach to managing portfolio risk typically involves diversifying investments amongst various asset classes. If the assets are not perfectly correlated, this will naturally mitigate the impact of a significant decline in any one asset class. At the same time, it will also dilute the upside potential of higher growth asset classes.
For example, consider a standard portfolio comprised of just stocks and bonds. Stocks have historically outperformed bonds by a significant amount over longer time periods (i.e., multiple percent per year). So the performance of portfolios with larger allocations to bonds have tended to lag those with smaller or no bond allocations. Indeed, when looking at rolling 10-year windows since the start of the Great Depression, stocks outperformed bonds 84% of the time. Moreover, the windows where stocks lagged bonds for a decade or more were clearly clustered around periods where stocks started with extremely high valuations (like now). I discuss the drivers behind these historical trends in more detail in my Asset Allocation article.
Figure 2: 10-year Rolling Returns
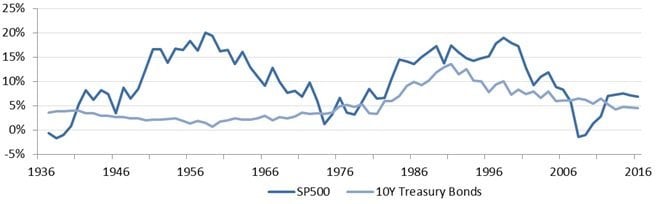
Source: Standard and Poor’s, Federal Reserve Board, The results are hypothetical results and are NOT an indicator of future results and do NOT represent returns that any investor actually attained. Indexes are unmanaged, do not reflect management or trading fees, and one cannot invest directly in an index. Additional information regarding the construction of these results is available upon request.
Many investors (professional and retail) implement diversification via fixed asset allocations through time. That is, they maintain their percentage allocations to various asset classes via periodic rebalancing. This approach is fairly standard within the investment management industry. However, in some situations I believe the fixed asset allocation approach might be better characterized by risk avoidance than risk management. Indeed, it systematically reduces stock exposures.(2)
This leads to the challenge of how to manage equity risk without having to avoid equities. One answer is to insure the portfolio against market losses via put options. I discuss this and other strategies in the TRH section, but the bottom line is put options are very expensive and this typically results in a net-negative result over the long term (see here for a conversation on this topic). Another option is to step out of the equity markets at times when risks are high. This is known as market timing and is the focus of the following section.
The Painful and Rarely Successful Strategy of Market Timing
It is virtually impossible to pick the absolute tops or bottoms of markets, or as Wes says, “Unicorns don’t exist, and neither do high returns with low risk.” Asset prices are only loosely attached to their underlying fundamentals. There is a myriad of factor influencing this linkage between fundamentals and market prices. Here I discuss how the perceptions and competing interests of different investors result in a layer of noise around market prices and thereby make market forecasting more difficult. I also discuss several practical challenges to implementing marketing timing strategies.
Different Risk Profiles
Every investor has a different perspective and approach to investing. For example, younger investors may be more inclined to own stocks than older investors who have little appetite to risk put their retirement funds at risk. Moreover, every investor has a unique risk profile. Whether it is their natural personality or a particular investment experience (e.g., tech or housing bubble, scam or fraud, etc.), risk profiles are shaped by a variety of factors and can change through time.
Even when investors have similar risk profiles, they may interpret investments differently. There are competing investment philosophies (e.g., active versus passive), different investment and valuation models, and every investor has a unique educational background with respecting to investing. Take evidence-based investing, for example. One might think that investment professionals who are dedicated to analyzing investments and strategies in a scientific manner would arrive at similar conclusions. This is not that case. Different people interpret the same data differently.
Last but not least, emotions and behavioral biases can trump all of the data and analysis in the world. Whether investors are aware of their own tendencies or not, behavioral psychology has now become a major focal point for many investors, investment professionals, and academics due to its significant impact on investors. Given the inherent fickleness of human nature, this inserts yet another layer of detachment between fundamentals and market prices. Emotions are not based on rational thought but impulses and instincts. Accordingly, attempting to predict the emotional component of investor behaviors is tantamount to predicting irrational behaviors. While Dan Ariely (author of Predictably Irrational) might disagree, this is virtually impossible. Investors can change their moods in an instant and this injects additional noise into market prices.
In a nutshell, market prices are subject to a broad spectrum of investor choices that lead to buying and selling decisions. It is virtually impossible to time with great precision when market perceptions or moods will change. For this reason, attempting to forecast the timing of major market turns can be a challenging endeavor.
In Practice
Even if one is reasonably competent in forecasting these seismic shifts in markets, it is still very difficult to successfully benefit from market timing. For example, many portfolios are taxable. So if an investor wishes to reduce exposures to equities, it will likely incur capital gains taxes. The precise amount of tax friction will depend upon the basis or unrealized gains embedded in an equity portfolio. For investors with tax-deferred accounts (e.g., 401K or IRA), this is a non-issue. Taxes aside, there will likely be transaction costs for selling existing positions (and rebuying them or other assets later). Given the low-cost brokerage options investors have today, these costs can be minimized.
A perhaps more important issue with market timing is the emotional toll it can take on an investor. I have already discussed the virtual impossibility of getting the timing perfect. Assuming one has pulled money out of equities, this means there would be a period where markets continue higher but the investor does not participate. This situation can create significant doubt and discomfort (also a potential source of premium). That is, being right but too early can result in the painful feeling of lost opportunity.
Between the challenges involved in profitably executing this type of market timing strategy and the potential emotional discomfort, it is no surprise this practice is frowned upon by many investors and investment professionals. Making wholesale changes to a portfolio is perceived as an aggressive strategy – even if vindicated in the end. Thus it opens up the door to job risk as it requires an advisor to stick their neck out and invest differently. Status quo is much safer (for the advisor).
Tail Risk Hedging (TRH)
Whether one is reducing their equity exposure permanently via a fixed asset allocation or temporarily in the context of market timing, it affects the composition of the overall portfolio. However, TRH (a.k.a. black swan) strategies are typically concentrated within a smaller allocation comprising less than 5% of the overall portfolio. This allows one to retain 95% or more of their standard portfolio exposures. Specifically, this helps avoid the potential emotional rollercoaster associated with wholesale changes to the portfolio (i.e., reducing equity exposure and watching markets go up from the sidelines).
So how can such a small allocation help mitigate risks at the portfolio level? That is the $64,000 question. The obvious answer is that these positions would embed significant leverage to amplify their impact. While this is true, the real value of TRH strategies is derived from the efficiency with which they provide these leveraged upside payoffs. In other words, the cost side of the equation must be minimized relative to the upside. In my view, there are three primary factors driving this efficiency which I discuss below.
Precise Risk Targeting
When it comes to markets, there is a tremendous amount of noise relative to the underlying signal. For example, long-term US stock market returns have been around 10% but volatility has been almost twice as high – averaging just over 20%.
From a TRH perspective, capturing the noise of short-term market movements is not the primary goal. We want to identify and isolate the underlying signal we want to hedge – in this case being a large downside move in the equity market. This would not happen overnight; it would likely take the better part of a year or longer. In terms of tools for hedging, this would translate into options and derivative products with maturities of at least one year.
There are other benefits related to using longer-term derivatives. For starters, multiple short-term options generally cost more than similar long-term options. However, the more important point, in my view, is that longer dated derivatives also embed expectations about the future (e.g., implied volatility). That means we do not necessarily have to capture the entire downside move we are trying to hedge because our positions may capture changes in market perception as well. For example, consider a two-year at-the-money (ATM) put option. If the market started to correct, then we would naturally benefit from the downside move as the option would be further in-the-money (ITM). However, we would also benefit from the increase in implied volatility (higher probability of a larger payoff – assuming the put was not too far ITM).
Another factor in making hedges more precise is to avoid hedging unlikely outcomes. For example, if one thinks a correction of 50% is possible but not 75%, it would be sensible to purchase put options struck around 50% but then sell puts truck around 25% (i.e., strikes as a percentage of current market levels). However, if the intention is for a hedge to benefit from changes in market perception, one should be aware that the derivatives market may place a higher probability on what you view as unlikely outcomes.
Interestingly, derivative pricing models are essentially ignorant of fundamentals. That is, most pricing models are based on market price information (e.g., price and volatility). This can create opportunities (Berkshire Hathaway’s put sale comes to mind) but can also impose challenges in the context of TRH strategies. It is important to be aware of these issues as they can make all the difference when it comes to successfully (profitably!) executing TRH strategies. Otherwise, it is very possible mark-to-market risk can translate into liquidity issues.
Timing
This section could arguably be integrated into the previous section in the sense that timing the strategy is the same as being precise but in the temporal domain. That is, you only hedge tail risk when it is present.
Consider the game of blackjack. If you are a skilled card counter, then you will size your bets according to the odds of winning based on the remaining cards in the deck(s). In the context of markets, you would only execute TRH strategies when markets were vulnerable to significant corrections. In my view, this is when valuations are very high (like now).
The insurance business provides another analogy; it is generally a profitable business. What does this mean for an investor who constantly hedges their portfolios? Underperformance is likely as they are likely paying a premium for the insurance. However, if one is only opportunistically hedging, say, one-third of the time, then this translates into a significant reduction in the cost of insurance.
It is also worth noting the derivatives markets have a tendency to price risk (options and implied volatility) according to trailing observations (realized volatility). That means the cost of hedging often will go up after the risk has surfaced but can be cheap when it is most needed. The bottom line is that it is sensible to only hedge when risk is high.
The Cost of Certainty
Another dimension of hedging relates to how well a hedge must protect against specific risk. For example, a put is a direct and structural hedge for a broad market exposure. In other words, the payoff is formulaic. This leaves minimal, if any, uncertainty with regards to the risk being hedged.
For comparison, consider a hedge whereby one takes a long volatility position instead of purchasing a put. Given that volatility has historically been strongly correlated with market sell-offs, this would likely provide a hedge against market declines. However, the payoff is not formulaically linked to the percentage decline. In fact, it could be possible for a market correction to take place gradually without much volatility. In this scenario, the volatility position would not provide a good hedge whereas the put would have. I view this situation as unlikely and believe the correlation (market declines/volatility) will persist.
In my experience, the demand for puts as the crème de la crème of hedging tools results in a persistent price premium of these options. Accordingly, it may be possible to utilize a robust but not formulaic hedge at a lower cost. One should be careful in using such hedges and ensure their payoffs are very likely to correlate with the risk being hedged. If done sensibly, these probabilistic (i.e., non-formulaic) hedges may be more efficient and thus provide potentially higher upside relative to their costs.
Potential Products for Tail Risk Hedging
Below I provide a brief overview of some of the more popular products that might be used for TRH strategies. I then summarize some of the general differentiating factors between these concepts.(3)
Puts: As discussed above, puts are the most direct hedge for insuring a portfolio against a market crash. There are puts available linked to a variety of popular investment indices (e.g., S&P 500 or Dow Jones Industrial Average) as well as the ETFs that replicate those indices. They are typically available across a wide spectrum of strikes and maturities. More customized puts (e.g., on a particular basket of stocks) are available in the OTC markets.
Delta-hedged options: While purchasing puts and holding them directly hedges against market declines, investors could also delta hedge their long options positions in order to gain long exposure to volatility. Readers interested in learning more about these strategies can read the appendix on volatility trading in my Zombie Market Primer article (blog post and PDF version). This is a strategy that is likely too technical for most investors to implement on their own. However, this is why the industry created products to provide volatility exposures that do not require the hassle of delta hedging.
Volatility products: The Chicago Board Options Exchange (CBOE) has developed a variety of products based on volatility-based payoffs. There are futures which effectively provide linear exposure to the VIX at a future point in time. It is important to understand these products settle to a future value of the VIX which itself embeds future expectations of market volatility. In other words, investors who purchase or sell these futures are speculating on the difference between the current and future level of implied volatility as calculated by the VIX methodology.
There are also futures on realized volatility. Technically, they are realized variance futures (variance = volatility squared). These settle to the difference between the current level of implied variance and the actual realized variance.
Realized variance futures are very different from VIX futures because there are no further expectation baked into realized variance futures when they settle; they are determined precisely by the historical price data of the index. If volatility were to spike right before expiry, it may contribute very little to the payoff since it is just one day of realized volatility. On the other hand, expectations of higher volatility in the future would be captured by VIX futures since they settle to an implied figure (the level of the VIX at settlement) that might reflect expectations for higher volatility in the future based on the recent realized volatility.
The other obvious and important distinction is that variance payoffs can provide much larger upside relative to volatility-based payoffs. However, there are also options available on the VIX which can provide additional leverage. Readers interested in more technical details may refer to my Zombie Market Primer article referenced above or my older but more technical article describing VIX products.
Product Dynamics
The payouts for the above derivative products are all different and offer investors a variety of choices for hedging (or other applications). Each product has advantages and disadvantages depending on one’s goals. It is important to understand both the ultimate payout at expiration and the potential mark-to-market impacts. The latter is critical for the many cases where derivatives positions are not held until expiration.
In most hedging applications, the value of the hedges decays through time unless the market declines or the potential for a decline has increased. The rate of decay is linked to the amount of time until the expiration and the potential upside for the payout. More time means more things could happen (i.e., more time for risk to surface). This generally translates into more expensive hedges (e.g., 1-year put versus 1-month put).
Intuitively, one might think of risk as scaling with the square root of time. If you look at the price of one-year versus 4-year ATM puts, you will likely see the latter is approximately twice the price of the former (square root of 4 equal 2). I am leaving out some details (forward versus spot ATM, volatility surfaces, money-ness, etc.), but this is a fair characterization of risk scaling. Indeed, if you look at most derivatives pricing formulae, you will see volatility parameters followed by the square root of time (e.g., or ).
While longer expirations may be more expensive on an absolute basis, they are typically cheaper to carry. This is because each day that passes is relatively less impactful for longer expiration products. This should be evident just by observing the single day passing as the percentage of time that is lost. However, it is deeper than that. If you assume risk scales with the square root of time and plot it on a chart with time on the x-axis, then you will see how the curve accelerates toward zero when moving from left to right. Technical details aside, the bottom line is that longer expiration derivatives can be cheaper to hold. This is a critical consideration when executing TRH strategies and balancing potential upside with costs to get the most bang for your buck.
Example: Consider the scenario where I hedge with 1-year ATM put options on the SPY ETF but roll it every six months (i.e., when the 1-year option has become a 6-month option). Moreover, let us assume markets uneventfully move sideways over the six months. Based on my rudimentary risk scaling approximation above, this 1-year ATM put option will lose approximately 30% of its value of those six months (square root of one minus square root of 0.5). Looking at current pricing (as of 2:52pm EST September 7, 2017), mid-market prices for approximately 1-year and 6-month ATM puts are $14.27 and $9.05, respectively. This indicates a decay of 37% in the price of the option over those six months. This is not exactly the 30% I estimated, but in the right ballpark.
On the flip side, we can use a similar approximation to figure out what the breakeven for volatility would be in such a scenario. That is, in order to compensate for the loss in time value, how much higher would volatility have to go to breakeven? The current implied volatility for the 1-year ATM put option is approximately 15%. All else equal, the 37% loss due to time decay would require volatility to increase by a factor of 1.59x (1 ÷ 63%) to just about 24% for breakeven. However, all else is not equal. If volatility were to rise significantly, it would very likely involve a market decline which would further increase the value of the put option. Accordingly, the 24% breakeven for implied volatility is a very conservative (high) estimate.
The Big Short: A Comparison
In my view, equity derivatives markets can offer compelling opportunities for TRH strategies. For a variety of reasons I have highlighted in previous articles, investors have elevated valuations for US equities. In my view, this alone provides an impetus to look at risk management or hedging strategies. However, the cost of hedging has also been artificially dampened due to the popularity and self-perpetuating nature of low- and short-volatility strategies.
For example, mid-market pricing currently implies the probability of a 50% collapse over the next year and half is about 3%. If one purchased the appropriate options at these prices and this (50% correction) occurred, investors speculating on this collapse would turn $3 into $100 – a multiple of 33x their original investment. However, mid-market pricing is not likely. Bid-ask spreads have widened since August of last year (when this article was originally published) and the cost of executing across the bid-ask spreads is approximately double. So this would cut the upside potential in half. Suffice to say, execution is key for strategies involving less liquid instruments.
Notwithstanding execution issues, speculating specifically on a 50% decline is a risky proposition. Indeed, a decline of 49% might result in a zero payoff. Moreover, many TRH strategies would likely decay significantly before they paid off. So the payoff multiple might be applied to a smaller capital base (original investment minus time decay). In practice, payoffs could be higher or lower (and possibly a loss) depending upon the TRH strategy employed. On balance, even when taking decay and other variables into account, I believe tail risk is still underestimated by many derivative products and attractive opportunities are available where returns are better measured in multiples rather than percent.
Having said this, I do not believe the TRH opportunities highlighted above are as attractive as those found in the credit (derivative) markets prior to the credit crisis fully exploded. At the time, one could purchase credit default swaps on various investment grade collateralized debt obligation (CDO) tranches for less than 50 bps per year where that price was fixed for five years. In other words, you could have risked $0.50 a year to earn $100 (if the CDO tranche went to zero) over a five-year period. While there could be some decay and mark-to-market risk, the potential payoff could be as high as 200x the original investment ($0.50 turning into $100). Even if it took five years and the value of the tranche only fell by 50% (i.e., a recovery rate of 50%), you still would have reaped a payoff multiple of 20x ($50 payoff ÷ $2.50 investment). In reality, the value of many CDO tranches did go to zero and the cost of protection was actually closer to $0.30 than $0.50 making for potential payout multiples as high as 333x.
The above multiples only refer to the ultimate payout. As mentioned above, it is also important to consider the mark-to-market perspective many investors experience. Investors who viewed these strategies through the same prism they would use for most other investments were probably extremely uncomfortable. Indeed, observing a hedge fund decline by 10-20% typically earns the investment managers a few phone calls and meetings to explain the underperformance. However, with these CDO strategies, even 2-3 basis point changes in the CDS pricing could easily result in swings of greater than 20% depending upon the leverage employed. This is one reason it is important to understand the dynamics of TRH strategies and avoid getting caught off-guard. This mark-to-market pain was depicted by many of the hedge funds shorting CDOs in The Big Short (both the book and the movie).
In a previous article (post here and PDF version) I highlighted multiple parallels between our current situation and other periods of market distortion stemming from price-insensitive strategies (e.g., the housing bubble and CPPI strategies). The bottom line is that it is very dangerous to pursue superficial investment strategies based on their historical performance. Just as structured credit products wreaked havoc on the credit markets and CPPI strategies culminated in Black Monday (-20% in a day!), passive and other price-insensitive strategies may be increasing the risk in the stock market while at the same time pushing down the prices of products and strategies to hedge the risk.
Conclusions(4)
This article first highlighted the potential utility of TRH strategies versus traditional approaches to portfolio risk management (e.g., fixed asset allocations). I then discussed the factors I believe are critical to successfully executing TRH strategies. Lastly, I compared the current opportunities with those that were available in the period leading up to the credit crisis.
I believe the historical performance and low price tags of passive strategies have attracted record magnitudes of assets and presumably been a major driver of the higher valuations. Moreover, the current popularity of short-volatility strategies are likely making TRH strategies cheaper to execute. In other words, I believe it is not only a good time to hedge, but the cost of hedging has been artificially dampened. On balance, I believe TRH strategies currently provide investors with attractive opportunities. Indeed, even those without equity risk exposure (e.g., total return investors or those who simply like asymmetric bets in their favor) may find TRH strategies compelling. I do not, however, believe these opportunities are as attractive as those available in the credit derivatives markets leading up to the collapse of the housing bubble.
TRH strategies are very complex and will often end up with polarized results. As highlighted in the disclaimer above, it is important to understand these strategies are speculative in nature. In particular, their success depends on the behavior of market prices – not fundamentals. Even if a strategy will ultimately be profitable, mark-to-market risks can make the experience painful and may result in investors abandoning the strategy at the wrong time. While I did not discuss it within this article, taxes are also relevant. Indeed, gains on many TRH strategies will be realized and thus trigger capital gains (sometimes short-term) taxes where applicable.
Accordingly, I believe it is important for investors to understand the challenges involved with these strategies before executing them. Even then, I recommend limiting allocations to these strategies. In general, I would allocate no more than 5% of one’s overall portfolio or 10% of one’s equity allocation to TRH strategies.
- The views and opinions expressed herein are those of the author and do not necessarily reflect the views of Alpha Architect, its affiliates or its employees. Our full disclosures are available here. Definitions of common statistics used in our analysis are available here (towards the bottom).
- Join thousands of other readers and subscribe to our blog.
- This site provides NO information on our value ETFs or our momentum ETFs. Please refer to this site.
References
Disclaimer: This article discusses unconventional strategies that are not suitable for most investors. Please consult a financial professional with specific expertise in tail hedging and derivatives if you are considering this or related strategies.
Here is a good article on static versus dynamic asset allocation systems.
Note: I mostly highlight listed equity derivatives here as they are the most popular and accessible products for most investors. In particular, I do not look at hedging products based on other assets classes nor focus deeply on products trading in over-the-counter (OTC) markets.
Disclaimer: This article discusses unconventional strategies that are not suitable for most investors. Please consult a financial professional with specific expertise in tail hedging and derivatives if you are considering this or related strategies.
The post "Tail Risk Hedging: An Alternative Approach To Risk Management" appeared first on Alpha Architect.


