Highlights
- Despite the new threat of a U.S.-China trade war, we are adding to existing positions and swapping into new investment ideas
- Our small collection of carefully-chosen companies looks priced for double-digits returns over the next few years
- While broad stock markets look expensive to us, they’re not outrageously so
- We think value stocks will outperform growth stocks over the next decade, which should further bolster our value-oriented approach
- The widespread deterioration in data that has historically preceded sustained, multi-year stock market declines hasn’t yet occurred
- Credit markets aren’t showing signs of significant stress
- The banking sector is stronger than it’s been in decades
- Key sectors of the economy, like housing, are still operating below potential
- Corporate profits are growing, and operating margins haven’t hit excessive, unsustainable levels

Q1 hedge fund letters, conference, scoops etc
The S&P 500 is down over 10.0% from all-time-highs, which has brought with it the obligatory chatter of an imminent recession and devastating bear markets in both stocks and bonds.
This market cycle is no stranger to potentially bear market-inducing risks and events. Panicky selling and calls of a new bear market accompanied the 2010 flash crash, the 2011 U.S. credit rating downgrade, 2012’s “double-dip” recession and sovereign debt fears, as well as the 2015 Greek default and Chinese bear market. A U.S.-China trade war is the latest risk.
The spat between the U.S. and China has certainly escalated over the last few days. It started slow. In January, the Trump Administration announced tariffs on imports of solar panels and washing machines. In March, it next targeted imported steel and aluminum. But the trade dispute picked up speed this week.
China responded this Monday with $3 billion in tariffs on U.S. goods. Tuesday morning, the Trump Administration announced $50 billion of proposed China-specific tariffs. By Tuesday afternoon, China retaliated with its own $50 billion of tariffs on U.S. products.
While it’s true an all-out trade war could wreak havoc on global trade and roil world financial markets, it’s yet to be seen if anything comes of the political rhetoric and jockeying. The possibility of havoc was also characteristic to the other market scares this cycle has seen, and yet it would have been a mistake to sell based on mere possibilities. We think it’s likewise premature to sell stocks today, let alone panic.
The combined $100 billion of goods at risk of new tariffs represent less than 2% of U.S. trade and about 0.50% of U.S. GDP. In that context, it’s probably digestible as the U.S. economy looks poised to accelerate in the short-term due to newly enacted tax policy. However, it’s how companies might respond that could create more material effect, including changing investment, hiring, and other long-term plans.
There is reason to be hopeful that this can be resolved with muted impact, allowing President Trump to claim he met a campaign promise, while the Chinese can claim to have held their ground. U.S. companies have until May 22 to comment and to raise objections to the White House’s proposed tariffs, so the amounts can still be scaled back. The Chinese have offered no start date on their own tariffs and seem to be taking a wait and see approach.
The U.S. has mid-term elections this November, and most polling suggests widespread gains on the part of Democrats, including them winning back the House. Republicans are already fighting an uphill battle, and market turmoil easily laid at the feet of the Trump Administration’s trade policy only makes matters worse for them. The President has frequently touted the stock market’s ascent as evidence of his policy success, so this decline might offer some effect.
Should we sell or hedge? In our view, there’s not enough hard data yet to make an informed decision to shift positioning, and there are a good many reasons to remain constructive, despite the heightened political uncertainty the White House is bringing.
At present, we are using this decline to enhance our portfolios by adding to existing positions and by swapping into new investment ideas.
The Summary of Our Present View
We like what we own. Our collection of durable businesses trade at prices we think will reward us as long-term shareholders. While broad stock markets look pricy, we think value stocks will outperform over the next decade, and that will only bolster our value-oriented approach. We believe we have the right portfolio and expect the winds to be at our backs in the years ahead.
A bear market would certainly be a setback, but we suspect any downturn today would prove mild compared to prior recession-driven declines, because we’re not overproducing cars, houses, and durable goods like we were at the start of past economic downturns. Plus, the banking sector is arguably stronger than it’s been in the last 30+ years, so a banking crisis isn’t likely.
That leaves us to contend with exogenous risks like a U.S. and China trade war. These risks are hard to manage against, especially when political rhetoric isn’t often followed by action. For now, we’ll follow political activities while continuing to listen to company conference calls and looking for any change in the incoming data that would suggest the ground is moving under our feet. If calmer heads prevail and there isn’t a significant trade war, which is our base case, we think earnings over the next couple of years will come in quite strong, and that should buoy stock markets and our companies’ share prices.
In the end, an investor is either disciplined, or they’re not. An investor has a process, or they don’t. But being disciplined, i.e. having a repeatable process, does not mean that the process will work all the time. An investor might follow their process to the letter, and yet still be wrong now and then. Conversely, an investor without a process might be right from time to time.
There are many investors selling stocks today without data to support their decision. While that could end up being the “right” outcome, one positive outcome isn’t indicative of a consistent or repeatable process. We’ve built our process on data, logic, and evidence, the antithesis of emotional investing.
We aren’t selling stocks today. We’re buying more–because we trust our process and the drivers behind it. We continue to move forward, using data with a historical basis to support our investment decision-making. Tomorrow might bring new or additional information, and thus our views and positioning are subject to change. But our process remains.
Below we provide the details underlying our present view.
We Think Our Portfolio Is Priced for Double-Digit Returns
Today we own a portfolio of 18 individual companies that we think are priced in aggregate to return over 15% per year for the next few years. We would much rather own our securities than that of the S&P 500, and the stats back that up. Our portfolio trades for a lower valuation and yet delivers better returns on capital.
Table 1: Black Cypress vs. the S&P 500
Source: S&P; Black Cypress Capital Management
We know our companies well, and our double-digit return expectation doesn’t require a heroic effort on the part of the underlying management teams. We’ve built a portfolio full of asymmetric return opportunities.
Consider our position in Baker Hughes GE (BHGE). BHGE is the diversified energy services namesake of General Electric (which contributed GE Energy) and Baker Hughes. The company is struggling within a still tough energy market, while its parent company is one of the most out-of-favor stocks. Management has laid out synergy targets for the combined entity, which would be icing on the cake should oil and gas E&P spending merely improve. But there’s little positivity baked into the stock price.
If BHGE fails to live up to one iota of management’s synergy targets, if revenue fails to ever grow again after shrinking 45% from the combined-entities’ peaks of 2014, and if operating margins settle at 11%, which is below prior averages and well below peers, you’d likely have a return between slightly negative to slightly positive at today’s price of $27.50. And this would be an absolutely atrocious scenario for the company and the energy service industry, and yet you aren’t at risk to lose much. BHGE is likely free cash flow positive, even after its dividends, at a 15% EBITDA margin, and we think the company can get to 20%+ margins by 2020.
Conversely, what happens if business improves for BHGE and its industry over the next few years? Revenue is likely to grow at least 6% per year, margins should expand in both legacy GE Energy and legacy Baker Hughes, and management should be able to capture at least some of its revenue and cost synergy targets. The company is buying back shares under a $3 billion plan (8% of shares outstanding) and has a solid balance sheet with little net debt. We think it will be a mid-$40s stock and a 20%+ per year return over the next few years under a fairly conservative scenario.
If energy markets essentially never recover and BHGE languishes, you don’t lose much. If management can improve the combined entity and capitalize on the higher energy spending likely to occur over the next 3 to 5 years, you could make 20% per year. Or you could hold bonds and cash and make 2%. Our portfolio is filled with these kinds of return asymmetries.
Broad Markets Valuations Are High, but Not Outrageous
Today, the trailing P/E multiple for the S&P 500 is just north of 22 times reported earnings. That’s significantly higher than the historical average of 18 times. However, US corporate tax rates will drop significantly in 2018, and most of those savings should fall to the bottom line. Because markets have declined over 10%, forward P/Es are now about 17x. That’s still above the historical average of between 16 and 17 times forward estimates, but it isn’t outrageously so.
We think a conservative fair valuation for the S&P 500 is somewhere around 2,300. That’s based on average operating margins, still low interest costs, and a new lower corporate tax rate that drives $128 per share of reported earnings. An 18x multiple on $128 gets an S&P 500 price of 2,300, about 11% lower than today’s quote of 2,582.
Table 2: Fair Value of the S&P 500
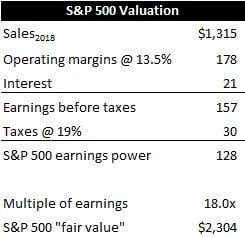
Source: S&P; Black Cypress Capital Management
Why do we bother analyzing the underlying characteristics and return potential of the 500-company-strong S&P 500 when we own just 18 companies? One, because the direction of the stock market acts like gravity on our portfolio, particularly over shorter time spans. And two, because we think it’s best to have a risk management program backed by data, as opposed to emotion. There’s a long history of upward progress of stock markets–fortunately so–and thus we think it’s foolish to fight against that positive bias outside of excessive overvaluation and heightened late-cycle recession risk. We see neither today.
We Think Value Stocks Are Poised to Outperform Growth Stocks
For over a decade, “growth” stocks have outperformed “value” stocks. There have been only two other occasions in the last 100 years of a ten-year span of growth stock outperformance. After both of those instances, value substantially outperformed growth. While we’re not a low P/E, low P/B investor, we are value-oriented, and a value stock resurgence would put the wind at our backs for the first time in ten years.
Figure 1: Value Stocks Look Poised to Outperform
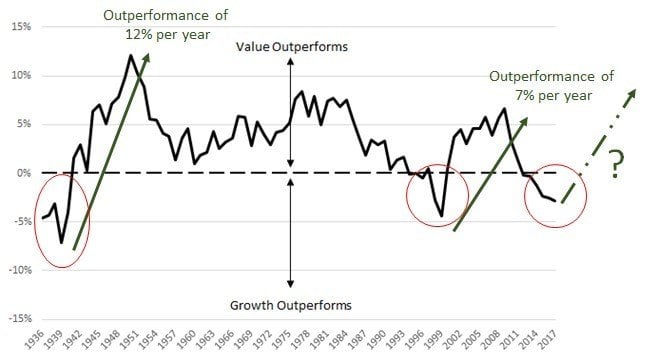
Source: Dr. Kenneth R. French Data Library; Russell Indices; Black Cypress Capital Management
Recessions Have Caused Bear Markets, and We Don’t See Signs of One in the Data
Our investment views are implemented through security selection. Companies do not operate in a vacuum but within the economic realm. Thus, we study the economy to protect against pronounced sector imbalances (housing circa 2006), unsustainability (peak margins), and potential inflection points in the business cycle. Plus, recessions have historically been the typical cause of bear markets in stocks.
By our research and analysis, the probability of a U.S. recession in the next 12 to 18 months is low. Of course, this excludes any guesswork around potential exogenous risks.
Below is our Recession Diffusion Index (RDI), one of the three economic models that we built to better understand the business cycle risks underlying our investment decisions. With current data, our RDI reflects small risk of recession. That can certainly change, but it depends on new incoming data.
Figure 2: Recession Risk Looks Low for Now
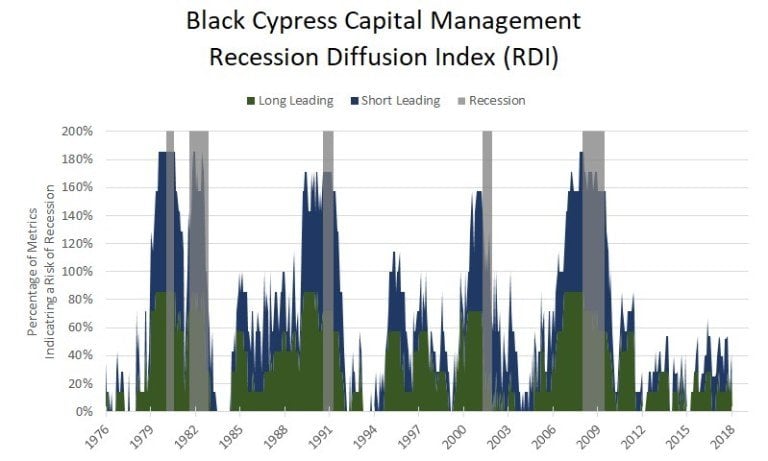
Source: Black Cypress Capital Management
Credit Markets Remain Calm
While stock markets have fallen in a panicky fashion, corporate bond markets have shown little sign of stress. Interest rates on high yield debt have risen 1.01% off cycle lows, but 10-year Treasury yields are up 1.34%. Investment grade bond credit spreads are up a whopping 22 basis points from the cycle low made in January of this year. And while high yield (junk) spreads are up 42 basis points from their cycle low, they’re still lower than basically any time this cycle prior to August 2017. Commercial paper market spreads remain narrow, as does the TED spread.
The Financial Sector Is Stronger Than It’s Been in Decades
The top seven banks all have better leverage ratios today than they had in 2006. In our opinion, banks today have too much capital–and they’re returning it to shareholders. Loan quality is vastly superior today than it has been over the last couple of decades, and there isn’t a bubble in housing or another asset-backed loan market to distort loan portfolios and bank balance sheets. Loan officer surveys show that lenders are easing standards, i.e., lending more freely to borrowers. That’s positive for future economic growth.
Key Sectors of the Economy Are Still Operating Below Potential
Despite a 9-year expansion, there’s still slack in the U.S. economy. Single-family housing construction remains 35% below the average of long-term units permitted, and residential investment as a share of GDP is at levels that have historically coincided with downturns, not expansions or peaks. Light vehicle sales are below average, and vehicle inventories are down over 20% year-over-year. Core cap ex orders are 17% below long-term averages.
Based on that, there is still plenty of room for the economy to grow. In the meantime, slack like this helps dampen inflation, which should support the Fed’s intent to raise rates slowly and over time. And even if there were a recession, it would very likely be mild compared to past ones, which started with production and spending significantly above long-term averages, as opposed to today, with key sectors of the economy still operating below prior averages.
Table 3: There’s Still Slack in the U.S. Economy
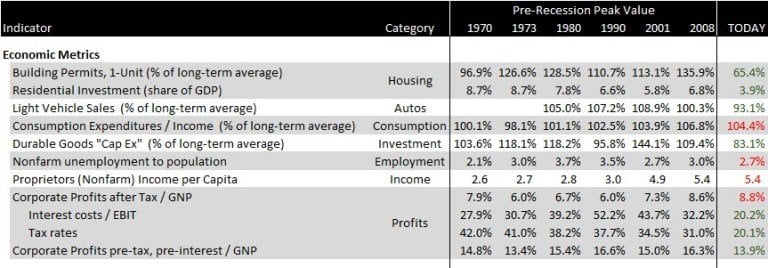
Source: Black Cypress Capital Management
Corporate Operating Profit Margins Are Average
As we’ve shown in several past articles, pre-tax, pre-interest “operating” margins for the corporate sector are merely average. Just look at Table 3 above. While corporate net profit margins are at all-time highs (8.8%), that’s due to low interest costs and declining tax rates (set to fall further), and not to unsustainably high corporate operating profitability (currently 13.9%, in line with historical averages). In the past, corporate profits have peaked well before a recession, and this year, they’re about to make new highs.
Article by Alan Hartley, CFA - Black Cypress Capital Management


