Boyar Value Group commentary for the first quarter ended March 31, 2018; titled, “.”A Look Back

Q1 hedge fund letters, conference, scoops etc
Although the S&P 500 started out 2018 by continuing its steady upward climb, that trend ended abruptly in late January and early February, when it declined by over 10% in just nine trading days. On February 8th, the index officially entered correction territory for the first time in two years (a stock market correction is defined as a decline of 10% from the market’s previous high).
Pundits blamed the pullback on the potential of both rising interest rates and inflation (as well as a host of other reasons). Despite the S&P 500 partially recovering from its February lows, it still ended the quarter in the red despite being up over 6% at one point in January. All sectors, except technology and consumer discretionary, declined for the quarter.
In early February, during the height of the sell-off, investors withdrew $22.9 billion from U.S. stock funds, according to EPFR Global. Whether these investors reentered the market in time for the subsequent rebound is impossible to ascertain, but knowing investor psychology, we highly doubt it.
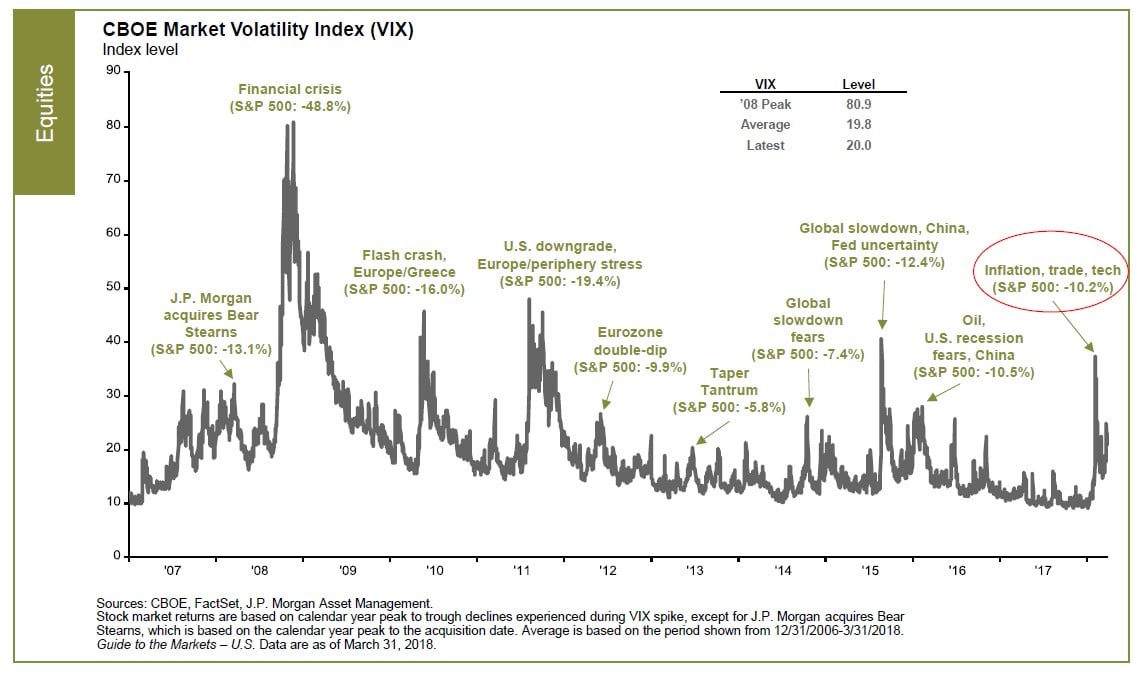
Prior to the first quarter, the stock market has been devoid of volatility. At one point, the S&P 500 had 404 consecutive trading days without a 5% correction: the longest such streak since 1959, according to Bianco Research. Many investors seized on this trend and made bets that the low volatility environment would continue unchecked. This trade was quite profitable and lulled market participants into a false sense of security. However, the sudden rise in volatility that began in early February caught many investors flatfooted and caused such massive losses that some funds were forced to close.
The ProShares Short VIX Fund, which investors purchase to wager against a rise in volatility, at one point declined by 97% from its high the previous month. In addition, Credit Suisse shut down a volatility-linked fund after it lost most of its value in a single trading session. Before imploding, this fund had increased by 585% over the past two years!
We believe that the sudden spike in volatility was exacerbated by the rise of certain types of passive investment strategies. After propelling the market to historic highs, these strategies (which follow a set of rules enacted by sophisticated computer programs with no human intervention) led the market downward during the first quarter of 2018. Passive strategies in aggregate, which include both the aforementioned strategies as well as plain vanilla index funds, now own close to 40% of U.S. stocks, according to research by Bank of America Merrill Lynch. This new investment landscape may bring with it increased volatility going forward.
Since 2009, ETFs and index funds have pumped trillions of dollars into the stock market. Although it is impossible to say how much these inflows contributed to the outperformance of passive versus active managers, it was likely a sizable amount. Logic would dictate that when investors choose to exit these investments, the major indices will be adversely affected. Perhaps we are entering an environment when good old-fashioned stock picking will outperform the major averages for a prolonged period; only time will tell.
Some Thoughts About the Market
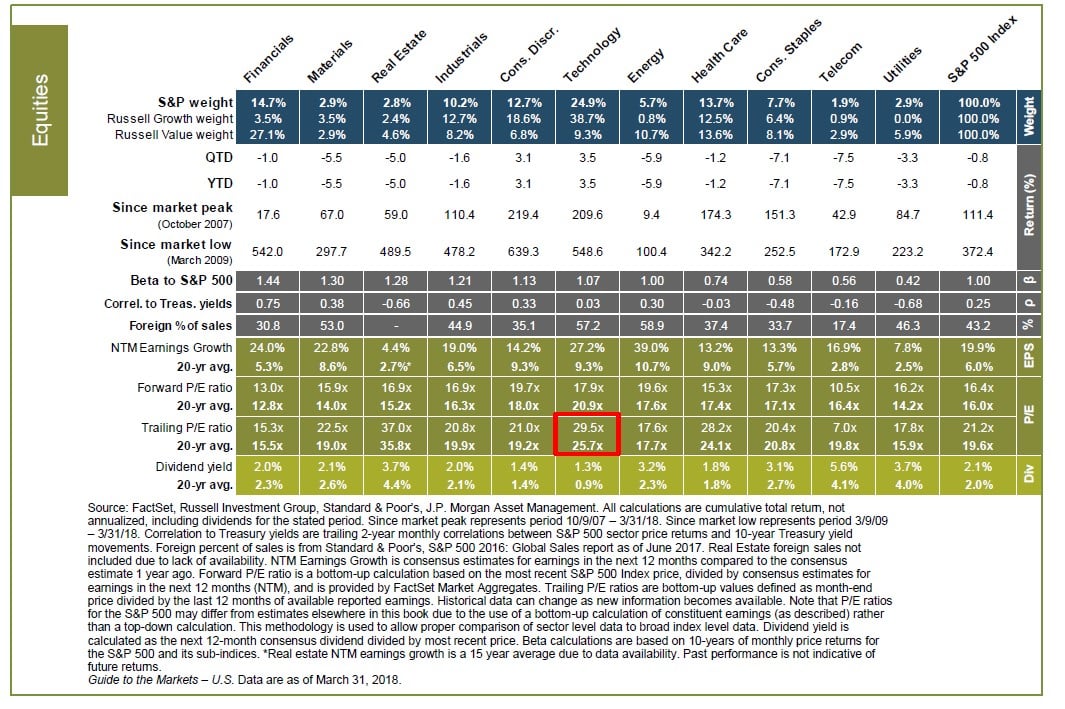
The technology sector represents ~25% of the S&P 500, its highest weighting since just months before the bursting of the dotcom bubble. The valuations for the sector at 29.5x trailing earnings (their 20-year average is 25.7x) are much lower now than they were then. However, the technology sector sells at a significantly higher multiple than the S&P 500, which, as of the end of the first quarter, sported a 21.2x trailing P/E ratio. Technology shares’ elevated valuations, coupled with their large weightings in the index, will most likely prove to be a performance headwind in the not-so-distant future.
Although it would be premature to proclaim that the market leadership has changed from a largely technology-fueled rally, we are seeing preliminary signs that the leadership may be starting to rotate. The FAANG stocks shed more than $200 billion in market value from mid-March to mid-April. In addition, as of April 23rd, the technology heavy NASDAQ Composite has underperformed the S&P 500 by 1.35% over the past month.
As we mentioned in our last quarterly letter, which is worth repeating below:
During our respective investment careers (which, for one of us, has been for almost half a century), we have learned that when a particular investment style has caught the attention of a large group of market participants by capturing outsized gains, investors should exercise extreme caution. For example, during the 1960s and 70s, a group of stocks, affectionately dubbed the “nifty fifty,” were in high demand. Companies like Polaroid and Xerox were considered one-decision stocks—in other words, investors could buy them and hold them forever—because they would be able to grow earnings regardless of economic conditions. The valuations of these companies soared; in fact, Polaroid was the first major company to command a P/E multiple of 100.
When the U.S. economy entered a severe recession in the early- to mid-1970s, the nifty fifty’s profit growth faltered, and these stocks lost, on average, ~75% of their value. In addition, at the height of the dotcom mania, value-oriented investors were considered to be dinosaurs and underperformed the market for several years. However, they were eventually vindicated when the vast majority of dotcom companies crashed and burned, causing the tech-heavy NASDAQ to lose almost 80% of its value after peaking in March of 2000. In the era following the dotcom implosion, value investing once again regained its luster and handily beat growth stocks for a prolonged period of time. We are confident this will eventually reoccur; we just cannot accurately predict the timing.
Potential Problems in Corporate Debt?
Many of America’s best-known firms have taken advantage of the prolonged low interest rate environment to load up on cheap debt. Some have used this cash wisely to invest in their business (or purchase other businesses at reasonable prices) to help generate future growth. Some have used the debt proceeds to buy back their shares at attractive prices. However, others have used them for less profitable pursuits such as ill-advised acquisitions or buying back their shares at undesirable prices.
Many of these organizations, prior to their debt binge, had highly rated corporate debt. However, according to an article that appeared in The Wall Street Journal written by Ben Eisen & Sam Goldfarb, many of these companies are now rated BBB, which is a notch above junk status. Outstanding U.S. debt, rated BBB, currently amounts to $2.2 trillion according to Morgan Stanley (up from only $686 billion only a decade ago). BBB-rated bonds now account for 50% of the investment-grade corporate debt market.
So, why should equity investors be concerned? It appears as if we are entering a rising interest rate environment, and the amount of maturing investment-grade bonds is set to double in the next two to three years according to Bank of America (this includes investment grade bonds other than BBB). If the economic backdrop becomes negative, these firms could have trouble refinancing their debt or, at a minimum, have to pay significantly more in interest expenses. Either scenario would have a negative impact on the common shares of these businesses. This is something certainly worth monitoring.
Elevated Margin Loans: A Potential Warning Sign?
William Shakespeare is credited with writing “neither a borrower nor a lender be.” Perhaps investors should heed the Bard’s advice. According to an article written in The Wall Street Journal on February 25th by Michael Wursthorn and Chelsey Dulaney, U.S. investors currently have borrowings of $642 billion against their stock portfolios. According to Goldman Sachs, the amount of money on margin was worth 1.31% of the total value of all stocks on the New York Stock Exchange. The previous peak was 1.27%, which occurred prior to the tech bubble bursting in 2000.
When an investor accepts a margin loan, they borrow money from their broker and pledge the stocks in their account as collateral. If the stocks in their portfolio decline significantly, the broker gives the investor a margin call; if the investor does not quickly post additional collateral, the broker will sell the investor’s pledged shares to ensure they will be repaid.
Margin loans are excellent for investors in an upward-moving stock market because gains in their stock portfolio are magnified by the magic of leverage. However, leverage cuts both ways, and during periods of extreme volatility or a bear market, it can cause investors to sell shares at the worst possible time. While we are not predicting the end of the bull run, investors should be highly cautious of leveraging their investments. In addition, the fact that margin loans are at an all-time high is concerning because, historically, a high level of margin debt has been a terrific contraindicator of future stock market performance.
Bitcoin Had its Worst First Quarter in History
Last November, when Bitcoin hit ~$20,000, everyone was talking about it and had Bitcoin envy. So, when you look at your stock portfolio and bemoan your modest stock market loss for the quarter, think about how lucky you are for not buying Bitcoin. The currency fell from $13,412.44 to $6,928.85 for the three months ending March 31, a decline of 48%, according to industry website CoinDesk.
Should you have any questions, we are always available.
Best regards,
Mark A. Boyar
Jonathan I. Boyar
Below please find excerpts from articles we thought you would find to be interesting.
Can Big Tech Stocks Grow Without Limits?
At their lows this week, the technology shares that have until recently been the stock market’s darlings — Facebook, Amazon.com, Netflix, Google’s parent company Alphabet and other giants — had fallen more than 17% since March 13. Over the same period, U.S. stocks overall fell 8%.
At first, the drop in big tech stocks seems driven by bad news that is bound to worsen: Facebook improperly sharing personal data, President Trump criticizing Amazon, European regulators investigating potential antitrust violations.
Or could this just be a stumble? Have big tech companies developed an unstoppable business model?... Traditionally, the bigger companies have gotten, the harder it has become for them to keep growing at the same rate. For today’s leading innovators, however, growing might not have to mean slowing. Unfettered by the costs of raw materials or the burdens of manufacturing, distribution and advertising, these companies plan decades ahead, rather than fixate on hitting Wall Street’s quarterly earnings targets.
Consider Amazon. Over the three years ending Dec. 31, 2011, its revenues more than doubled, to $48 billion. Over the next three years, its sales nearly doubled again, to $89 billion. Then, over the three years ending Dec. 31, 2017, Amazon’s revenues doubled yet again, to $178 billion.
Investors don’t know exactly how to price such rapid growth. Although the cash Amazon generated from operations grew more than tenfold from 2008 through 2017, the company plowed most of it back into expanding the business. So net income grew only less than fivefold, with enormous fluctuations along the way.
James Anderson, head of global equities at Baillie Gifford & Co. in Edinburgh, thinks Amazon, along with some other giants including Chinese firms Alibaba Group Holding and Tencent Holdings, “live in a permanent state of revolution.” They have “a profound distrust of the idea that scale has to impinge on a business’s ability to grow and keep disrupting…”
Of course, history also suggests that every firm that was expected to dominate indefinitely — from RCA in the 1920s to IBM in the 1980s to Nokia in the 1990s — has ended up slipping. And the idea of virtually limitless growth flies in the face of much of human experience. Trees can’t grow to the sky because they would be bent and crushed under their own weight first…
The twin beliefs that high-fliers must fall to earth and that underappreciated stocks should rise again are at the heart of value investing. It’s conceivable that those principles may be less relevant today, when powerful technology companies can pulverize entire industries.
In a classic article, “Growth Stocks and the St. Petersburg Paradox,” finance scholar David Durand warned that at ultra-high growth rates over long horizons, even slight shortfalls lead to enormous differences in end results. That makes the shares of such companies extraordinarily volatile.With Amazon and Netflix trading at more than 200 times their net profits, and many of the other new tech giants at more than 40 times earnings, they aren’t exempt from that iron law.
It’s impossible to know for sure whether companies like Amazon have broken free from the traditional limits to growth. Unless you can hold them for a decade or more, as Mr. Anderson likes to, you probably will get shaken out before you can even find out. —Excerpt from an article that appeared in the Wall Street Journal on April 6th, 2018 by Jason Zweig
The So-Called Smart Money Has Started to Sell at the End of the Trading Day, a Bad Sign for This Bull Market
The so-called smart money has recently started to bail on the stock market at the end of the trading day, a leading indicator the bull run may be over.
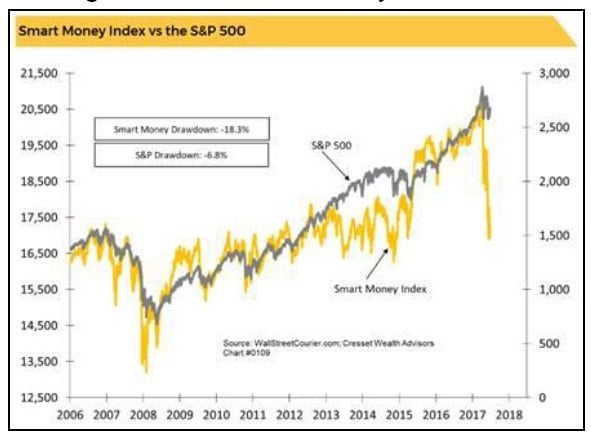
Jack Ablin, chief investment officer at Cresset Wealth, explains: The Smart Money Index (SMI) takes the first half hour of trading, which is dominated by retail investors ('dumb money'), reverses its sign and adds it to the last half hour of trading, which is typically dominated by institutional investors ('smart money').
The index is down more than 18 percent since hitting an all-time high in January, according to Ablin. The S&P 500, meanwhile, is down just 5.5 percent since reaching a record on Jan. 26, suggesting it may have further to fall to catch up with this leading indicator.
"The Smart Money Index turned downward as early as June 2008, long before the September market swoon, and bottomed in October of that year, five months before the S&P rebounded," added the strategist…
To be sure, in this age of sophisticated computer trading with large funds spreading orders out throughout the day using algorithms, this indicator's predictive ability may not be the same as it once was.
And Ablin does not believe you should base your whole market forecast on it. The indicator is "better characterized a spice rather than a key ingredient in the outlook mix," he wrote.
—Excerpt from CNBC.com written by Fred Imbert April 18, 2018
What It Takes to Build a $100 Million Art Collection
A hundred years ago this week, the most influential economist of the 20th century began assembling what became one of the best collections of modern art then in private hands.
Every investor hoping to diversify a conventional portfolio with nontraditional assets can learn from the collecting career of John Maynard Keynes (1883-1946) …
The returns on so-called emotional assets aren’t directly comparable to those on financial assets: Dealers, auction houses and private transactions can price the same work of art at drastically divergent prices. Commissions and markups can exceed 20% — often by a lot.
So, three leading finance professors, David Chambers and Elroy Dimson of Judge Business School at Cambridge University and Christophe Spaenjers of HEC Paris, have done a service by analyzing the financial returns of Keynes’s art collection over the past century.
In his three decades of collecting, Keynes paid a total of £12,847 for his holdings, roughly £600,000 ($840,000) today when adjusted for inflation. Based on appraisals in 2013 by five independent experts, Keynes’s collection is worth more than £70.9 million, or $99 million.
That’s an average return of 10.9% annually, barely a tenth of a percentage point below the return on British stocks over the same period. Beneath that spectacular return lie several important lessons…
Of the 135 works in Keynes’s collection, two account for more than half its total value and 10 constitute 91%. Simulating 1,000 randomly chosen art portfolios sold at auction from 1980 through 2015, Profs. Chambers, Dimson and Spaenjers found their returns varied wildly, with most of them severely underperforming the stock market.
For investors in art and stocks alike, all this shows how important it is not to put all your eggs in one basket — in case the basket you pick turns out to be the wrong one. Only by diversifying can you be sure of ending up holding winners…
Still, the history of Keynes’s collection shows the importance of luck. He assembled much of his art in 1918-19 and again in the 1930s. Keynes thus had rare opportunities, as the investing proverb goes, to “buy when blood is in the streets.”
Unlike stocks, whose prices don’t vary significantly depending on where they trade, art doesn’t sell on centralized exchanges. “In illiquid asset markets, like that for art, you may be able to buy an asset cheaply if you’re lucky,” says Prof. Spaenjers — for example, at a sparsely attended auction.
In 1918, with German artillery shells shaking Paris, Keynes attended the auction of the estate of the artist Edgar Degas and bought a Cézanne still life for £370.50. To put that price in perspective, a Rolls-Royce Silver Ghost cost roughly £1,200 to £1,450 around the same time, according to Amii Errington, archivist at the International Club for Rolls-Royce & Bentley Enthusiasts…
For all his advantages of expert advice and uncanny fortune, even Keynes — one of the shrewdest investors of the 20th century — ended up with a collection in which most of the artworks barely went up in value at all.
To be realistic, investors in art should recognize the importance of luck and the risk that, in the end, the psychic return is the only thing they can count on.
Excerpt from an article that appeared in the Wall Street Journal on March 30th, 2018 by Jason Zweig
In the interview Chris Mayer, author of 100 Baggers: Stocks That Return 100-to-1 and How To Find Them, discusses:
- The common characteristics of companies that have increased one hundredfold in value, including the most important metric to look for when trying to discover the next great investment.
- A major mistake most investors make that negatively impacts their long-term performance (as well as a technique to avoid making this common error).
- Two stocks that he believes to be profitable long-term investments.
Take a listen to the Frank Blake interview. He led their turnaround and talks about
- What investors should look for in a turnaround situation.
- What publicly-traded retailers he admires.
- Where he believes we are in the U.S. housing cycle.
100 Baggers: Stocks That Return 100-to-1 and How To Find Them by Christopher W. Mayer
This book is about 100-baggers. These are stocks that return $100 for every $1 invested. That means a $10,000 investment turns into $1 million. Chris Mayer can help you find them.
It sounds like an outrageous quest with a wildly improbable chance of success. But when Mayer studied 100-baggers of the past, definite patterns emerged.
In 100-Baggers, you will learn
the key characteristics of 100-baggers
why anybody can do this. It is truly an everyman s approach. You don t need an MBA or a finance degree. Some basic financial concepts are all you need
a number of crutches or techniques that can help you get more out of your stocks and investing.
The emphasis is always on the practical, so there are many stories and anecdotes to help illustrate important points.
You should read this book if you want to get more out of your stocks. Even if you never get a 100-bagger, this book will help you turn up big winners and keep you away from losers and sleepy stocks that go nowhere.
After reading 100-Baggers, you will never look at investing the same way again. It will energize and excite you about what s possible.
See the full PDF below.


