Meson Capital’s annual letter to partners for the year ended December 31, 2017.

Check out our H2 hedge fund letters here.
Dear Partner,
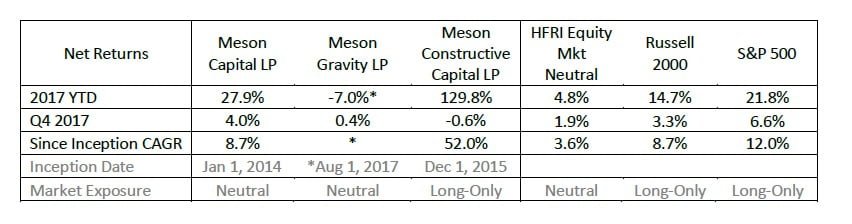
For the year, Meson Capital LP’s net performance was 27.9% vs. indices of 4.8% HFRI Equity Market Neutral Index, 14.7% Russell 2000 and 21.8% S&P 500. Shorts contributed 0.5% net of borrow fees while longs added 27.4% for the year. Our monthly-liquidity spinout fund, Meson Gravity LP was launched August 1 and performed -7.0% net for the year. As a reminder, as of the end of the year the two funds are substantially identical except for our concentrated active long positions in Meson Capital LP which necessitate a rolling lockup. Meson Gravity LP has full monthly liquidity and no lockup. The difference in returns can be attributed to 1) the Aug 1 starting date for Meson Gravity LP and 2) performance of concentrated long positions in Meson Capital LP where we realized an exit in Q4. Both funds are market neutral and approximately 100% long and 100% short for zero stock market exposure and zero market correlation.
We are happy with the results of Meson Capital LP and understanding of the results of Meson Gravity LP given the market environment. The negative results In Meson Gravity LP were almost entirely from September where the Russell increased by 11% in a violent run up. We implemented a number of improvements to the strategy starting November 1 to improve performance in a wider variety of market environments. It is paying off in this continuing straight up market and we have not seen losses since that uniquely harsh September. There are no (legal) equity investment strategies that I am aware of that perform uniformly well during all conditions. We have carefully designed our funds to perform well over a wide range of market environments by being able to achieve absolute returns from both the long and the short side. We target returns over a several year period and in the 4 year track record for Meson Capital LP since it has been run as market neutral we have not had a money losing year.
By design, we expect to perform best during volatile market environments (read: market crashes) due to our short book of low quality companies. In most environments there should be enough dispersion to find good longs and shorts that standout. The one environment that we have so far been unable to find a high returning strategy that does not expose us to too much risk is during “melt-up” type periods as we have encountered recently. It would of course be very easy to generate returns by simply being long momentum stocks during these periods but as we remember well from 2000 – there is no countdown clock to midnight when the party ends. The top performing fund managers from 1999 lost 80% of their investors’ money in the subsequent two years and we have no interest in losing purchasing power when things get interesting.
The Market Environment Today
We are not market timers or macro investors and have no “call” on the direction of the stock market. We are business analysts who dive deep – and occasionally assist as entrepreneurs – into individual companies to understand how their value and stock prices will change over time. The market environment is important to understand because the opportunity set of companies that are interesting longs or shorts is finite and context is important, especially given that we intend to be in business for a very long time.
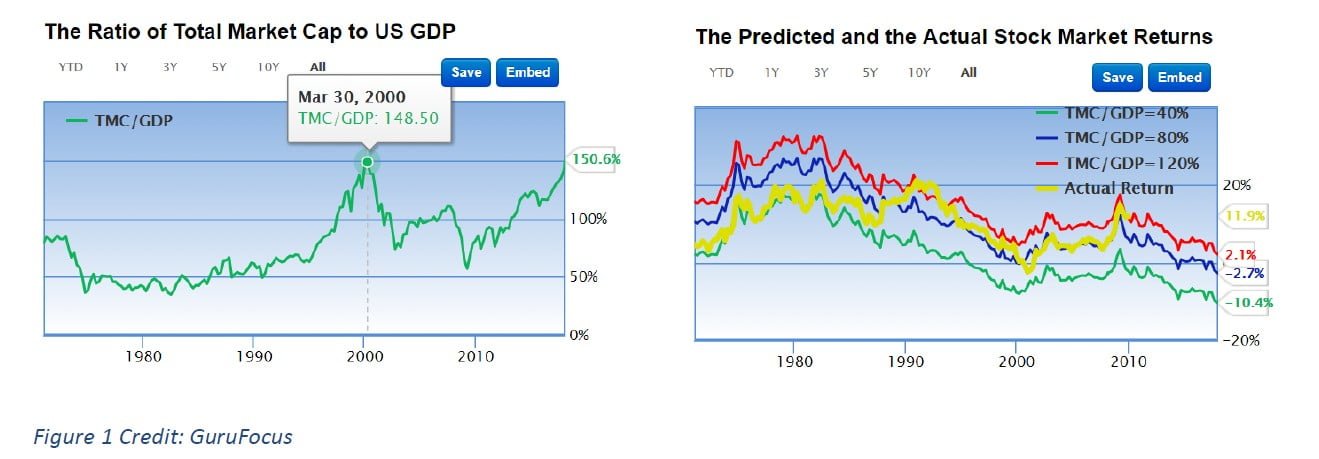
At the November, 1999 annual Allen & Co. Sun Valley Conference, Warren Buffett presented1 to a group of billionaires and industry leaders a simple slide: “DOW JONES INDUSTRIAL AVERAGE Dec. 31, 1964: 874.12 Dec. 31, 1981: 875.00.” The Dow had 17 lost years as valuation multiples compressed after a rapid expansion leading up to then despite US GDP growing 370% during those 17 years. His warning was that given the high valuations in 1999, investors expecting a continuation of 19% per year stock market returns may want to re-evaluate. His favored ‘Buffett-metric’ US market cap to GDP peaked at 148% briefly in March 2000 before the market declined 50%. Last week this level was exceeded for the first time ever and now sits at 150.6%. Quoting Buffett from the same Nov 1999 speech (link below): “Sometimes, incidentally, it's much easier in these transforming events to figure out the losers.”
The S&P 500 had no down months in 2017 which has never happened in history before. But the world is not the same as 1999 – history rhymes but never repeats exactly. In many ways this environment is far more difficult to understand from a conventional investment perspective and one that I believe we are uniquely equipped to navigate well over the next several years thanks to the capabilities we have spent years developing.
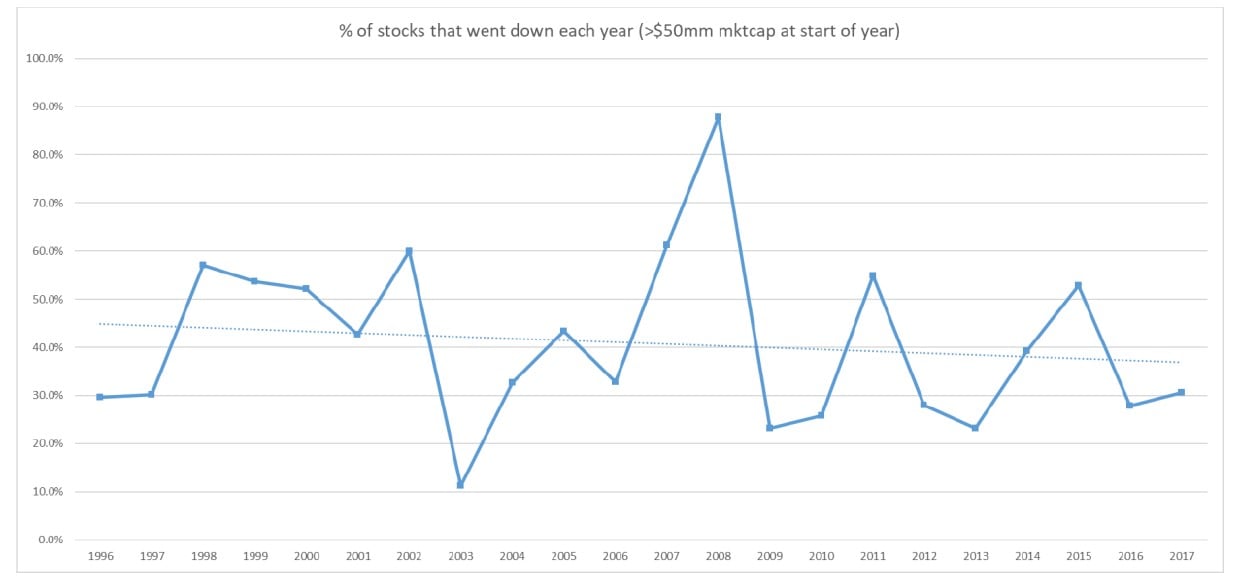
The 1999-2000 Internet Bubble market, like today, had a small group of highly successful tech stocks driving the majority of the rise of the indices. If you don’t own those leaders (today: “FAANG” stocks, 1999: MSFT, Cisco, GE, Pets.com, Enron…) it’s been virtually impossible to keep up with the market. However, in 1999 there were still many companies from the “old economy” that represented great values that were simply left behind and performed very well over the subsequent 3 years (Buffett’s Berkshire being an example though most were small caps). A number of these smaller company stocks actually declined during the doubling of the NASDAQ during ’97-’99 as can be seen in the chart below of % of stocks that declined in a given year. The recent market rise has been much broader based (excepting 2015 which was a great year on the short side for us). (All data is for the US stock market >$50mm mkt cap from CapitalIQ and is Point-In-Time so does not have survivorship bias)
The total sum market capitalization of all stocks is now at a new high vs GDP but as bottoms up stock pickers we don’t care about the index per se, we just need to find a portfolio of stocks that is maybe the best 1% longs and best 2% of shorts out of the universe of ~5,000 stocks. Median or quintiles are a more descriptive measure of the opportunity set for a bottoms-up stock picker – what picture does that present?
Many in the “the market is not expensive” camp point to Price / Earnings ratios not yet being at peak 2000 levels and with strong growth and corporate tax cuts there could be more room to expand. One data point relevant for that is that the new tax overhaul is estimated to increase corporate after-tax earnings around 7% which is about how much the S&P has increased in January already…
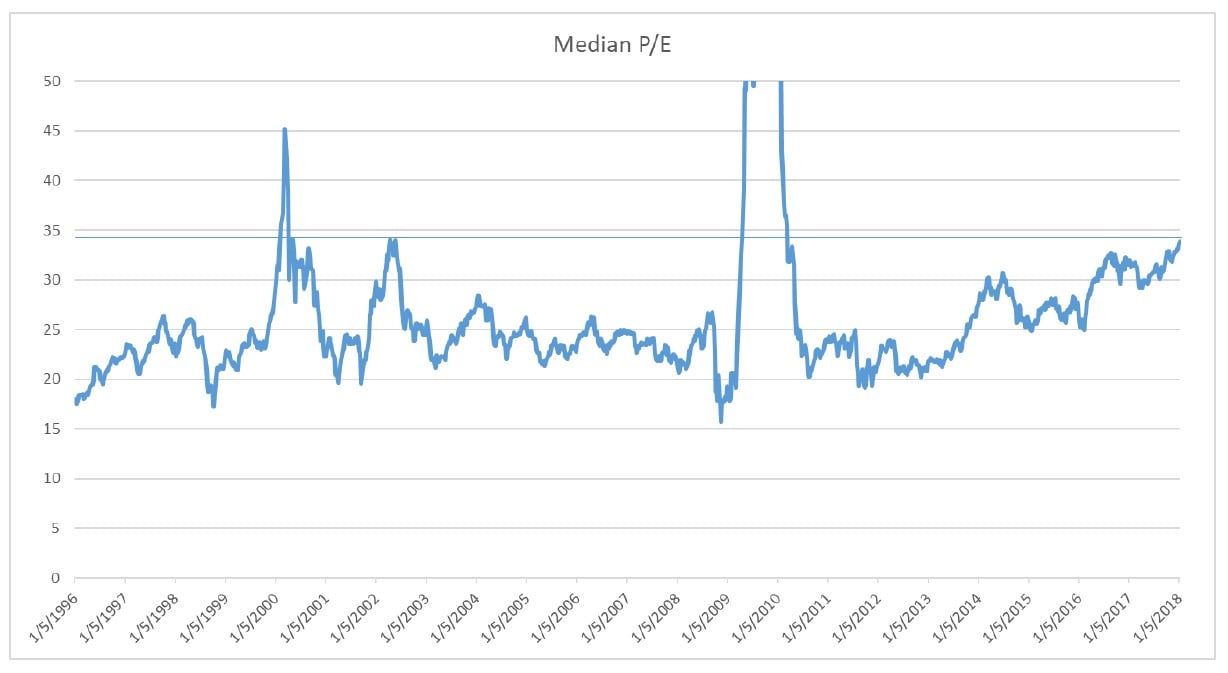
There has indeed been some fundamental earnings growth but the median P/E has expanded from 20 to 33 in the last 5 years which accounts for most of the rising stock market. To be fair to the Great Bubble of 1999, the median P/E was exceeded for about 6 months when it spiked above 35. Note the late 2002 and 2009 spikes up are due to “E” being driven down temporarily – first by the beginning of expensing of stock options and the recession and in 2009 by the Great Recession.
P/E can be a useful metric but companies have balance sheets not just common equity – EV/EBIT and EV/EBITDA are more descriptive measures of intrinsic value as they are the lens that someone acquiring the whole business would look through. P/E is easily distorted by the cash or debt on a company balance sheet. What do these metrics tell us about the opportunity set today?
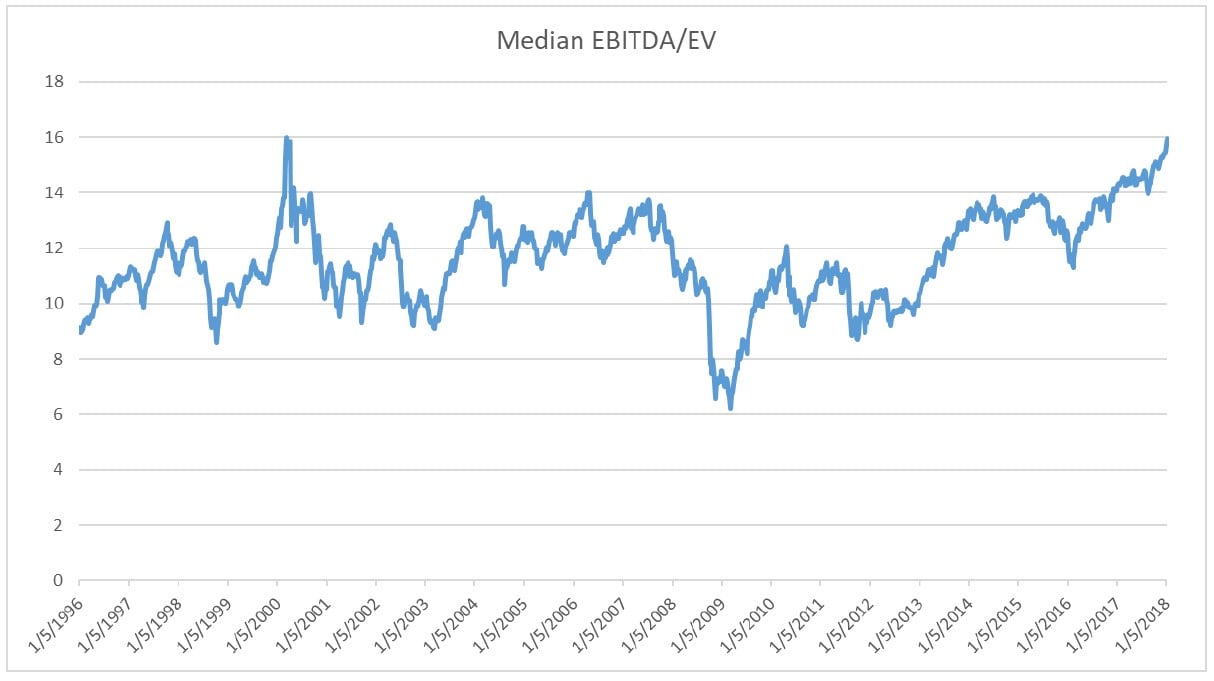
Ok so this may be more concerning than the not yet peak P/E since we are now at Peak EV/EBITDA. Counterpoint: interest rates are lower now than in 1999 so companies can handle more debt. Interest rates are rising now and the Fed recently announced they will likely have 3 or 4 hikes in 2018. This is a healthy thing as it is in response to growth. Weak companies that have boosted their earnings with inexpensive leverage (like in 2007) will not just see their earnings decline in a rising interest rate environment. Weak companies will see their earnings go negative from rising interest costs and their weak/leveraged balance sheets will limit their options. This “brush fire” clearing out the weeds to make room for the strong trees happens every credit cycle.
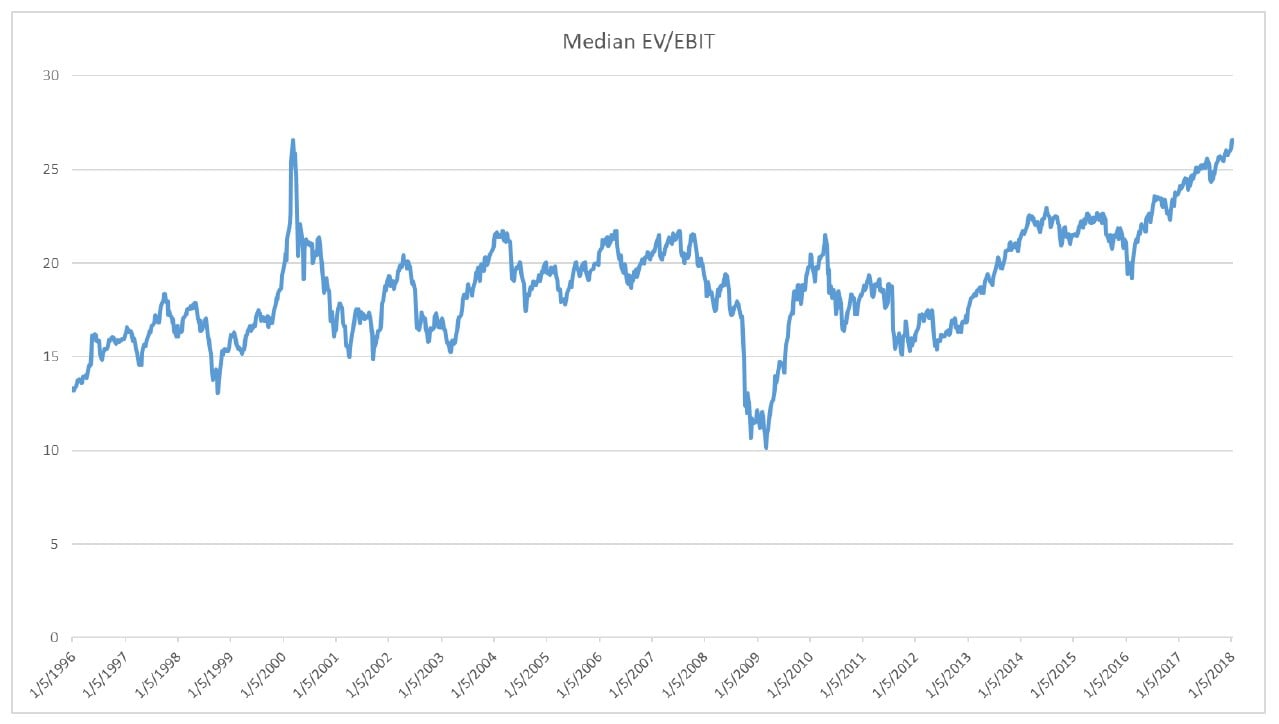
EV/EBIT is consistent with EV/EBITDA – note the difference between the two charts is “DA” or depreciation and amortization. Companies are still capitalizing investments to amortize them over time consistent with GAAP accounting.
What About the “Cheap Stocks”?
The common screening metrics for value investors are to look for statistically cheap P/E, EV/EBIT (or EV/EBITDA), and P/B. Price is what you pay, value is what you get. Getting more earnings or more net assets per dollar spent purchasing a stock should be a good thing. These are all historic numbers of course but inasmuch as historic earnings are predictive of future earnings and maybe these cheap stocks are just temporarily out of favor this is a reasonable idea. What does the data show us about this investment opportunity set today? We look at the 75th percentile and 90th percentile (i.e. if you ranked all stocks by their P/E highest/expensive to lowest/cheapest this is the cutoff point).
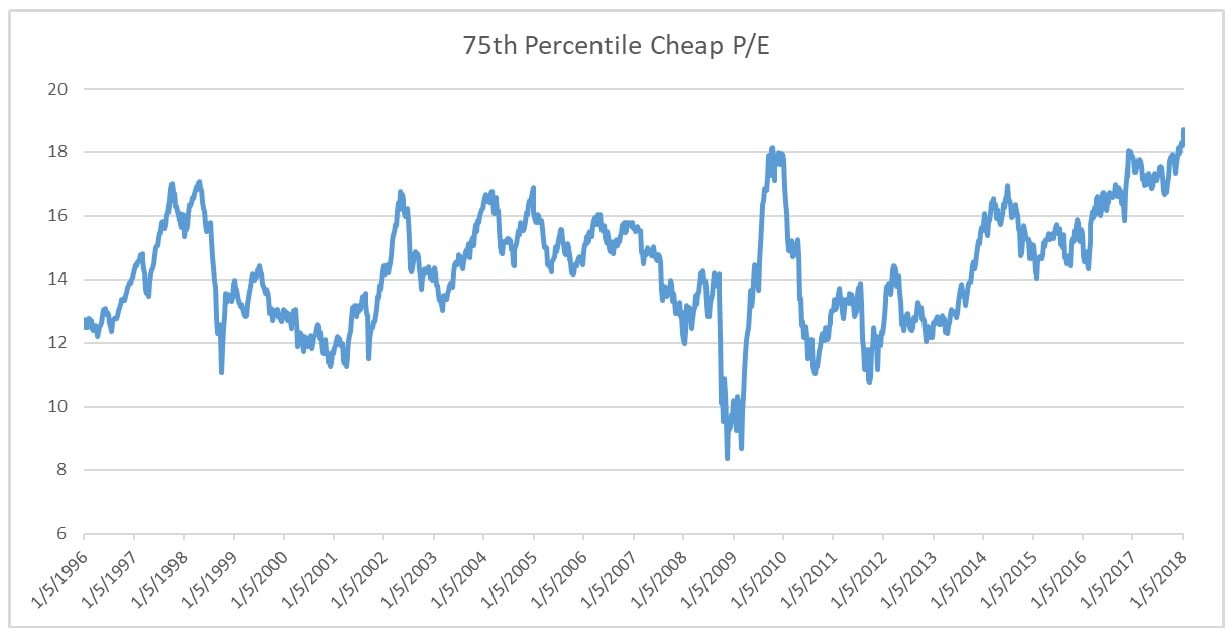
Note for P/E the 1998-2001 period there were abundant inexpensive companies to choose from despite the peak overall market valuations. Not the case today and we are setting new highs – i.e. the cheap stocks are less cheap than ever before.
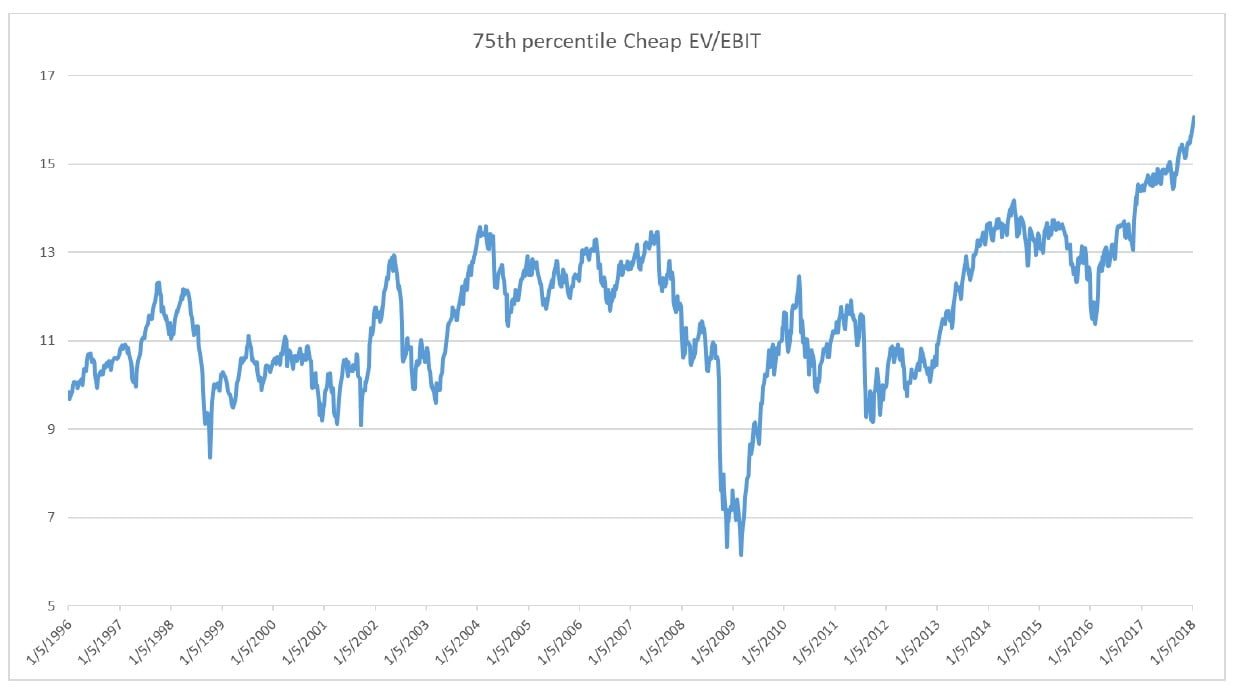
The more descriptive EV/EBIT that includes the balance sheet dynamic also shows the abundance of cheap stocks in the 1998-2001 period. EV/EBITDA chart not included as it looks similar. The shocking finding here is just how far above historical levels we are in the world of cheap stocks. Today, you are getting 15% less EBIT per dollar spent buying a company than at any previous peak level and about 35% less EBIT per dollar vs historical averages.
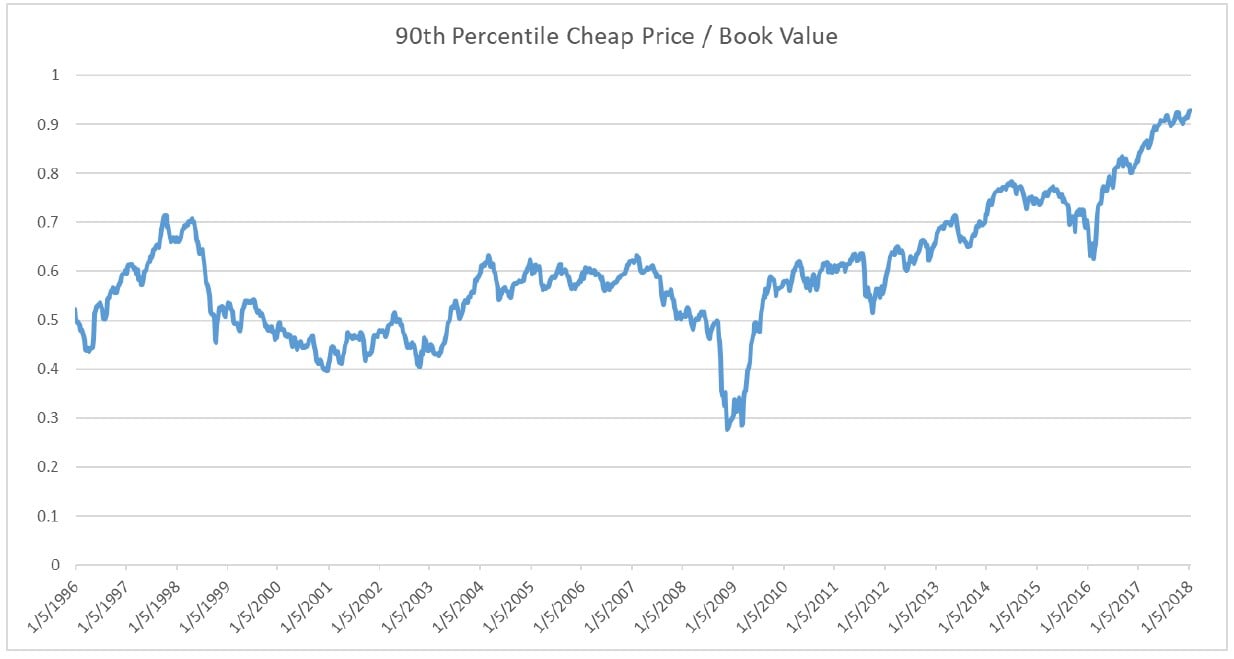
We spend less time looking at book value as it is the most historic of the valuation metrics and less descriptive of the activity of the business. That said, it can be useful to get a sense of if you can buy assets for less than historic or an estimate of replacement cost and then repurpose them then that could be profitable. We use 90th percentile as the cut off here because if you are going to assume assets are being repurposed you generally want to aim really cheap. Today you almost have to pay full historic price for the cheapest book value. What value does an old factory have when a new production process has been invented that relies on automation? Zero? Less than zero due to environmental cleanup costs? As the intrinsic value of more and more business becomes the information component that does not show up on the balance sheet, we think the relevance of book value will continue to shrink unless GAAP is substantially modified.
What Does this Environment Imply for Investors?
Why are things so much different this time? There are a number of factors – interest rates being low is certainly a contributor both in that companies have borrowed more money to repurchase shares than ever before. A similar pattern happened in 2007 and most of those leveraged (“self-LBO”) lower quality companies ended up bankrupt once the business climate declined into 2008 and 2009. A newer phenomenon that has never existed before and is likely here to stay is the “Smart Beta” movement.
Approximately $1 Trillion of assets is now managed by funds that are essentially index funds but tilted towards statistically “cheap” stocks based on the metrics above. While value investors may have been a rare breed during 2000, the secret was certainly out by 2007 when these valuation metrics peaked last time. Now the situation is even more extreme with $1T of forced buyers accumulating any stock that falls into the bottom quartile of a valuation metric (!). This of course raises the price above its otherwise unaffected level and so raises the P/E since E is not impacted by who is buying or selling your shares.
My general feeling is that smart beta and indexing is here to stay as a phenomenon and it has permanently ended the arbitrage game of simply buying statistically cheap stocks. Many active fund managers purporting to preform deep research often just rely on this shortcut and may indeed be performing research but not the type that leads to any insight or competitive advantage.
Make no mistake – intelligent investing is still and always will be about purchasing a security for less than its intrinsic value (i.e. the value of the cash flows it will produce over its life discounted back at an appropriate rate). However, as the snapshot view of intrinsic value has become too easy to calculate via screens and has been arbitraged away by the popularity of value investing and the sheer mass of Smart Beta capital deployed, the competitive plane moves up a layer.
Increasingly and essentially now – understanding the dynamic intrinsic value is what is important to have an edge. What company is losing money today and doesn’t show up on any value screen but will increase their earnings because of predictable fundamental business operations changes tomorrow and will have a flock of “Low P/E” buyers bid up the shares en mass? Where will the future of a company not look like a simple consensus extrapolation of the past? That is the key question that must be answered now to have any hope of an edge. It also happens to be dramatically harder to do than simply being disciplined about buying bottom quartile metrics that everyone else can easily calculate.
How we are positioned and have adapted to this new more competitive paradigm is as follows:
- We can produce entrepreneurial alpha via our active engagements improving companies – the best way to predict that profits will rise and operations will improve is by taking action to cause this to be true.
- Through our experience we know the business patterns that are unsustainable and likely to lead to longer term business performance declines and systematically short the lowest quality companies. The current environment that is pushing up the valuations on all companies is excellent for providing a margin of safety on the short side. These shorts are nearly certain to have disappointing future performance and likely to be catastrophic if there is an overall business environment decline.
- Boding well for the short side: interest rates are rising, labor costs are rising, and tax deductibility of interest for highly levered companies has been limited by the new tax bill
- We are positioned market neutral to hedge away things we cannot control like the overall market trends. Given where market valuations are it seems difficult to imagine the market continuing to outperform GDP growth.
- Our positioning should provide us ample purchasing power during the next downturn to acquire good quality businesses that have temporary valuation declines. Today, we are focused on investments such as Software Motor Company (SMC, discussed in Q3 letter) that can use growth capital to accelerate performance as the cost of capital is historically incredibly cheap.
Our Owner Operator Approach and Asset Duration Alignment
I treat Meson Capital like a family office: long term and something I feel comfortable having my entire net worth managed by. Most funds are sold as an investment product with an aim of sales traction satisfying an in-vogue investor demand. Since founding in 2009, my goal has been to optimize for continuous learning and to build upon timeless and universal first principles of investing and business. Investors earn excess profits (“alpha”) as a consequence of being both correct and non-consensus – or put another way, from having a competitive advantage that others cannot easily copy. Until this year, our resources to execute our strategies have been extremely limited and have consisted merely of myself, occasionally one analyst, and self-made software tools. Despite these limitations, we have compounded 8.7% net to investors since 2014 while positioned market neutral, which is about 5% per year in excess of the much better resourced hedge funds that constitute the benchmark. Today we have 5 full time people (including myself) and highly advanced modern software and computing tools. I believe we can do much better going forward.
Our approach is sometimes hard to explain to investors expecting to check a cleaner “strategy box” in their taxonomy of strategies. If I had to frame it like that, I would say our strategy is to check the “competitive advantage” box when we invest. We have focused on public equities to date as we know this world well but also have private equity investments when appropriate. Investors flock to private equity more than hedge funds during market declines because of PE’s less onerous drawdown reporting requirements where bizarrely: the inability to withdraw capital provides comfort (out of sight out of mind…). But we think our structure at Meson Capital LP combining value-added longs with our diversified and profitable short book achieves the best of both worlds and will do better over the full market cycle. In addition, we created Meson Gravity LP to provide an avenue for institutional investors who require monthly liquidity because of their own stakeholders. Meson Constructive Capital LP exists to take outsized co-investment positions in our highest conviction longs.
A Challenging Market Environment for Long-Only Stock Pickers, Better than Ever for Entrepreneurs:
The current environment of high valuations and rapid technology change should provide tailwinds for both sides of our strategy. On the long side, it has never been better to be an entrepreneurial business builder. Cost of growth capital is as low as any point in history and the amplification effects of technology make human willpower and intelligence more economically potent than ever. On the short side – increased competition and technological disruption is making the lifecycle of poorly run companies shorter than ever. The inflated valuations across the market allow for attractive short entry points, which should offer a better value proposition for shorting stocks of poorly positioned companies.
Ever since I founded Meson in 2009, I have taken the path knowing that I would be doing this for 50 years. I have always reinvested our management and incentive fee revenues for the long term to improve our investment process and am tremendously excited for this new chapter. I’m proud to be building the team as we work to institutionalize the firm. We are now up to 5 full time professionals and over $30mm AUM, nearly triple vs. one year ago even after distributing nearly $10mm in profits to investors in Meson Constructive Capital LP, our private equity vehicle. I believe we are uniquely positioned to take advantage of the current market environment and have built processes that are adaptable to whatever future market environments we encounter.
I continue to have virtually all of my investable net worth committed alongside investors in the Partnership. Please email me at [email protected] or call at 415-322-0486 if you have any questions or are interested in investing. Our minimum investment has increased to $500,000 in Meson Capital LP and $1,000,000 in Meson Gravity LP. This is the last month we will be offering the Founder’s class reduced fee structure to investors for Meson Capital LP. We are also pausing on taking new capital in Meson Capital LP until April 1 as we work through a key investment. Meson Gravity LP remains open. As always, thank you for reading.
Sincerely,
President
Meson Capital Partners, LLC
See the full PDF below.


