At a 1974 dinner meeting that included Dick Cheney and Donald Rumsfeld, Arthur Laffer presented his case against President Ford’s tax increase by famously sketching a graph on a napkin to prove his point. This graph came to be known as the “Laffer Curve.”

Check out our H2 hedge fund letters here.
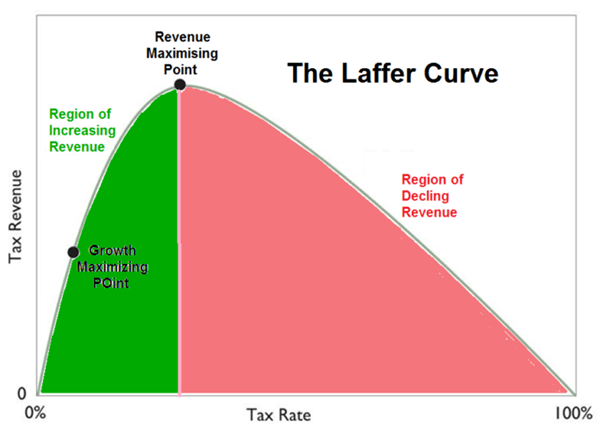
The Laffer Curve shows the direct correlation between tax rates and tax revenue. The graph suggests that there is a certain tax rate the government should impose. To better understand the graph, you have to understand where placing the tax rate at either end of the X-axis would mean. If the government imposed a tax rate of 0 percent, the government would not collect any revenue. If the government imposed a tax rate of 100 percent, individuals would no longer work and businesses would no longer produce goods as there would be no incentive to do so. While there are varying schools of thought from economists on where the tax rate should be placed, economic principles show that lowering the tax rate gives more of an incentive to produce and can grow the economy.
We are finally seeing the Laffer Curve applied in real policy, as well as the predicted results. The new tax plan has significantly lowered taxes and helped stimulate growth for the economy.

The intended effect of cutting taxes is to accelerate economic growth. An unintended consequence of cutting taxes is raising government revenue. The January 2018 Monthly Treasury Statement showed that the U.S. Department of Treasury received $361 billion in tax revenue. In January 2018, the Treasury received $212 billion in individual income taxes, $113 billion in payroll taxes, $13 billion in corporate income taxes, and $23 billion in other taxes. For January, it was the most tax revenue collected in American history.
Furthermore, taxes received in the first four months of fiscal year 2018 (FY18) are also the most in American history. Thus far, tax revenue for FY18 has come from $603 billion in individual taxes, $372 billion in payroll taxes, $76 billion in corporate taxes, and $81 billion in other taxes.
The Laffer Curve was first drawn on a napkin, and now we are seeing it be applied to tax policy.
Raising revenue for the government was not the intended goal of this recent tax plan. The plan was meant to stimulate growth, lower unemployment, and incentivize companies to grow their workforce as a result of less corporate revenue being taxed.
A group of 137 economists pledged their support of the new Tax Plan in a letter to Congress. In the letter, they cited a GDP boost as a result of lowering tax rates.
“The enactment of a comprehensive overhaul — complete with a lower corporate tax rate — will ignite our economy with levels of growth not seen in generations. A twenty percent statutory rate on a permanent basis would, per the Council of Economic Advisers, help produce a GDP boost between 3 and 5 percent.”
The Laffer Curve was first drawn on a napkin, and now we are seeing it applied to tax policy. In the short-run, the new tax plan has shown that Arthur Laffer’s analysis was correct that lowering taxes would raise revenue and grow the economy. In the long-run, if this trend continues, the American economy will continue its growth.

Morgan Kimbarow
Morgan Kimbarow is a Media Ambassador for Young Americans for Liberty. Morgan studied economics at San Jose State University. He works for a software company as a business development representative and serves in the United States Army Reserves. He is committed to the ideals of liberty and free-market economics. He is especially interested in applying his economics education and real-world experience to make compelling arguments for freedom and liberty.
This article was originally published on FEE.org. Read the original article.
![]()


