Just a quick global equity breadth check here. As a reminder, these breadth models are looking at breadth across countries i.e. the main benchmark stock index for each of the countries we monitor (70 countries in total). Looking at breadth in this fashion for global equities can help flag early warning signs if certain pockets of the globe are coming under pressure, or indeed trigger timing signals when global markets succumb to panic selling and broad capitulation.

As you might expect, and following on from the article last week which looked specifically at 50-day moving average breadth for global equities, most measures of breadth have broken down markedly. At this point it's tempting to call global equities oversold, and that would be my bias, that said it's a risky juncture.
The main points from the charts on global equity breadth are:
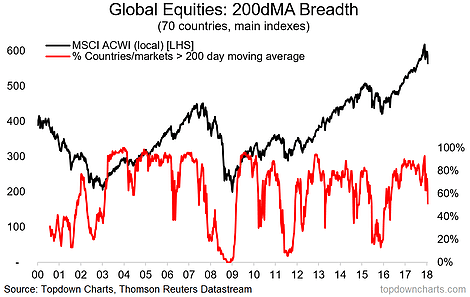
-200-day moving average breadth is breaking down.
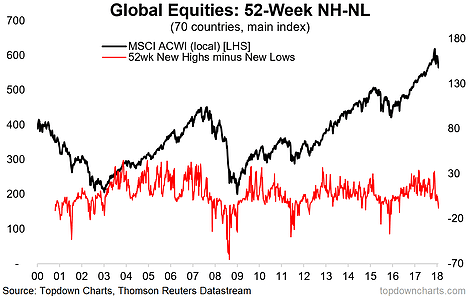
-52-week New Highs minus New Lows shows significant downward momentum, yet is also in the oversold zone.
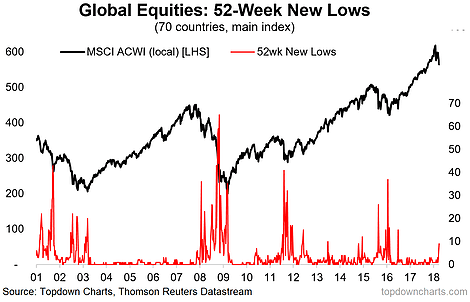
-The number of countries trading at new 52-week lows reached 9 (out of 70).
- 200-day Moving Average Breadth: This time looking at 200-day moving average breadth across countries, you can see a notable breakdown here. In previous episodes there has basically been two types of breakdown in this indicator: i. Oversold markets; and ii. Trend changes. We can only truly know what it is after the fact, but we're truly seeing a significant reset here and that could create an interesting setup.
- New Highs minus New Lows: Moving on to 52-week New Highs minus New Lows, the momentum in this indicator has clearly shifted to the downside. Again it's clearly in the oversold zone, but if you look at similar breakdowns in the past, particularly after such surge, it might take some more water to go under the bridge on this one.
- 52-Week New Lows: Finally, just a quick look at one of the components of the previous chart - the number of countries making new 52-week lows. The latest data show this indicator at 9, which is the highest reading since back in 2016 (the shock Brexit vote and the twin corrections prior). For those who will ask, these are the nine: Botswana, Cyprus, Germany, UK, Spain, Ireland, Mexico, Oman, and Switzerland. The only real common theme between them is half of them are in Europe.
Follow us on:
LinkedIn https://www.linkedin.com/company/topdown-charts
Twitter http://www.twitter.com/topdowncharts
Article by Callum Thomas, Top Down Charts


