This is the time to be alert for any signs of a failure in the S&P 500. Why? There are two really good historical precedents to the current market configuration.
[REITs]Check out our H2 hedge fund letters here.
The set-up is as follows: stocks suffer a rather quick correction, bounce back, take out the previous lows and experience a waterfall decline. The period of time from the bounce-back high to a new low was seven days.
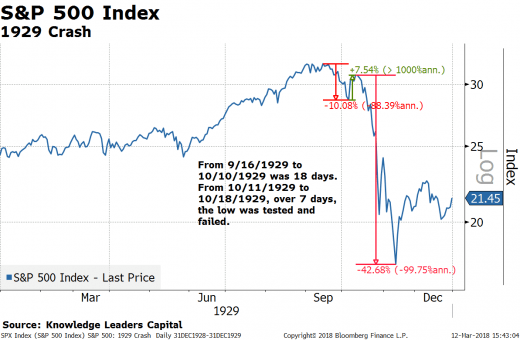
Let’s look at the 1929 crash to start. The S&P 500 peaked at 31.86 on September 16, 1929. Over the next 14 days, the index experienced a 10.08% correction. Then, over the next four days, stocks bounced back by 7.54%. What followed was a seven-day period of time where stocks drifted lower, and then on October 18, 1929 the low was broken and a waterfall decline ensued. The decline from October 8, 1929 to November 13, 1929 was a 22-day waterfall decline, with stocks dropping 42.68% into November 13, 1929.
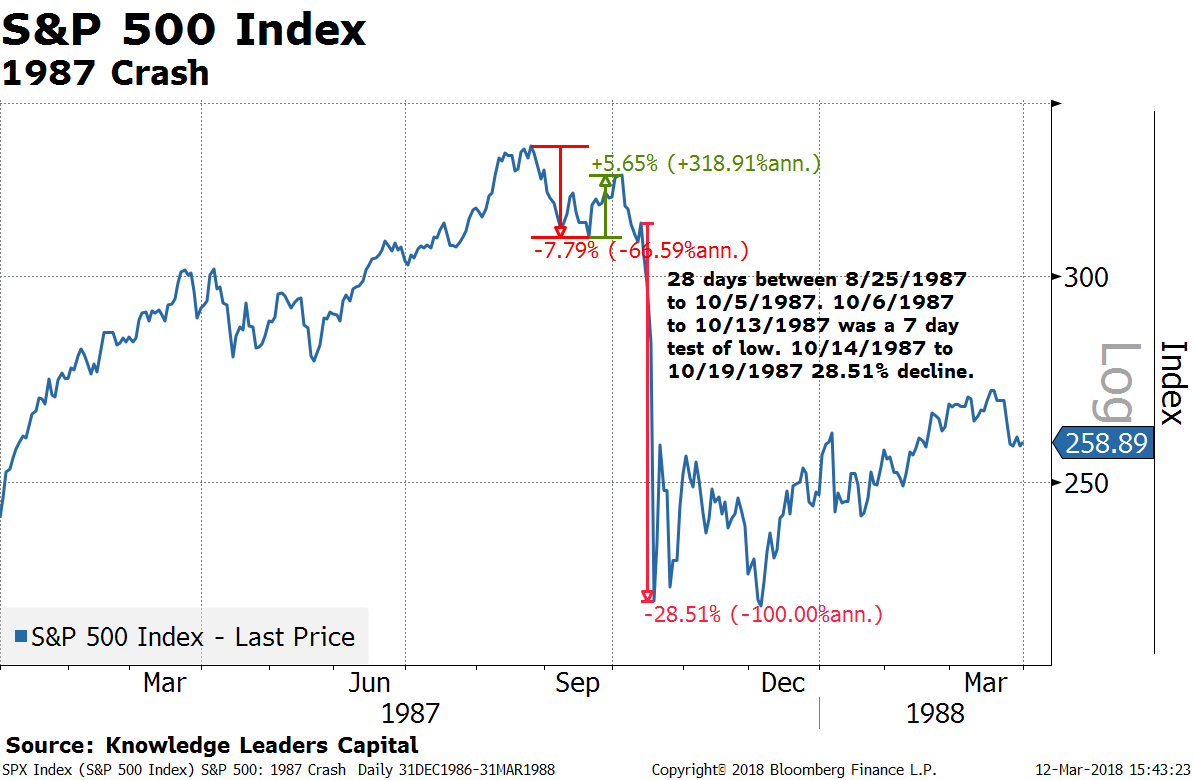
The 1987 crash was a remarkably similar experience. Stocks peaked on August 25, 1987 and then began a 7.79% decline over 18 days. Stocks then rebounded by 5.65% over the following 10 days, peaking on October 5, 1987. Over the next seven days, the low failed and a waterfall decline followed. The decline was 28.51% over four days, culminating in a low on October 19, 1987.
In the last 40 days, we’ve seen the S&P 500 peak at 2872.87 on January 26. Stocks experienced a 10.16% correction over nine days, and then they bounced back by 7.96% over the next 20 days ending last Friday, March 9. We are now in that seven-day window where stocks need to hold up.

If, over the next seven days, we drift lower and take out the 2581 low of February 8, history suggests this is a set-up for a waterfall decline. Through next Wednesday, it is time to be alert.
Article by Steven Vannelli, CFA – Knowledge Leaders Capital


