
Our analysis reveals that residents of Michigan, Arkansas, Delaware, Kentucky, and Missouri have the lowest debt-to-income ratios in the country.
How does your state rank in terms of debt management? A new study by Credible exposes where people are best (and worst) at managing their credit card bills, student loan debt, and housing costs.

Read on to see how your financial profile compares to the average person in your state—and across state borders.
Key highlights
- Michigan, Arkansas, Delaware, Kentucky, and Missouri have the highest scores in the U.S., with low debt-to-income ratios: on average, Michigan residents in this dataset spent just 25.3% of their monthly income on credit card, student loan, and housing payments—the lowest percentage in the U.S.
- Hawaii, Washington, Colorado, Oregon, and Montana came in towards the bottom of the list with the highest average debt-to-income ratios: Residents of Hawaii spend, on average, 36.2% of their monthly paychecks on credit card, student loan, and housing payments—the highest percentage in the nation, and over 43% more than residents of Michigan
- Monthly credit card payments were highest in Minnesota ($241/month), Hawaii ($238), Nevada ($234), New Jersey ($231), and Connecticut ($231)
- Conversely, those in Mississippi ($154), Louisiana ($157), Washington, D.C. ($160), Arkansas ($174), and South Carolina ($181) spend the least on paying off credit card debt
- The data showed average student loan payments to be highest in D.C., Maine, Massachusetts, Alaska, and New Jersey, and lowest in Mississippi, Louisiana, Alabama, Wyoming, and North Dakota
Map: debt and income by state
Toggle through the menu below to see the overall score, average monthly credit card, student loan, and mortgage payments, and average annual income for each state.
Financial health is relative
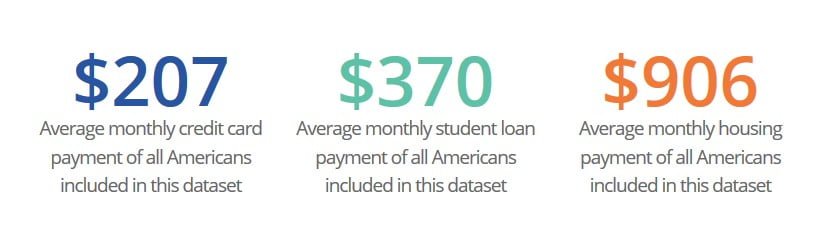
On average, Americans included in this dataset paid $207 on their credit card debt, $370 on their student loans, and $906 on their housing each month, while taking home an average salary of $60,671.
But what’s the special sauce that makes some states’ residents so much better at debt management than others?
Well, it depends.
In Michigan, for example, cost of living plays a large role. Low average monthly housing payments relative to average income (combined with lower than average credit card and student loan payments) push the state up the rankings.
At the other end of the spectrum, some states rank lower because of particularly high payments made in one category or another.
Residents of Hawaii, for example, pay the second highest amount on monthly credit card bills and fourth highest amount on housing costs and their average income isn’t high enough to offset those costs.
Mortgage debt can increase a resident’s debt-to-income ratio. The vast majority of the 540,000 borrowers included in this analysis are not homeowners but nearly 19% have one or more mortgages.
Of that group, the average housing payment increases to $1,705, nearly double the average housing payment for all borrowers, a group that includes renters, homeowners, and people living with parents.
You are not your state
While this new ranking sheds light on how residents of various states perform in terms of debt management, keep in mind that these are average numbers — and that your debt is a personal matter.
No matter how your state ranks, find a debt payoff plan that fits your budget and lifestyle, as well as minimizes what you’ll owe in interest as you pay off each loan.
For example, balance transfer credit cards can be useful to begin paying off your credit card debt. These cards will often offer you six to 18 months of 0% APR for balance transfers, giving you some time to get your finances in order without accruing a ton of interest. If paying off credit card debt is one of your goals, Credible can help you find the best balance transfer credit cards of 2018.
Methodology
We used proprietary data from over 540,000 borrowers with student loan debt from all 50 U.S. states and D.C. to calculate average monthly credit card, student loan, and housing payments as a percentage of average monthly income. Therefore, the debt-to-income ratio we used to rank all states included credit card debt, student loan debt, and housing costs (such as rent or mortgage payments).
That percentage was then assigned a normalized score from 0-100 for each state, 0 being where debt payments are the highest percentage of monthly income, and 100 being where monthly payments are the lowest percentage of monthly income.
Full rankings and data
| State | Average monthly credit card payment | Average monthly student loan payment | Average monthly housing payment | Average annual income | Monthly debt-to-income ratio | Overall score |
| Michigan | $198 | $354 | $725 | $60,642 | 25.27% | 100 |
| Arkansas | $174 | $319 | $666 | $54,284 | 25.62% | 96.77 |
| Delaware | $213 | $364 | $853 | $64,174 | 26.74% | 86.49 |
| Kentucky | $184 | $323 | $696 | $53,821 | 26.82% | 85.74 |
| Missouri | $203 | $340 | $738 | $56,234 | 27.34% | 81.02 |
| Mississippi | $154 | $263 | $574 | $42,993 | 27.66% | 78.04 |
| Ohio | $211 | $370 | $729 | $55,763 | 28.19% | 73.16 |
| Indiana | $197 | $343 | $699 | $52,717 | 28.20% | 73.05 |
| Pennsylvania | $215 | $394 | $746 | $57,636 | 28.21% | 72.97 |
| Georgia | $186 | $328 | $812 | $56,344 | 28.24% | 72.7 |
| West Virginia | $193 | $337 | $624 | $49,017 | 28.25% | 72.61 |
| North Carolina | $193 | $338 | $810 | $56,867 | 28.30% | 72.18 |
| New Jersey | $231 | $435 | $997 | $70,378 | 28.36% | 71.65 |
| Rhode Island | $210 | $418 | $842 | $61,727 | 28.58% | 69.61 |
| Iowa | $202 | $367 | $751 | $55,226 | 28.68% | 68.65 |
| New Mexico | $184 | $336 | $787 | $54,636 | 28.71% | 68.43 |
| Nevada | $234 | $430 | $966 | $67,993 | 28.77% | 67.86 |
| Wisconsin | $215 | $393 | $771 | $57,126 | 28.97% | 66.03 |
| Texas | $203 | $339 | $926 | $60,765 | 28.99% | 65.82 |
| Utah | $187 | $322 | $947 | $60,108 | 29.07% | 65.11 |
| Connecticut | $231 | $415 | $1,006 | $68,145 | 29.09% | 64.89 |
| New York | $207 | $394 | $979 | $64,613 | 29.34% | 62.57 |
| Oklahoma | $202 | $317 | $732 | $51,147 | 29.35% | 62.51 |
| Illinois | $221 | $367 | $889 | $60,385 | 29.35% | 62.5 |
| Massachusetts | $195 | $449 | $991 | $66,813 | 29.37% | 62.37 |
| Alabama | $186 | $290 | $630 | $45,123 | 29.41% | 61.94 |
| Louisiana | $157 | $284 | $706 | $46,629 | 29.52% | 60.97 |
| New Hampshire | $209 | $418 | $926 | $63,071 | 29.55% | 60.7 |
| Arizona | $197 | $340 | $878 | $57,412 | 29.58% | 60.44 |
| South Carolina | $181 | $349 | $732 | $51,115 | 29.63% | 59.97 |
| Minnesota | $241 | $371 | $899 | $60,941 | 29.75% | 58.81 |
| Nebraska | $213 | $364 | $808 | $55,773 | 29.80% | 58.39 |
| Kansas | $204 | $338 | $818 | $54,677 | 29.85% | 57.94 |
| Tennessee | $196 | $349 | $787 | $53,464 | 29.90% | 57.49 |
| Maryland | $227 | $405 | $1,084 | $68,819 | 29.92% | 57.26 |
| District of Columbia | $160 | $574 | $1,355 | $83,769 | 29.93% | 57.23 |
| California | $208 | $372 | $1,198 | $71,277 | 29.93% | 57.15 |
| South Dakota | $201 | $351 | $771 | $52,390 | 30.30% | 53.75 |
| Idaho | $207 | $356 | $858 | $56,143 | 30.37% | 53.12 |
| North Dakota | $190 | $312 | $727 | $48,351 | 30.50% | 51.93 |
| Wyoming | $195 | $308 | $894 | $54,594 | 30.71% | 50.05 |
| Florida | $208 | $330 | $893 | $55,899 | 30.72% | 49.93 |
| Maine | $194 | $451 | $767 | $55,047 | 30.78% | 49.37 |
| Vermont | $184 | $412 | $810 | $54,377 | 31.03% | 47.1 |
| Alaska | $216 | $443 | $1,018 | $64,304 | 31.30% | 44.64 |
| Virginia | $216 | $369 | $1,031 | $61,863 | 31.35% | 44.17 |
| Montana | $188 | $354 | $863 | $52,587 | 32.06% | 37.61 |
| Oregon | $195 | $393 | $973 | $58,147 | 32.21% | 36.19 |
| Colorado | $215 | $378 | $1,076 | $62,161 | 32.22% | 36.15 |
| Washington | $221 | $385 | $1,096 | $63,028 | 32.40% | 34.45 |
| Hawaii | $238 | $385 | $1,091 | $56,889 | 36.15% | 0 |
Article by Ariha Setalvad, Credible


