After a turbulent week, the Dow Jones Industrial Average and S&P 500 Index officially slipped into correction territory at yesterday’s close—marking the fastest move from record levels to correction in history. For reference, a correction is defined as a decline of -10.0% from the most recent high, which in this case occurred just nine days ago on January 26.
[REITs]The Dow has experienced two 1,000-point declines this week, which are larger numbers than investors are used to seeing on a single day; however, it is also important to note that the Dow (which closed at 23,860.46 yesterday) is much higher now than it was the last time we experienced a significant pullback. The last time the Dow saw a larger percentage pullback in a single day was on August 8, 2011, when it fell 634.76 points to close at 10,809.85—a -5.5% move for the index. To put things in perspective, neither that move, nor the latest two drops (-4.6% and -4.1% on February 2 and February 8, respectively) managed to crack the top 100 declines in history.
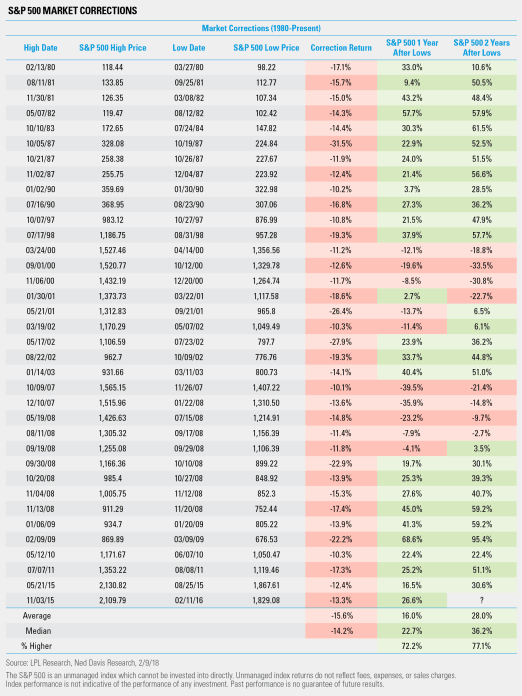
Corrections are never fun, but they also aren’t new territory for investors. Prior to the most recent example, we have experienced 36 corrections since 1980, and the S&P 500 fell by an average of 15.6% from peak to trough during these periods. Twelve months later, the index made up some ground, rising an average of 16.0% from the low, and after 24 months, the S&P 500 had climbed by an average of 28.0%, reinforcing the need for long-term investors to maintain their diversified strategies.
John Lynch, Chief Investment Strategist stated, “Considering positive economic data and rising corporate profits, we remain favorable on the longer-term investing environment despite the near-term volatility as leveraged trades continue to unwind in a messy and choppy fashion.” We maintain our projections for gross domestic product growth of up to 3.0% in 2018, along with a trading range of 2.75% to 3.25% for the 10-year Treasury, and a fair value estimate of 2,850–2,900 for the S&P 500. Additionally, we continue to favor areas of the market which may benefit from the return of the business cycle (see our Outlook 2018 for more information), including moves toward value, small cap stocks, financials, industrials, and technology.
LPL Research projects real gross domestic product (GDP) growth of around 3.0% in 2018. This is in line with historical mid-cycle growth of the last 50 years. Economic growth is affected by changes to inputs such as business and consumer spending, housing, net exports, capital investments, and government spending.
LPL Research also expects the 10-year Treasury yield to end 2018 in the 2.75–3.25% range, based on its expectations for a modest pickup in growth and inflation.
Article by LPL Research


