“Davidson” submits:
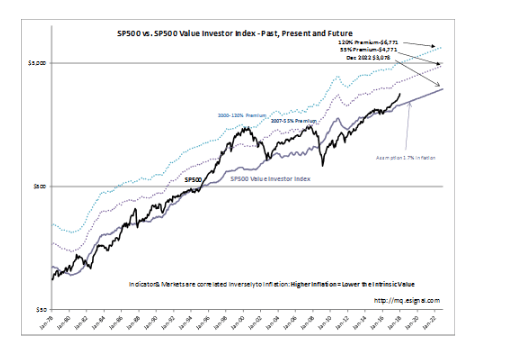
[REITs]The SP500 Value Investor Index $2,275 vs. SP500 $2,823 looks scary, but it is not really. The history from 1978 is shown in semi-log format and extended with current reported values out to 2022. Two over-valued level trend lines have been added which represent the 120% level of Premium Valuation which occurred in 2000 and 55% Premium of 2007. The Value Investor Index is not useful for estimating market tops. It is only designed for recession lows as in 2003 and 2009. Market tops come from pure speculative market psychology. How high markets are priced above any level of long-term average valuation is anyone’s guess. The SP500 Value Investor Index is only for recession lows and useless for cycle tops. But, there is a relatively good indicator available for peak markets which has a good reputation over time.
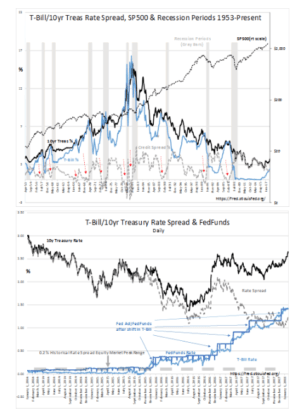
The one indicator which has a long history of reasonably calling major market cycle tops since 1953 has been the T-Bill/10yr Treasury rate spread indicator. Market psychology drives market prices. What occurs near the end of every Bull Market is several years of upside-surprise quarterly reports which draws investors in ‘Hook, Line and Sinker’. In short investors become overly positive after a period of disbelief taking their last positions of cash to chase what appear to be unstoppable economic momentum. The term ‘New Era’ is often heard during these periods of excess. Financially, this rush for returns is reflected in a rise in T-Bill rates such that the T-Bill/10yr Treas rate spread falls to less than 0.20%. When this occurs, bank lending which has been fueling cash into the economy slows considerably and an economic correction begins. As poorer economic news than anticipated enters the media headlines, equity market enter a cycle correction. The Monthly record of this indicator from 1953 has Red Arrows for signaling the end historical economic cycles. The Daily record from 2014 shows the rate spread has widened since the new tax law to 1.325%. This is a sign that future bank lending is likely to expand which fuels additional economic expansion and higher equity prices follow.
Rising rates while competitive to other perceived returns do not in themselves cause economic corrections. The key is the rate spread between the T-Bill(short term money) and the 10yr Treasury(long term lending rates). Banks take in funds and guarantee their return by offering liquidity at low rates. They make money by lending prudently at the 10yr Treasury rate with an added spread. They slow lending considerably when this spread narrows to such a degree that they cannot make profitable loans. It is the change in momentum in lending from a relatively rapid pace to something much less which is responsible for economic corrections and market cycle tops. All looks very good at the moment.
The current investment thesis:
Bank lending is expanding and economic activity should follow. The US$ is falling. Global capital, placed in the US as a safe haven in 2014-2016 with Russia’s Invasion of Ukraine, rise of ISIS and a series of unsettling terrorist events, is returning as global investors feel capital investment has become safer in Emg/Dev markets. A weaker US$ is good for US high-value exports and commodity related businesses( Falling US$=Rise in Commodity Price). It appears at this moment, global economic expansion could last another 3yrs-5yrs and the Global Equity Markets should follow.


