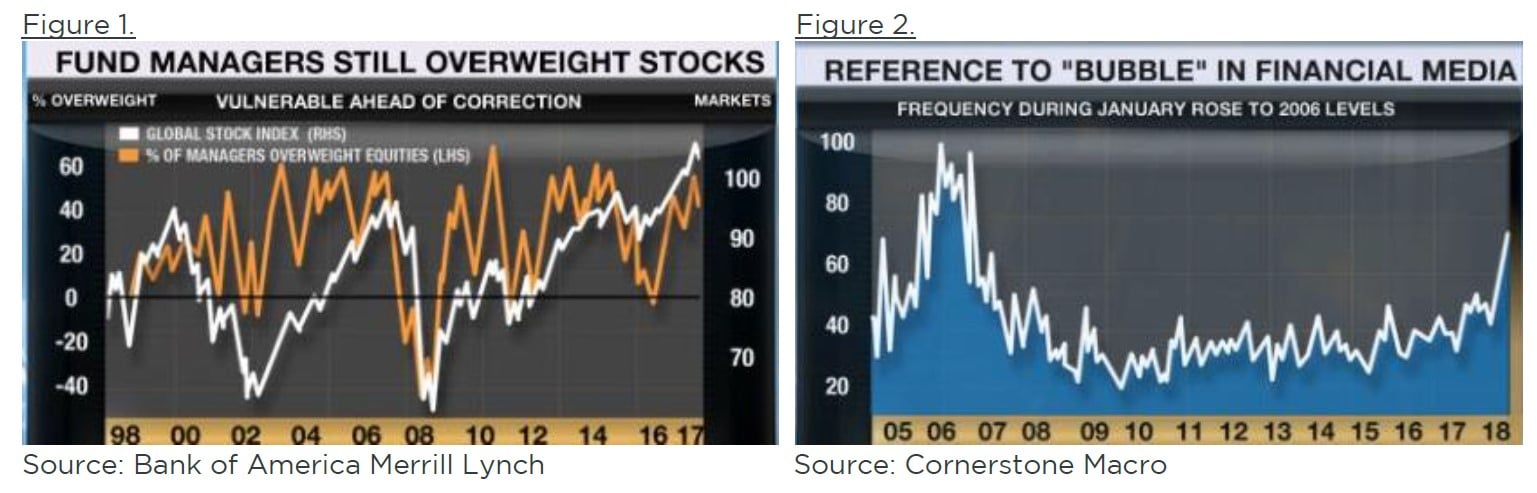
Even the bulls who foresaw additional upside in equities admitted stocks were far from cheap entering 2018. Then, January 2018 delivered stunning upside in US stocks, epitomized by the 15.5% advance in the FANG index, catapulting the S&P 500 deep into overbought territory at 7% and 14% respectively above its 50- and 200-day moving average. Coincidentally, as shown in Figure 2, the frequency that the term “market bubble” appeared in the financial press climbed back to levels last seen during 2006 and many fund managers remained overweight equities.

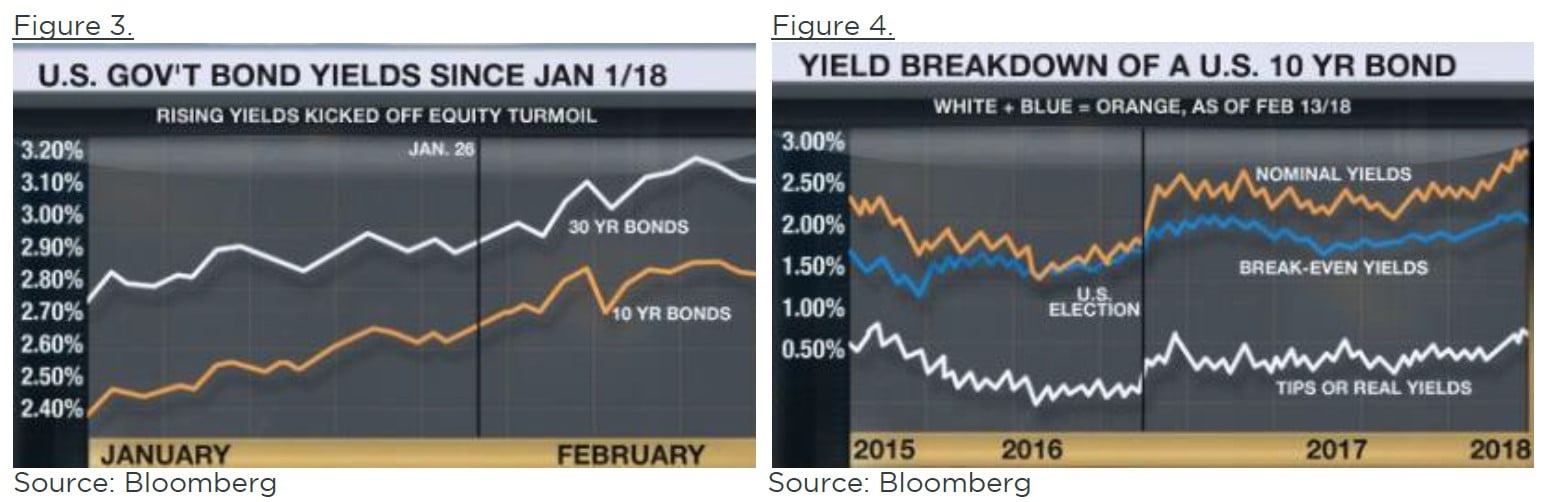
Meanwhile, Figure 3 shows that interest rates were finally starting to march higher. On Friday, January 26th the yield on a US 10-year bond hit 2.66%, piercing through its since US election 2.63% ceiling, as concern over a future rise in inflation began to finally take hold. In addition, given the relative performance of stocks to bonds during January, traders suggest yields could have traded to even higher levels if the demand from month-end asset reallocation had not come into play.
Then came the pivotal week beginning Monday, January 29th, featuring Trump's State of the Union address, Yellen's last Fed meeting, the US Treasury Department's refunding announcement, and January jobs data on Friday. While 10-year US treasuries closed that day at 2.695%, more interestingly, German 5-year bunds traded above a 0% yield for the first time since late 2015. Increasingly skittish by now, the S&P 500 then experienced its first 1% down day since May 2017 on Tuesday, January 30th. The next day, as expected, the FOMC (Federal Open Market Committee) didn't hike rates, but its press release was hawkish given the upgrade in its language to "gains in employment, spending and investment have been solid".
The following day, Thursday, Feb 1st at 12:30 pm, the Atlanta Fed shocked markets with its updated forecast for Q1 US GDP of 5.37%. The reaction was swift, negative and in my books the first item of four items that triggered the severity of the decline seen during the following seven trading days. Figure 5 illustrates the intraday trading for Thursday and Friday of the yield on the 10-year US government bond (white line) and the price of the S&P 500 (orange line). Look at the red circle in the lower left; that's 12:30 pm ET.
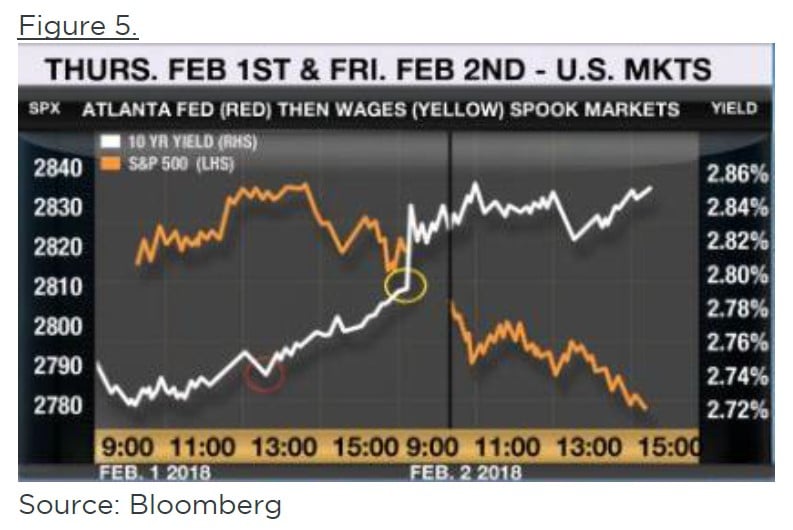
About one hour later, the S&P 500 started falling too. Now look at the yellow circle; that's Friday at 8:30 am ET when US jobs data was released. The black vertical line is 9:30 am ET when equity markets opened up. Up until that morning I'd argue the price declines in stocks and bonds had been driven by fundamental factors, specifically growth and inflation. But then the narrative changed and the fear factor spiked.
Back in 2006, according to Gavekal Research, the daily trading volumes for options on the VIX index totalled 26,000 contracts. During 2010, on average 695,000 S&P 500 options would trade on a given day. Last year that number had grown to 1.16 million. During the first week of February 2018, that same number was 3 million contracts!
Ever since G4 Central Banks began to artificially suppress yields in an attempt to kickstart economies post the 2008 GFC, one side effect has been to turn many investors into "yield chasers". Similar to the late stages of previous cycles, the reach for yield today caused risk-taking traders into an "alphabet soup" of asymmetrical risk/reward products. In the past it was CDOs (late 1990s) and CDSs (2008), and now, in 2017/2018, the VIX.
Pension funds and various quantitative-based investors are believed to have recently held between US$1.2T and US$1.5T of contracts that in effect enabled them to be short volatility, in other words, the VIX. So when the VIX took such a sudden shift upwards, alarm bells were triggered.
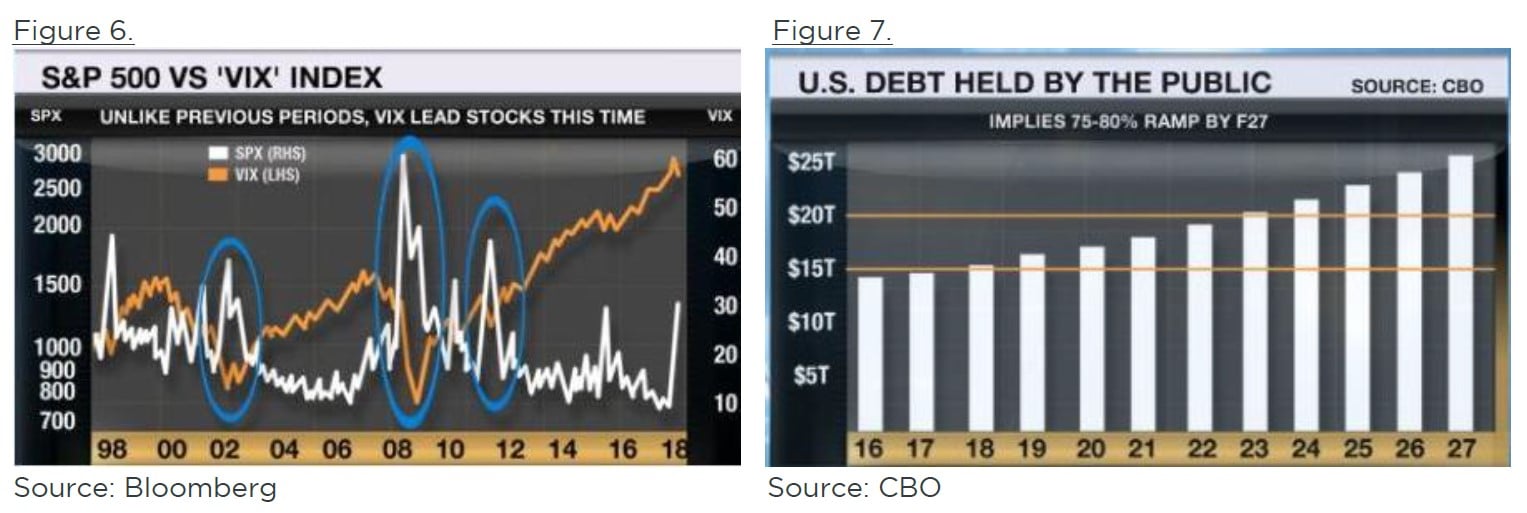
All types of investors were rocked by this quantitative hurricane, be they categorized as value versus growth or retail investor in contrast to the biggest of pension funds. Look closely at Figure 6 below to see why the scenario was different this time. The white line is the VIX and it's on the right axis; the orange line is the S&P 500 and it's on the left axis. Inside the 3 blue circles you can see that a decline in stocks lead an increase in the VIX. Now look at the far right side and you can see that this time the VIX leads stocks.
Then over the weekend of February 3/4 the lunacy of Trump's fiscal policies was widely discussed in the media. After ramping the deficit via tax cuts that offered a questionable multiplier effect in GDP in December, expectations of a further $300B two-year spending bonanza caused the Congressional Budget Office (CBO) to up its F2019 deficit forecast to almost US$1.2T or 5.5% of GDP. While such action would cause Keynes to roll over in his grave, the hypocrisy of the GOP should put them in their grave. Pro-cyclical, deficit financed tax cuts and spending increases in a full employment economy that increase the structural fiscal deficit just don't make sense.
Investors quickly realized this largesse would lead to even more Fed tightening and higher interest rates, amidst the issuance of even more debt. Figure 7 from the CBO estimates that the amount of US Government debt held by the public will grow from less than US$15T today to more than US$25T in 9 years, an increase of 70%. In a decade that global demographics will ensure there's less savings to buy bonds than this decade that's not a good backdrop for the prices of either bonds or stocks.
This story helped equity trading start off on a rocky footing on Monday, February 5th. In turn, this weakness caused technical and momentum equity indicators to be breached creating new sellers, quantitative traders called trend followers. Then as the week progressed, fundamental sellers joined the party, locking in gains. According to Thomson Reuters, net outflows from mutual funds reached $23.9B last week while the number of shares in the world's largest ETF, New York ticker SPY, has fallen 9.6% or roughly $28B during the past week.
A second reason I proffer that "market structure" issues related to volatility catalyzed this decline is because volatility did not concurrently enter currency markets. In addition, the spread between the yield on the Bloomberg Barclays Investment Grade (IG) Bond Index remains the tightest it has been to Government bonds since 2007. Lastly, as of the time of writing, volatility in the usually more volatile Emerging Market (EM) stocks had been less than that seen in US stocks.
Hence while it's true that in light of the rocket launch start to the year, rising yields recently became an equity market headwind, the above points demonstrate that it was the crowded short volatility trade that triggered this correction.
Totalling up the damage, from January 29th through 1:40 pm ET Friday, February 9th, the S&P 500 fell 11.8%, before bouncing off its 200-day moving average with a 70 point end-of-day ramp higher, to close 8.75% below its recent high and 7.23% month-to-date.
Here at home, Canada's TSX hadn't fared as well during January, falling 1.59%, as utilities, telecom and energy stocks each declined roughly 5%, despite oil hitting $65, up 7% for the month. Notwithstanding this underperformance, when US markets tumbled, so did the TSX. From its January 30th peak, the TSX fell 8.95% through midday Friday, February 9th, ending that day down 7.4% from its recent peak, 5.75% month-to-date and 7.25% year-to-date. Even Canadian bank stocks succumbed, falling 4.6% since the end of 2017. In fact, the TSX is now down from the end of 2016!
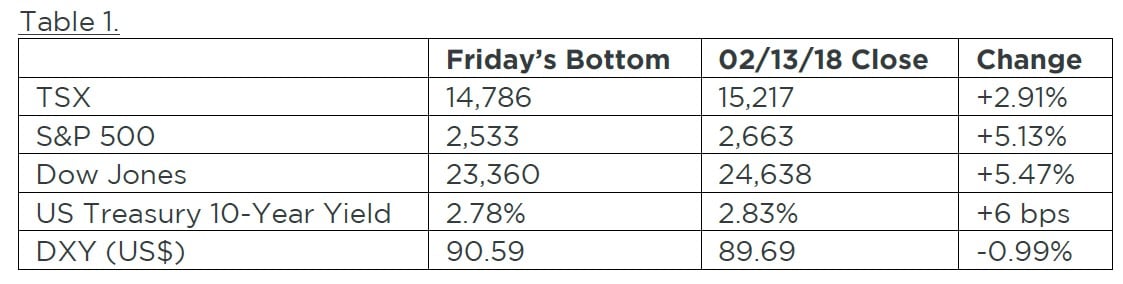
Since those mid-afternoon bottoms, the DOW, S&P 500, and the TSX have rallied 5.5%, 5.1%, and 2.9%, respectively. As shown in Table 1, as of the close on Tuesday, February 13th, markets remain down smartly month-to-date and year-to-date for 2018. And now for the obvious question, what happens next!
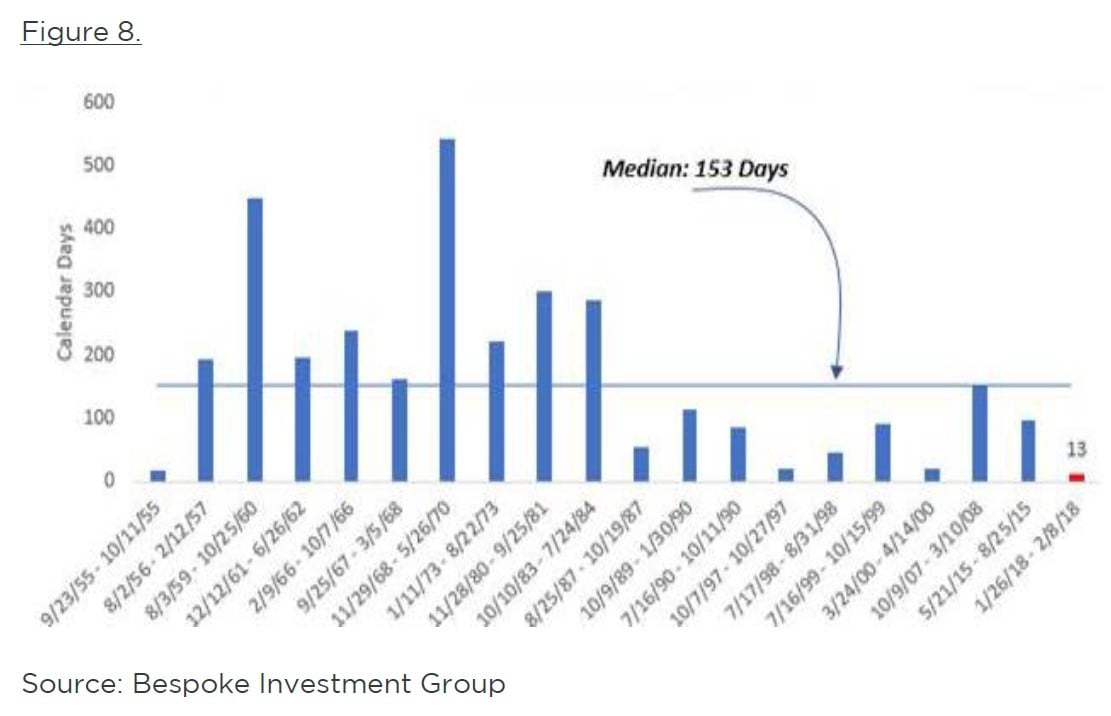
As can be seen in Figure 8, according to Bespoke Research, going back to the early 1950s, the median time it has taken for the S&P 500 to recoup a drawdown of at least 10% has been 153 days.
It's true the economic and fundamental backdrop for equities remains strong - synchronous global growth (even if it's peaking), improving capital spending intentions, consumer balance sheets that are generally strong enough, and still low interest rates. Also, the banking system is much stronger today. Consequently, I do expect stocks to settle down and rally higher, likely hitting new highs in markets including the US, possibly so in Canada.
However, I believe two points imply this market event signals that a regime change has begun/is imminent and that this next high could be the last new high.
First, the following points highlight that the march towards tighter monetary policy has begun:
- March 2018 will mark the 6th hike by the Fed this cycle and in the past that 6th hike typically marked the beginning of rising rates at the long end of the curve
- the growth in US money supply has declined from 11% to 7% during the past year
- to date mortgage rates have climbed 0.98% and 0.5% in the US and Canada since their bottoms in 2016
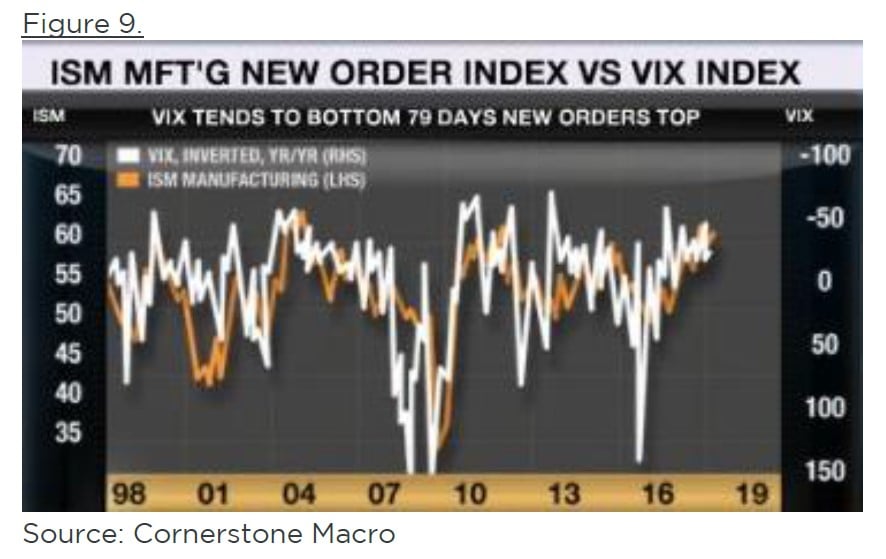
Second, it's likely that the volatility in stocks has bottomed. Figure 9 pairs the inverse of the year-over-year change in the VIX index on the right axis against the ISM Manufacturing Index on the left axis. According to Cornerstone Macro, on average the VIX index bottoms 79 days after the ISM Manufacturing Index peaks. Further, the VIX has typically surged 60 days after it bottoms. Remember, the long term average of volatility for the S&P 500 has been 17, two times the level experienced during 2017. Expect a new era of volatility as the world adjusts to higher interest rates after a decade of ultra-loose monetary policy.
Whether this next new high is the final high of the cycle has much to do with the unpredictable Mr. Trump. For example, trade wars, currency wars are both possible 2018 events that could be game changers. If corporate America ramps capital spending and wage gains accelerate, then the number of Fed rate hikes could increase and their pace quicken. Two weeks ago, 2.75-2.80% on the US 10-year bond sure seemed to be the line in the sand for stocks, and while I expect long rates to back off and the curve to re-flatten in the near term, I expect the set-up exiting 2018 to be quite different.
In addition to significantly greater net coupon issuance south of our border and a Fed QT program that will be 150% larger than it is today, the policy regime in Europe is poised to change.
In Germany, assuming the members of the Social Democratic Party (SPD) vote to accept their party's alliance with Chancellor Merkel, Olaf Schultz of the SPD is expected to become the Minister of Finance. It's thought that the consequence of such a shift could see Germany strike a deal with France's Macron that would see Germany finally loosen up its purse strings, amidst EU real economic growth that is currently forecast to hit 2.3% in 2018.
Meanwhile, the ECB's bond buying program is scheduled to end September 30th, and before the end of 2018 it's expected that German hawk and Head of the Bundesbank Jens Wiedmann will be named to replace Mario Draghi during H2 2019. Eonia, the EU's equivalent to the Fed Funds rate is currently pricing in 3 rate hikes by the end of 2019.
Global interest rates are finally poised to go higher, so is volatility. These factors suggest, in contrast to recent years, the real economy will outperform the financial economy during the next year.
Investors should watch for subtle shifts in investor activity, whether it be value stocks finally outperforming growth equities or more importantly whether traders begin to "sell the rallies" rather than "buy the dips". I'm not going to try and time the market, but 2019 is likely to be the year when we enter the first real bear market that the majority of investors in today's markets have never seen. Be prepared!
At Forge First we offer solutions that can help investors navigate the uncertainty in today's world. Our funds are designed to prudently and responsibly manage capital with three goals in mind - manage risk, minimize losses and earn a competitive risk-adjusted return for investors. Since August 2012 inception our funds have generated positive returns in down and up markets. Please don't hesitate to contact us if you wish to learn more about our offerings, and for more information please visit our website at www.forgefirst.com.
Thank you,
Andrew McCreath, CFA
President and CEO


