
We are seeing what seems to be more and more likely to be a bullish pattern, indicating a break higher than the peaks reached in 2016 on its way within the next year, if not sooner. Technical analysis shows us an ascending triangle formation. With this information, it is important to keep in mind that our technical analysis focus is on the movements of the large buyers and sellers in the market along with the trends that appear through the observation of their behavior.
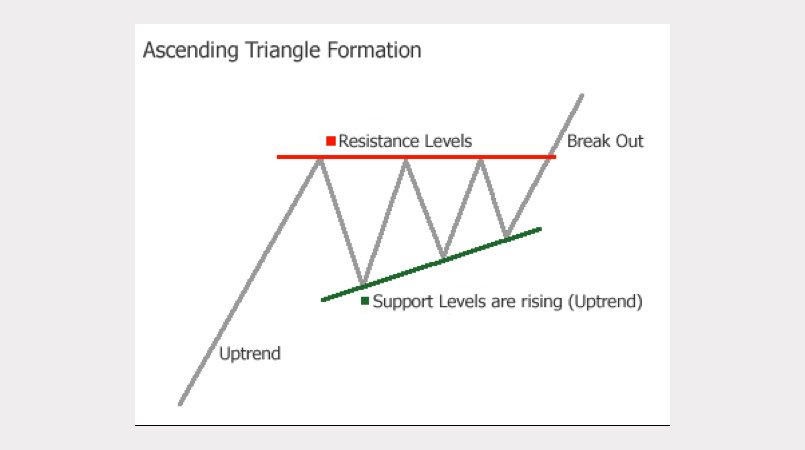
An ascending triangle forms in a consolidation pattern with an obvious overhead resistance (supply of sellers) can be seen at a recognized level. At the same time, buyers show up at increasing levels over time. An ascending triangle indicated that buyers are entering the market more quickly than sellers are leaving, creating the bullish bias. Here’s an image from technical analysis textbooks representing this pattern:
Take a look at the gold market movements shown below. Here, observe the way sellers show up around the peak of $1378/ounce reached in 2016, reaching down through $1355. Since then, the horizontal resistance zone shown here has been challenged five separate times, marked one to five in red:
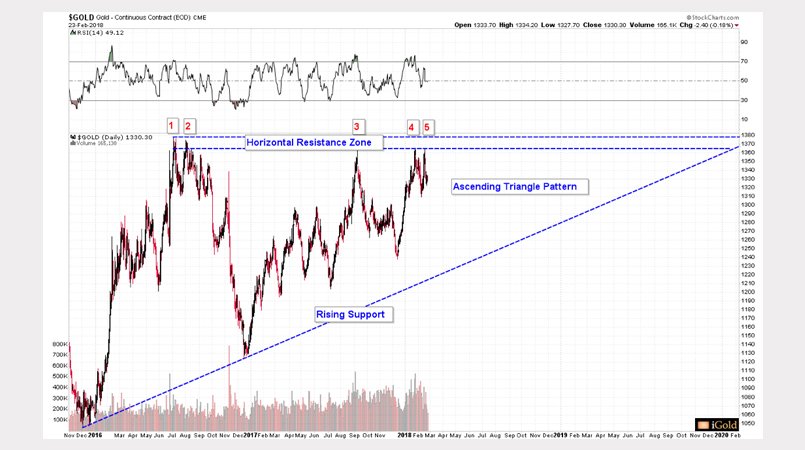
Looking at this information, where can we find the large buyers? Here, from the low of $1045/ounce at the end of 2015 can be seen an increasing trend of buying support. They first appeared at the correction of $1122/ounce at the tail end of 2016. From there, buying continued at lows that were increasing until December of 2017 with gold at $1236/ounce. These lows created the foundation for the increasing support line, seen in blue, which converged with the horizontal resistance zone.
The Important Things to Know about Ascending Triangles
The most important thing to keep in mind regarding ascending triangles is a horizontal resistance zone with increasing support growing over time. To simplify this, just think of this as the chipping away of the influx of sellers over buyers at each stage of short-term peaking. Buyers are purchasing gold at higher and higher stages while sellers stay and sell within a pre-defined zone. What about this indicates a bullish outcome?
This recurring transfer of gold from sellers staying between $1355 and $1378 to buyers at levels that continue to increase indicates that when that last seller within this zone has sold and left, buyers will be left to pay even higher prices than those during the consolidation timeframe. The end result creates a growing continuation track.
Keep in mind that while it looks as if this pattern could keep going through late 2019, ascending triangles tend to resolve in a higher or lower break in the time around two-thirds to three-quarters through the pattern. Because this pattern would last around four years- from 2015 to 2019- it is our guess that a breakout will happen this year.
Pattern Goals
Early goals for an ascending triangle could equal out to the amplitude of the earlier consolidation, added onto the point of breakout. To equal this from 2016’s high to 2015’s low, we take $1045 from $1378 and get $333. Adding this number to $1378 shows a long-term goal of $1711/ounce.
Keep in mind that this is only one goal, a reasonable guess of a successful breakout higher than the high reached in 2016. Markets are always fluctuating and so it is imperative that we remain closely watching for changing variables and new progress.
With this information, our technical goal for a break higher than the peak of 2016 with the information from the ascending triangle pattern we expect gold to sell for $1711/ounce, likely to occur six to 18 months following the breakout point. If this happens this year, as is our expectation, at that time we will begin looking out for the next target to be reached by the middle of 2019 through early 2020.
Summing up Gold’s Pattern
Since the end of 2015, gold has been undergoing more and more of a constructive consolidation, with deeper lows and horizontal highs. This pattern makes it appear likely that a large number of sellers exist in the $1355-$1378 area. We estimate that when gold tops this area, it will be pushed higher. If this rising support fails then that would be the only sign that buyers are not as focused as they seem to be from the 2015-2017 pattern. Should this support hold, then we can feel certain of particularly higher goals to hit by 2019-2020. Watch this space for continuing updates as this pattern develops.