
When a host of bank analysts predicted the most recent market downturn, that normally notable achievement was bookmarked by something even more statistically unusual: Not only did Wells Fargo analysts Christopher Harvey and Anna Han correctly predict the most recent drop in the market – they also identified a mean reversion point to buy on a dip. As if to back up this mean reversion prediction, Bank of America Merrill Lynch’s Savita Subramanian and his equity quant team looks at market data in the wake of the 411 point slide in the Dow Jones Industrial Average on Monday and Tuesday and observes the market is “still a long way off” from one of his mathematical sell indicators.


Upside deviation is a different risk factor than downside deviation
It wasn’t just Wells Fargo that accurately predicted the week’s early sell-off, but Goldman Sachs as well joined the crash watching party in a weekend report that preceded a massive slide in US stocks Monday and Tuesday. BAML, for its part, also made a market crash call in early December.
Stock markets have very different downside deviation modeling than upside. When selling occurs, and algorithms detect mounting momentum, the action can be sharp and fast, a statistical fact. When US stock markets move higher, that activity occurs much slower, as today’s more than ten-point advance in the S&P 500 index illustrates.
But the recent downside price activity might appear more of a buying opportunity to Subramanian, who looks at several quantitative factors.
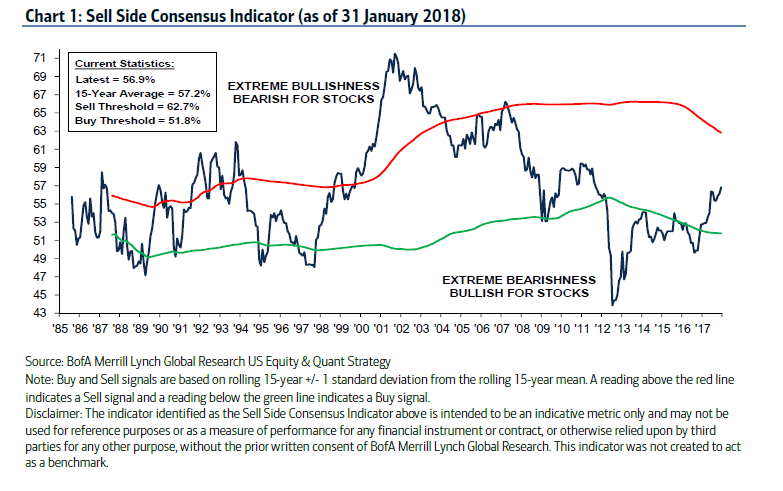
Take market bullishness, for instance. In January BAML’s “Sell Side Indicator,” which benchmarks “Wall Street’s bullishness on stocks” is still in a buy region. While it ticked up one-tenth from 56.8 to 56.9 in January, marking the fourth consecutive month of improvement and hitting its highest level in over six years, it still had not hit sell territory, which is just overhead at 62.7.
The Sell Side Indicator is a contrarian model: when investors get too optimistic or bullish, this actually could signal a market top, is the working assumption.
The Sell Side reading comes as the Federal Reserve Bank of Atlanta’s quantitative team released an eye-popping 5.4% Gross Domestic Product (GDP) quarterly estimate. Economic growth, as measured by GDP, has been rather anemic since the 2008 market crash.
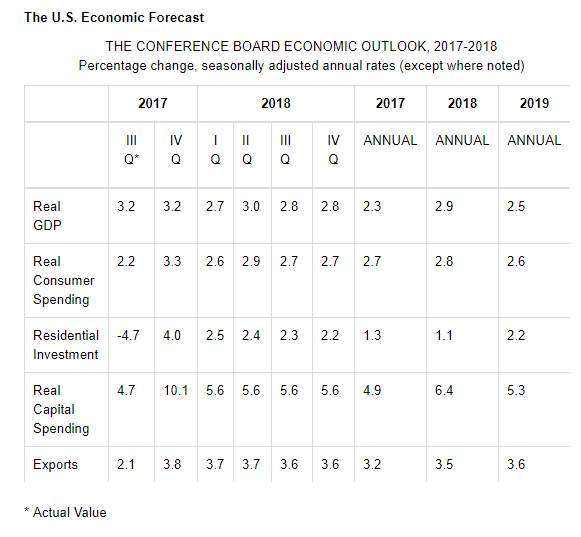
The widely watched Conference Board, by contrast, predicts real GDP to grow by 2.9% in 2018:
The strength of the global economy, especially in key trading partner economies like the Euro Area and China, provide further support to the US economy and help to keep the US dollar relatively weak, boosting exports. However, it is unclear whether sufficient spare capital and labor are available to meet burgeoning demand. Undertaking fiscal stimulus during strong economic times may overburden capacity, and trigger faster inflation. So far, the Federal Reserve plans to continue raising rates at a modest pace, perhaps three times next year. But these plans could change if inflation surges, slowing both investment activity and growth.
Does this mean the bull market will last forever? Particularly as central banks withdraw market stimulus?
But be clear, BAML’s quant team is no raging bull. Rather, they recognize the nuance and look at both sides of the issue.
“And while we are still a long way off from the current ‘sell/ threshold of 62.7, at the current pace, we could reach those levels by January 2019,” he wrote, pointing to a moment when modeling could indicate a value readjustment in market prices could take place. “Whereas this model is based on comparing today’s sentiment levels vs. the prior 15 years, there is evidence that sell signals have higher efficacy relative to shorter histories and would imply a more bearish outlook.”
In other words, watch for a market correction after the 2018 mid-term election. But for now, the stock market "is strong like bull" and has room to run higher on a valuation standpoint, BAML quant work suggests.


