A good year for equities, 2017 also looked a little strange at first…
It was a terrific year for stocks in 2017 up and down the asset class scale and across much of the globe. Yet it was also a seemingly odd year, and it played out much differently than we thought it would. A second consecutive year of double-digit returns for small-cap stocks, with the Russell 2000 Index gaining 14.6% in 2017,1 was more than welcome, of course, even as returns also defied what we would have anticipated against the backdrop of a rapidly growing domestic economy and a rebounding global one. While large-cap’s relatively higher returns in 2017 made sense to us in this context, we also expected that small-cap would draw the bulk of its strength from cyclicals and value stocks in this healthy environment.

So we were surprised to see certain growth and defensive stocks take the lead early in 2017 after lagging—in some cases significantly—in 2016, a year that marked its own significant (and in our view favorable) leadership reversals to cyclicals and value. Over the last three years, then, we have transitioned from 2015’s very narrow, growth-led market to 2016’s broader move driven by cyclicals and value stocks to 2017, in which growth reasserted leadership while value lagged significantly.
At first, we chalked up this apparent oddity to the market’s long history of refusing to behave in a logical fashion, at least over the short term. As we parsed the data more closely, however, we were able to more accurately decode what happened.
First, the advantages enjoyed by growth stocks and defensives within the Russell 2000 came disproportionately from Health Care, which rose 35.5% in 2017, making it by far the best-performing sector within the small-cap index. Rising more than 50%, biotechnology was particularly strong, bouncing back from a corrective phase in 2016 while pharmaceuticals also made an impressive recovery, climbing 37.2%. In aggregate, five of the six industry groups that comprise the Health Care sector in the Russell 2000 outpaced the overall index in 2017.
It was a terrific year for stocks in 2017 up and down the asset class scale and across much of the globe.
Following Health Care, however, were four sectors in more cyclical areas, each of which also beat the small-cap index: Consumer Discretionary (+15.6%), Industrials (+19.8%), Information Technology (+17.4%), and Materials (+16.7%). Among the index’s largest sectors, tech is also arguably its most diverse, embracing a mix of cyclical growth and value companies. Two of its more growth-oriented industries—Internet software & services (+28.4%) and software (+27.3%)—did very well while two of its more cyclical industries—electronic equipment, instruments & components (+23.9%) and semiconductors & semiconductor equipment (+15.2%)—also had index-beating returns in 2017.
What, then, contributed most to the odd disparity in small-cap results between cyclicals and defensives, value and growth? An underwhelming, low single-digit performance from banks was arguably the major factor. Slotted in the Financials sector, banks had a weighting just shy of 11% in the Russell 2000 at year-end, larger than six of the 11 sectors in the index, which gives their performance a meaningful impact. (In the Russell 2000 Value Index, their weighting was just shy of 20% at year-end—larger than any other sector in the style index.)
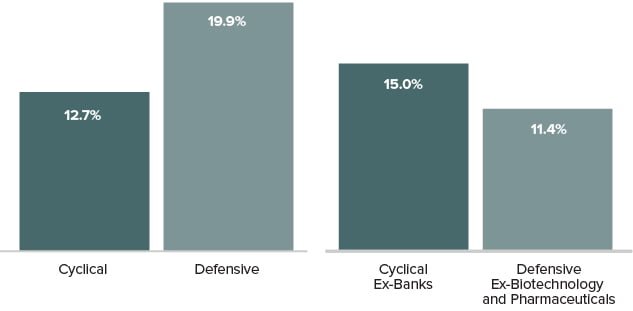
Anemic returns for small-cap banks thus played a major role in relative disadvantages for both cyclicals and value. We find the following illustration especially revealing: defensives were up 20.0% in 2017 versus 12.7% for cyclicals. With banks, biotechnology, and pharmaceuticals excluded, however, cyclicals showed better absolute and relative performance—up 15.0% versus 11.4% for defensives.
A Different Picture Emerges Ex-Outliers
2017 Russell 2000 Cyclicals vs Defensive Sector Returns
Cyclical and Defensive are defined as follows: Cyclical Consumer Discretionary, Energy, Financials, Industrials. Defensive: Consumer Staples, Health Care, Real Estate, Telecommunications Services, Utilities.
We think this outlier excluding comparison goes a long way toward explaining why results for cyclicals versus defensives and value versus growth at first glance looked so strange in a period of economic acceleration.
Are Small-Caps Poised for Another Shift?
After an encouraging 4Q17, can small-cap cyclicals take the lead going forward?
Being narrower, growth-led markets typically create challenges for active managers, who tend to embrace a wider swath of companies. So it was not surprising that results for domestic active small-cap strategies were more varied, and we were pleased to see a number of market-beating performances for a select number of approaches.
No doubt, the intertwined effect of strong absolute and relative results for certain cyclical sectors and vibrant global economic growth was the dominant factor. So while active strategies faced crosscurrents during the year as investors revisited more speculative issues, they were also bolstered by the expanding global economy.
We expect investors to increasingly focus on individual company attributes, especially cyclical exposure and company-specific risks.
This raises the question of when and how—even if—the market’s response to the quickening pace of global growth will mark a more pronounced shift to cyclicals. A clue may have been found in a reversal that occurred in the fourth quarter, when small-cap cyclicals enjoyed higher returns than defensives, which is typically the case in a growing economy. After trailing through the first three quarters of 2017, small-cap cyclicals advanced 3.9% while defensive stocks were up 1.9% (and the Russell 2000 was up 3.3%).
Going forward, we expect investors to increasingly focus on individual company attributes, especially cyclical exposure and company-specific risks. Our view is that this performance pattern should extend into 2018.
When it Comes to Small-Cap, it’s the Companies, not the Indexes
Its high valuation makes the Russell 2000 Index look risky, but numerous opportunities can still be found in small-cap
Based on this view, we believe the opportunity for small-cap investors is not the index itself or the broader asset class as a whole—it’s in select companies in the asset class. In a similar vein, we think that investors should lower their expectations for overall small-cap returns—which is why we believe selectivity has been so critical of late, and why we are increasingly convinced that it will remain so in 2018.
Both the lofty state of small-cap valuations at the end of 2017 and recent performance patterns suggest that returns are unlikely to stay as elevated as they have been—for the index, growth stocks, and defensives in particular, but not necessarily for certain cyclical small-caps. We suspect that success over the next few years will hinge on making careful selections and maintaining discipline—in essence, the time-honored argument for the importance of active small-cap management.
We see global growth as a positive for stocks. But the market may well deviate from what the economy is doing in the months ahead.
A look at five-year results for the Russell 2000 and Russell 2000 Growth best clarifies our thinking, as both exceeded their long-term averages. The small-cap index’s 14.1% five-year average annual total return for the period ended December 31, 2017 ran appreciably higher than its 10.6% monthly rolling five-year average since inception (12/31/78). The spread was even more pronounced for growth—a 15.2% five-year average annual total return for the same period versus its 8.6% monthly rolling five-year average since inception.
These higher-than-average returns simply do not look sustainable to us over the long run. To be sure, while we are optimistic about the prospects for select small-cap companies, we remain firm believers in reversion to the mean for the index.
Latest Returns Much Higher Than History

For context, we invite investors to consider how the metrics for the Russell 2000 stack up compared to a fundamentally strong small-cap business with positive earnings and healthy cash flows from operations. At the end of 2017, more than 34% of the companies in the small-cap index had no earnings compared to only 25% at the end of 2007. The index in aggregate also had higher leverage than it did 10 years ago: at the end of 2017, the weighted average long-term debt to capital ratio2 for the Russell 2000 was 35% versus 29% at the end of 2007.
Add to all this the fact that small-caps have not seen a pullback greater than 6.4% for nearly two years dating back to the last small-cap trough on February 11, 2016, and the Russell 2000 looks very risky to us, especially compared to the opportunities to be found in individual small-cap businesses.
From our perspective as small-cap specialists, all of this makes a small-cap correction look increasingly likely in 2018. Financially sound companies with growing earnings and modest valuations look far better positioned to us for the kind of lower-return market we are anticipating. Our expectation for annual small-cap returns falls in the 5-7% range over the intermediate term. It’s also worth noting that five-year periods in the zone of 5-10% for the small-cap index have been those with the biggest outperformance spread for active managers.
Two other points are worth emphasizing. The first is to offer a seemingly counterintuitive word of caution about the expanding global economy. As excited as we are about the current period of synchronized global growth, we have also observed that Main Street and Wall Street do not always walk hand in hand. Market cycles and economic cycles are different animals. As economic news continues to improve, there is no guarantee that the market will match its pace.
Ultimately, we see global growth as a positive for stocks. But the market may well deviate from what the economy is doing in the months ahead (which is fairly typical) as investors try to sort things out after an almost 10-year bull market for large-caps and a nearly two-year upswing for small-caps.
Our second point is to highlight the enormity and diversity of the U.S. small-cap universe. This goes beyond the more than 2,200 publicly traded companies with market capitalizations between $100 million and $3 billion. It also pertains to performance and valuation. For example, the top two deciles of the Russell 2000 were up 121% and 51% in 2017, while the bottom two fell 55% and 28%. Given such wide dispersion, we believe that we can always find long-term opportunities.
Divergence: Russell 2000 Returns
The Small-Cap Opportunity: Global Growth in Cyclicals
We see leadership coming from small-caps in economically sensitive industries that blend profitability, relatively attractive valuation, and global exposure
As confidence in the economy solidifies, the mounting importance of earnings growth or recovery should benefit cyclicals—small-caps in particular—as it has in the past. Cyclicals have historically done best in exactly the kind of economic environment in which we now find ourselves. Valuations for small-cap cyclicals also look more attractive relative to defensives. Moreover, it seems that the end has come for the extended, 30-year bull market for bonds. Being far less yield sensitive, cyclicals should face fewer headwinds as rates rise.
We think investors should be focusing on these matters rather than tax cuts or high valuations for indexes. While the reduced corporate tax rate is an undeniable benefit for small-caps, its positive effect is only lasting insofar as it encourages productive capital investment and allocation (the key, in our view, to creating additional growth beyond the reduced rate).
As small-cap specialists, we see the accelerating global economy as the more significant development. Indeed, its effects can already be seen when one looks more closely at 2017’s returns. Companies in the Russell 2000 with no foreign sales were up 12% while those with foreign sales of 30% or greater advanced 19%.
Go Global
2017 Russell 2000 Returns by Percent of Foreign Sales
Together, these support the leadership case for small-cap companies with global exposure in cyclical industries that also possess quality in the form of high returns on invested capital. Russell 2000 companies with the highest ROIC did quite well in 2017, in fact. These kinds of businesses look best positioned to benefit from increasing economic growth—even in the event of a pullback. With selectivity and discipline being the keys, we see the opportunity for disciplined and select active small-cap strategies to shine in 2018.
1 It was also the first calendar year since its 1978 inception in which the small-cap index posted a return between 6% and 16%.
2 Long-term Debt to Capital is calculated by dividing a company's long-term debt by its total capital.
Equity Indexes—As of December 31, 2017 (%)
| 1YR | 3YR | 5YR | 10YR | |
|---|---|---|---|---|
| Russell 2000 | 14.65 | 9.96 | 14.12 | 8.71 |
| Russell 2000 Value | 7.84 | 9.55 | 13.01 | 8.17 |
| Russell 2000 Growth | 22.17 | 10.28 | 15.21 | 9.19 |
| Russell Midcap | 18.52 | 9.58 | 14.96 | 9.11 |
| Russell Microcap | 13.17 | 8.91 | 14.29 | 7.68 |
| Russell Global ex-U.S. Small Cap | 30.49 | 11.27 | 9.25 | 3.89 |
Article by The Royce Funds


