
A theme has become clear as we conclude the first month of trading for 2018: actions have consequences. Since the market crash experienced in 2008-2009, there has been an incredible amount of currency printing done by the “monetary wizards” at the world’s central banks. Never before have we seen such an amount of currency being printed, and this is just now beginning to show its consequences.
Approximately one year ago, we estimated that we would be seeing an important reversal setting up in global reserve currency, which is the dollar, and that is now coming true. Additionally, the trading of U.S. dollars for future or government bonds is now happening and it is looking to be a long-term trend-reversal.
A specific example of this: after three years of consolidation, only two weeks ago the dollar decisively cut below its critical 91-92 support zone on its index. It appears that we are looking at a long-term top for the global reserve currency, and we hypothesize that this will lead to record lows by the middle of 2020.
As this progresses, all hard assets, or commodities, are in the process of creating one of the best foundations possible. The opposite movements by commodities and the dollar are undeniably related.
Although all global fiat currencies have to be seen as ships sinking at the same time but at different speeds, the dollar is in a different situation. Because it is the global reserve currency, even if there were to be a flight from the U.S. dollar and its dominated assets, the repercussions would be so much larger than that of a flight from the Canadian dollar, Australian dollar, or the Euro.
Over the past ten years, a number of analysts have falsely predicted an upcoming decline in the dollar. Since 2008 we have seen no signs of a reversal, so it is difficult to imagine what information they were using for these predictions. But now the charts are showing signs. We have broken it down here for you, in a set of two embedded timeframes:
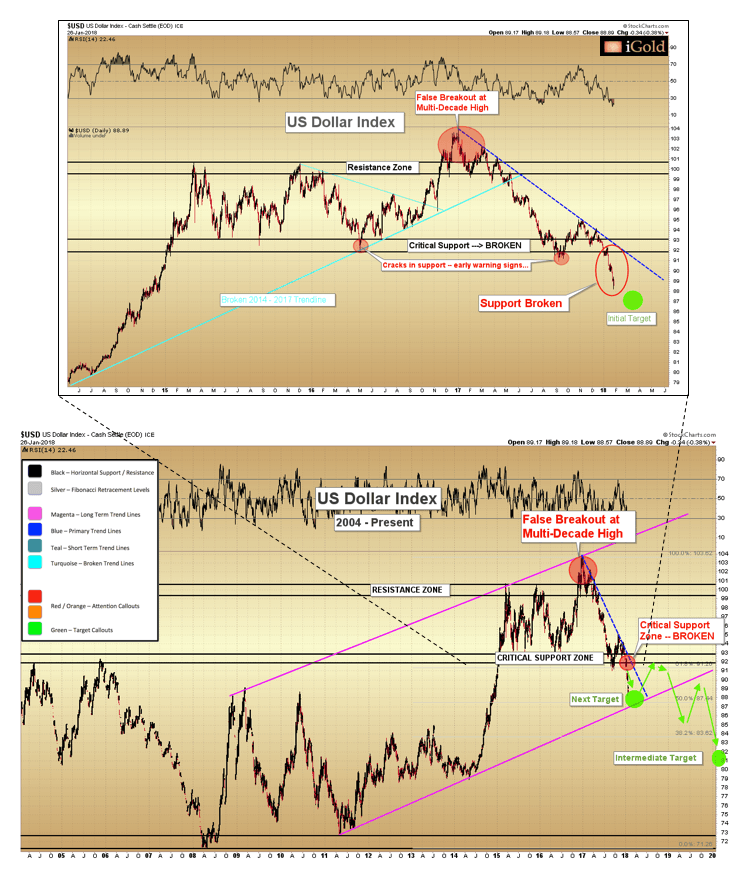
Over the course of the past year, we have posted about the importance of a false-breakout out of a multi-decade high, similar to the time the U.S. dollar tried to overcome its 100 resistance zone but was unable to sustain the growth and ended up falling back below 100 within three months. A market that has spent years advancing but is unable to sustain any consolidation breakout of importance is generally a sign of a multi-year trend-change.
A Critical Support Zone was evident, lasting for three years on the dollar index. Repeated tests of the support zone caused descending lows, or cracks in support, in 2016 and 2017, which acted as a warning that buyers were not as strong as they were expected to be.
Two weeks ago gave us the most obvious sign, a clear breakdown below the lower area of the Critical Support Zone. This sign will likely be a defining signal that will cause both positive and negative responses in diverse markets until well into the 2020s and is something that should not be taken lightly.
The charts show us that the dollar has broken at a lower level while the Federal Reserve has put into place five rate hikes over the past two years. Interestingly, although this information is clearly and readily available, mainstream media continues to report that rate hikes are a good thing for the dollar. But in black and white we can see that rate hikes have corresponded with the worst drops that the dollar has experienced, all the way back through 2001. We continue to advise you to confirm the information reported by mainstream media that contradicts examinations of the market numbers.
The Federal Reserve and other central banks like it cannot freely print currency to distribute without experiencing consequences, and they only raise rates when they are forced to because of market inflation expectations. The Federal Reserve takes its actions based on factors such as a declining dollar, falling bond prices, or increasing commodity prices.
All of these movements that we are reporting here are happening now.
Immediate Technical Considerations:
- The dollar has broken critical support in a confirmed reversal lower.
- We expect an initial target of 87 on the dollar index (shown in green on the chart), which coincides with the lower boundary of the long-term increases (the magenta line in the lower chart) within four to eight weeks.
- Once the initial target is reached, it will represent a high probability zone to coincide with a short-term top in the precious metals complex, plus or minus a week’s time. Traditionally, February and March see matched interim peaks in metals and it looks like this will continue this year.
- We expect a number of analysts to proclaim 87 to be the final low in the decline of the dollar. Their reasoning for this will likely be the expectations of upcoming Fed rate hikes, despite history telling us to expect the opposite, as well as a reference to the lower trendline support which is close to 87.
- We fully expect the market to support these calls regarding the bottom for approximately three to six months, coinciding with the traditional summer doldrums that we see with precious metals.
- 87 will most likely only represent interim support for the dollar.
- The repercussions of a false-breakout during a multi-decade high will make themselves known soon enough. It is our estimation that any recovery experienced by the dollar will not materially surpass the now-broken 91-92 Critical Support Zone on a weekly closing basis. Instead, we expect the dollar to round out over the course of the summer and by late 2018 to begin to seriously decrease and break its long-term rising trendline (as shown in magenta).
- We are expecting the intermediate-term target to be 81 on the dollar index and to be reached by late 2019. We have calculated this as equal to the amplitude of the consolidation above the Critical Support Zone (103-92=11), subtracted from the upper boundary of the zone (92-11=81).
The Declining of Both Bonds and the Dollar
We have recently posted regarding the possibility, which is now seeming even more likely, of a simultaneous top forming in both the dollar and in long-term U.S. government bonds. Remember that the 2001 to 2011 bull market in precious metals experienced only a falling dollar- bonds kept increasing in price throughout the ten year period.
Modern-day market watchers and participants have not seen both the dollar and bond prices falling at the same time, as the last time this occurred was in the 1970s, in response to the unsustainable spending in the Vietnam War and the expansion of domestic policies the U.S. was undergoing at the time. As precious metals rose through 1980, both the dollar and bond prices fell for almost nine full years.
The purpose of our posts is not political debate, however, it is undeniable that the present situation of perpetually being at war alongside the continued expansion of government debt programs is very similar to the situation the U.S. was in during the ending stages of the Indochina conflict. Between 1971 and 1980, while gold increased by over 2000% and silver increased by over 3000%, both dollar and bond prices were falling.
The Federal Reserve has printed as much currency as it could over the past ten years, and now we are seeing the consequences. It is our goal to provide an early warning, because otherwise, by the time the average American sees the theft that has occurred by the central bank, gold will already be hundreds of dollars higher than it is now.
In order to profit from the markets, we have to keep ourselves more informed than the average person. We have watched the dollar break down from a three-year topping pattern while gold is rounding out from a six-year base. These occurrences are only the first segment of what is sure to be a long-term trend in the works.
This Week’s Takeaway
It is important to take the market’s moves one step at a time as they progress because there is nothing like a market for throwing a curveball at you just when you think you’ve anticipated its next move.
Our expectations, for now, are the decline of the dollar towards the short-term target of 87, with a moderate rebound to follow mid-year. Any rebound experienced by the dollar will likely happen at the same time as a final retracement in gold prices in Q1 and Q2, before the 2016 peak of $1378 is exceeded once and for all.
No matter what, we are all living in interesting times.


