2017 was a banner year for US equity markets with the S&P returning 21.83% and the technology sector leading the way. Markets rose steadily through the year, which stands in stark contrast to the four distinct periods experienced during 2016. First and foremost, it is essential to emphasize that years such as this are not repeatable and in effect are the result of pulling returns forward from future years. We explained this reality in our 2013 year-end commentary in a way that is worth repeating:

While we did not see the economy’s traditional metrics of success reach “normalized” levels in 2013, it has been clearly positioned for the long awaited, but elusive escape-speed breakout from the Great Recession. In many respects, the stock market has now surpassed the real economy in its estimation of improvement. Given that reality, it is quite possible, almost probable that 2014 will be a better year for the economy than it will be for the stock market.
One reality we all must accept is how great years in the stock market tend to borrow from future returns, rather than enhance them. Heading into 2013, one could have reasonably expected to earn an annualized return of 6.67% – on par with the market’s average since 1925 – over the course of the next decade. The S&P 500 started 2013 at 1426. Factoring in a 6.67% annualized return the index would be at 2720 at the end of ten years. Assuming that despite last year’s near 30% return, this 2720 ten year S&P index target does not change, the expected return over the next nine years would be 4.39% annually, instead of 6.67%.[1]
In many respects, 2017 is the year that should have happened in 2016 for stock markets. The path to the underlying drivers of economic strength were all paved in advance of this actuality. That said, there were some unique stories that accompanied the market’s ascent along the way which we will cover below. It would be impossible to talk about 2017 in financial markets without broaching the topics of Bitcoin and tax cuts.
Throughout the year, Bitcoin and its fellow cryptocurrencies performed exceptionally well; however, in the fall, the crypto world seemingly captured the imagination of everyone. This peak in interest corresponded with pronounced strength into Thanksgiving and the imminent launch of Bitcoin futures contracts at the CME. The innovation behind Bitcoin, specifically the blockchain, is fascinating and holds tremendous potential; however, as often happens in markets, what started as a story backed by a solid fundamental thesis has warped into a speculative frenzy the likes of which we have not seen in nearly two decades.
The passage of tax reform towards the end of the year added the final bit of gas to propel markets higher. More interestingly, tax reform helped inject a greater degree of dispersion into financial markets than we have seen since before the crisis period. We think tax reform as a topic has been thoroughly picked over by the mainstream media; however, we would like to add a few incremental points to the conversation that often end up omitted:
- Think of industries and the playing field within industries on a sliding scale of competition from perfect competition to monopoly. The closer to perfect competition a given industry is, the less impact tax reform will have on the earnings power of the various businesses. It is only for those businesses who face a smaller degree of competition that tax reform will make a meaningful long-term impact on earnings power and thus valuation.
- One exception to the above is the situation of legacy retail competing with Amazon (NASDAQ: AMZN). While the prevailing forces are strong and hard to mitigate (i.e. the secular move of brick-and-mortar retail sales to ecommerce), tax reform is uniquely supportive of the legacy retail sector. Think of it as follows: Amazon manages its income statement to invest all profits in growing its business and as such, realizes little to no reported net income. With almost no net income, Amazon is not a Federal corporate income tax payer. In contrast, despite retail’s woes, the retailers generate considerable earnings and pay a higher tax rate than the average S&P constituent by virtue of having predominantly domestic businesses. Simply put: Amazon gets no benefit from tax reform, while legacy retailers get considerable benefit. This does not mean retailers can change the inevitability of the tide flowing from brick-and-mortar to online; however, it does mean that retailers will have proportionately more resources to dedicate towards competing with Amazon.
Bitcoin and the Superexponential Price-Mediated Feedback Loop
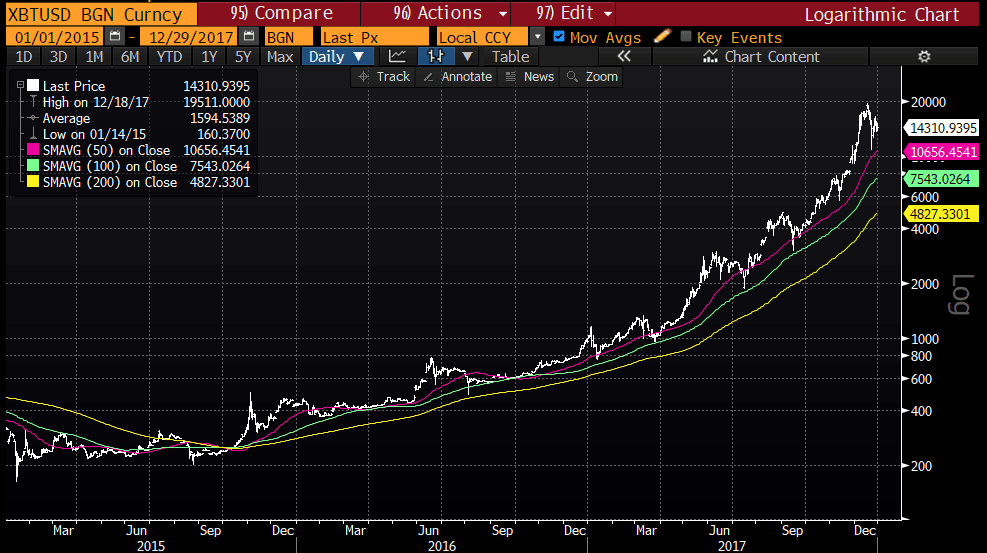
The following is a chart of Bitcoin on a logarithmic scale from the beginning of 2015 through the end of 2017:
The chart cleanly moves in the up and to the right direction, but there are two additional observations worth making:
- The Y-axis—it does not move up 1 unit at a time, but instead jumps according to a scale factor a little shy of 2. This is a power law in action, just like the Richter Scale for earthquakes whereby each 1 unit up the scale has 10 times the amplitude of the 1 before it (ie an earthquake that registers 7 on the Richter Scale is 10 times as strong as an earthquake that registers 6).
- The moving averages—look at the magenta, green and yellow lines following the price higher. These lines have a parabolic arch and are curved instead of straight. A straight line from bottom left to top right on a log chart shows something increasing at an exponential rate. A curved, upward-sloping line on a log chart shows something growing at a superexponential rate.
Very rarely in financial markets do we see something maintain a superexponential arch for so long. These phenomena are rare for a reason and deserve attention when they happen. In addition to being rare, they are also unsustainable. Stated simply and bluntly: this is exactly what bubbles look like. In 2017 one of the best books we read was Scale: The Universal Laws of Growth, Innovation, Sustainability, and the Pace of Life in Organisms, Cities, Economies and Companies by Geoffrey West. West is a theoretical physicist and professor at the Santa Fe Institute who has studied scale and growth in great depth. West’s explanation of the consequences of superexponential growth are incredibly relevant to Bitcoin:
[Superexponential] growth behavior is clearly unsustainable because it requires an unlimited, ever-increasing, and eventually infinite supply of energy and resources at some finite time in the future in order to maintain it. Left unchecked, the theory predicts that it triggers a transition to a phase that leads to stagnation and eventual collapse……there has to be a transition from one phase of the system to another having very different characteristics, analogous to the way the condensation of steam to water which subsequently freezes to ice epitomizes transitions between different phases of the same system, each having quite different physical properties….Unfortunately, for cities and socioeconomic systems the phase transition stimulated by the finite time singularity is from superexponential growth to stagnation and collapse, and this could lead to potentially devastating consequences.
….A major innovation effectively resets the clock by changing the conditions under which the system has been operating and growth occurring. Thus, to avoid collapse a new innovation must be initiated that resets the clock, allowing growth to continue and the impending singularity to be avoided.
….to sustain open-ended growth in light of resource limitation requires continuous cycles of paradigm-shifting innovations.[2]
There is a lot to unpack in the preceding excerpt. The most obvious point that carries through the entire section is the unsustainability of superexponential growth. The subtle point that we would like to expound on is the energy needed to drive Bitcoin. Bitcoin requires two essential forms of energy to move upwards:
- It needs net inflows of money.
- It requires increasing amounts of power to maintain the network.
We won’t go in detail on the power needs necessary to fuel Bitcoin, because the actual energy is the area most ripe for an innovative phase change that can engineer sustainability. This is not the case on the money side in any reasonable timeframe. (If you are interested in reading on the power requirements of the network, Wired offered a great primer in December titled “How much energy does bitcoin mining really use? It’s complicated.”)[3] The higher Bitcoin goes on this superexponential trajectory, the more money it requires to keep driving it. Price moves based on simple supply and demand. With an essentially finite supply, each new dollar coming in is used to cash out an existing holder. In other words, the newest investors in Bitcoin in effect are cashing out the earliest holders of Bitcoin who are intent on holding unless and until it hits a price worth selling at. If this sounds a little like a ponzi scheme it’s because there are very real parallels, though that is likewise the case with any bubble. This is the essence of speculative markets where the intent of the buyer is not to value the fundamentals underlying the asset, but instead to participate in the Keynesian Beauty Contest in search of a “greater fool” who will eventually pay a higher price.
Bitcoin today is in what Soros calls a price-mediated feedback loop. The newest buyers of Bitcoin are not people with a fundamental understanding of the technology or even a basic theory on what it might be worth. Speculators are merely buying because the price has gone up a lot with the hope that it continues to go up a lot. Elliot went into great detail on this in a blog post titled “The Rise and (Inevitable) Fall of Bitcoin.” [4] We covered a similar phenomenon, though far less extreme in our April 2015 Commentary on ETF Fund Flows.[5] Specifically, we looked at the relationship between fund flows and price in a dozen different sector-based ETFs and noticed something unique and odd in IBB-the biotech ETF. Here was the chart with the accompanying explanation:

Of the dozen plus ETFs we looked at, this is the only one where price and flow moved upwards in tandem. This is exactly what a price-mediated feedback looks like. The rise in price brings more flow, which drives price higher, thus attracting yet more flow. This is also the explanation for how momentum works and what it looks like in action. While in the past we asserted biotech was not in a bubble based on valuation metrics and the fundamental outlook, this right here is a very concerning development. The longer this persists, the more troubling it will be. While price and flow can keep driving each other higher, when one breaks down, the other too will follow. One of the foremost points we learned from Soros is that when price-mediated feedback loops break, they do not simply find a new equilibrium at the price’s present plateau. Rather, the feedback loop reverses and works in the opposite direction. Note that the move up and down in price and flow are both positive feedback loops—the disequilibrium-seeking forces in markets. As such, these relationships are inherently unstable [emphasis added].[6]
Sure enough, 2 months after the date of publication on our ETF fund flow report (5/11/2015), the biotech sector ETF peaked nearly 13% higher and promptly shed 40% over the next seven months. We are now nearing two years since the bottom of the reflex move lower in IBB and yet the sector has recouped only half of its losses from peak to trough.
Considering the Bitcoin move has been many times more extreme than biotech, we expect a more extreme flush out that will similarly take an extended period to recover from. In fact, the Bitcoin situation is far more akin go the Dot Com bubble in 1999 and to emphasize the point, consider that Priceline first neared $1,000 per share in 1999 and took a whole 14 years to finally get back to those levels. At its worst, Priceline had declined over 99% from peak to trough.
Priceline may not be a perfect example for what Bitcoin will do from here, but it does offer a good lesson. Cryptotechnology holds tremendous potential, but today the values are premised on speculative fervor rather than fundamental valuation. Speculative fervor is fleeting and when it ends, the price of the asset needs to find a floor and build a foundation where fundamentals can support the valuation. From that floor, to once again begin an ascent, the promise of the speculative fervor needs to be translated into tangible worth.
We are sure that in laying out our perspective in cryptocurrencies, the nuance will be misinterpreted by bulls and bears alike. Let us all remember one key fundamental fact here: there is little actual utility for Bitcoin today aside for international remittances. The initial promise was at least in part premised on Bitcoin as a transaction protocol and the combination of volatility and painfully slow clearing times make that a virtually moot point barring some phase change in the consensus of the Bitcoin community. To that end, the potential fundamental value is even lower today than when the transactional element was core to the thesis. It takes real utility and real value to develop a fundamental valuation to underpin the price of such an asset, not merely the potential for such development. We will continue to learn about the technology underlying Bitcoin and blockchain and explore investment opportunities and their respective merits. This pursuit will be taken with immense patience and caution. In anything with incredible long-term promise, there is far more risk in being too early, during a clearly euphoric phase, than in being a little late. Fear of missing out is not a fear that we at RGA actually feel anywhere in our bones.
Long end of the yield curve debt ceiling move unwind?
The following is a graph of the US Treasury yield curve today vs January 1, 2011:
Notice that the yield curve is far flatter today than it was in 2011, despite a strong economy and inflation gaining in velocity. This is counter to what one would expect, though there is a sensible narrative: a flattening yield curve today theoretically is an expression that bond investors expect the Federal Reserve Bank will raise interest rates and put the economy into a recession before inflation gets ahead of itself. Many are wondering whether this is the case. We think there is a different view worth exploring. Let’s look at a proxy for Treasuries that will show another angle to underpin our narrative on what we think happened and how this might play out from here:
The circled area above shows exactly when rates on the long end of the yield curve came down dramatically. Two external shocks happened within the circled space alongside a change in the Federal Reserve’s quantitative easing strategy:
- The US debt ceiling crisis
- The European sovereign debt crisis entered an especially acute phase.
- The Federal Reserve Bank hinted at and then commenced operation Twist
One of the big changes that occurred is European financial institutions, especially in the worst performing economies, started buying more Treasuries to balance their risk profile. Ireland is especially telling. In the beginning of 2011, Ireland was the 16th largest foreign holder of Treasuries. As of today, Ireland is the 4th largest holder, registering a 643% increase in their Treasury holdings.
Over the last six years, in aggregate, the Fed was by far the biggest purchaser of Treasuries as part of its quantitative easing (QE) policy. QE2 ended in the early summer of 2011. The Fed had been purchasing relatively short-dated Treasuries in the beginning of QE, because that is where the majority of issuance and thus liquidity is situated; however, in the Summer of 2011, the Fed introduced and then shortly after commenced “Operation Twist”—a name borrowed from a 1961 Fed initiative applying the same strategy. The stated intent of “Operation Twist” was to pull lower long-term interest rates. Up until 2011, the market’s implied interest rate expectation was decently higher than the Fed’s own expectations. To pull longer-term interest rates lower, the Fed announced it would use the proceeds from maturing short-term Treasuries (3 years or less) owned via QE1 and QE2 into longer-dated Treasuries (6-30 years). Today we can see clearly that the strategy accomplished its objective though it now looks like the effect has outlasted the Fed’s intent.
Today, with Europe healing and with the market now behind the Fed in expecting interest rate normalization, we think the time is right for the 2011 move in the long-end to entirely reverse. Europe’s sovereign yields have normalized and the Fed today is slowly unwinding their book of Treasuries by letting maturing bond proceeds revert to cash. This would be welcome news as equity valuations are near the upper-end of the fair value range and some yield from bonds would be a helpful addition to our portfolios should we decide during the year to move some of our exposure out of equities in anticipation of a more favorable return setup long-term.
The Reemergence of Dispersion
During 2017, while markets rose, dispersion collapsed. The following chart from KKR’s “Outlook for 2018” is insightful:[7]
Dispersion measures the degree to which stocks correlate with one another. The higher the dispersion, the more uniform the moves across markets. Beginning with the financial crisis and through 2015 correlation between stocks stayed above its long-term average (the horizontal red line in the chart above). At the end of 2016 dispersion started to emerge and then accelerated as 2017 went on. At the end of the year, there was as large a degree of dispersion between stock as there had been over the last 30 years. This is a great development for active investing.
Financial crises tend to inject volatility into markets during which time “all correlations go to 1.” In other words, during financial crises, everything tends to move together. It is notable how long this condition persisted even past what many would regard as the “end” of the Financial Crisis itself. We believe one of the primary forces behind this extended period of little dispersion has been the move towards increased indexation. Many forces have driven indexation, though with this too we can tie to the Financial Crisis itself: as markets recovered from the Crisis, many advisors and people alike concluded that indexation in buy-and-hold fashion is superior to an attempt to actively pick winners and losers. We explored this topic in greater detail in our October 2013 commentary.[8] For our purposes here, the most important point is related to one we made above about Bitcoin: financial markets (and by derivative, financial market participants) tend to take good ideas way beyond their logical extreme.
There were three distinct catalysts that helped dispersion reemerge:
- The Presidential election in 2016
- The passage of tax reform in 2017
- The rise in short-term rates
The first two of these events had traders betting on companies and sectors whose prospects were specifically changed by either actual or expected policy changes. Some of the most distinct winners in both were sectors whose primary business are domestic (in contrast to multinationals) and whose businesses are subject to regulatory oversight. The rise in short-term rates were a big boon to the financial sector and a source of pain for the sectors whose allocations over the prior decade had been driven by yield. Specifically, the worst sectors last year (from worst to best) were the utilities, the REITs and the staples. Each of these were treated as bond-like proxies and with the rise in rates and the expectation for more hikes yet to come, they were on the receiving end of considerable selling pressure.
The issue of dispersion raises an important question: is dispersion increasing a side-effect of markets rising? Stated another way, will dispersion remain high in the next market decline? We are inclined to believe that from here on out, dispersion should be more “normal” than had prevailed in the Financial Crisis and its wake. In the 2000-02 bear market there were abundant opportunities to make money being invested on the long side, so long as one stayed clear of the carnage in technology. In contrast, in 2007-09 everything collapsed together. It is hard to sit in our seat today and say exactly which areas of the market would best withstand the next bear, for there are yet to be obvious areas of overinvestment like the technology sector in 2000 and the financials in 2007 that will lead the way down; however, we have confidence that the nature of the next recession (and let’s not forget, a recession is an inevitability eventually) will be different than the last. To reiterate: the 2007-09 bear market was an actual liquidity crisis where deflation was the risk that imperiled the economy, whereas the next recession will be a normal Fed induced recession when inflation gets too high and the Fed thus raises rates to cool things off. By virtue of this difference in nature, a Fed induced recession will hit sectors and underlying economic fundamentals in a very different way than was evidenced in 2007-09.
If dispersion remains at these high levels, expect our portfolio activity to increase considerably from 2017. While 2016 was one of the most active years ever for us, 2017 was our single least active year yet. Amidst high market valuations, dispersion is the primary force behind uncovering new opportunities. We need not necessarily wait for broader market declines to make moves, but instead can find fertile hunting grounds in either out-of-favor sectors or those sectors on the wrong side of flows and rotation trades.
Everything is now Tech, Tech is now everything:
In the past, we have bemoaned the use of labeling and categorization with respect to industry and sector classification. While a necessary evil, the rise of indexation has led to pronounced mispricings where the categorization does not fit the business reality. These problems have been most acute with the existence of the technology sector. We most recently made this point in our Q2 2017 commentary by asserting that “Investors are realizing that companies either use technology to their advantage or risk obsolescence….The natural endpoint is where people stop thinking of companies as ‘technology’ or ‘retail’ and think about how a particular company is developing technology to entrench their business in the new commercial landscape.”[9] We maintain heavy “technology” exposure as a result of this worldview, yet the overlap with the label has at times led us to experience a higher degree of volatility due to certain exposure and factor unwinds.
In November 2017, the S&P Dow Jones Indices and MSCI announced that they will revise the industry categorizations pertaining to technology companies. The “Telecommunication Services Sector” was relabeled the “Communication Services” and will now “include[s] the existing telecommunication companies, as well as companies selected from the Consumer Discretionary Sector currently classified under the Media Industry Group and the Internet & Direct Marketing Retail Sub-Industry, along with select companies currently classified in the Information Technology Sector.” Further, “online marketplaces…regardless of whether they hold inventory” were moved into the “Internet & Direct Marketing Retail Sub-Industry.”
In effect, the Global Industry Classification Standard (GICS) has moved closer to acknowledging that we live in a world where technology is not a standalone sector, but rather a crucial piece of infrastructure enabling and impacting each and every facet of the economy. We welcome a world where investors think more critically about the underlying drivers of a business separate and apart from the adoption of “technology” generally speaking. For example, while Alphabet (NASDAQ: GOOG) is regarded by most as a technology company, as the company achieves immense scale, its earnings will increasingly be driven by the cyclicality of the advertising industry, Expedia (NASDAQ: EXPE) and Priceline (NASDAQ: PCLN) already are in position where their earnings are subject to the fluctuations in global travel and sentiment and PayPal’s earnings will eventually reflect the flow of payments. These companies maintains considerable runway for secular growth with the share of business moving from offline to online in each respective domain; however, the reality cannot be escaped in analyzing these businesses that they are indeed beholden to their end source of demand rather than some abstraction called technology.
Thematic trade in the financial sector—low valuations, strong fundamental backdrop, yield sensitivity, business cycle, easing regulatory environment, capital cycle in full swing!
We buy each position based on our bottoms-up analysis of a given business. We want to know that a company has a strong management team, excellent or improving unit-economics, reasonable growth prospects embedded in the market’s expectations and a fair price. One of the most useful screening criterion for us to find new investments is the development of a thematic thesis on a given sector or industry. While any given theme is of secondary import in actually allocating to a security, our use of themes as screening criterion are a) thoroughly fleshed out with data and analysis, and b) an explanatory force behind why our positioning tends to cluster around certain sectors. You can think of our overexposure to technology in this way—we have a prevailing thesis that technology is not actually a sector, but rather a collection of companies using technology to do business in a better way and we sought out companies within technology where that distinction was most acute between the price of the stock and our estimation of fair value for the business.
One other sector where we have maintained excess exposure to is the financials. In the most acute phase of the Financial Crisis there were bankruptcies and a frenzy of M&A activity. While such actions have been few and far between lately, globally, the financial sector is far more concentrated than it has been in the recent past. Setting aside the debate about the merits of such a situation from macroprudential considerations, we think this is incredibly supportive of the long-term profitability in our leading financial institutions. With underwriting standards remaining largely rigorous since the crisis, there is further support to the fundamentals underlying banks today. Despite these forces, financials as a sector continue to trade at nearly a four turn forward P/E discount to the S&P 500—a clear reflection of the residual stigma from the crisis period.
Financials stands to benefit from all three forces behind dispersion referenced above more so than any other sector. First, Financials by-and-large were on the receiving end of increased regulatory scrutiny following the financial crisis and that has reversed with the new presidential administration. Second, financials in the US tend to be predominantly domestic businesses taxed at the all-in U.S. rate. With tax reform, financials as a sector stand to receive nearly the full benefit of the change in statutory tax rate for businesses. Third, financial sector earnings are sensitive to the direction of interest rates. The Federal Funds Target Rate started 2017 at 0.50-0.75% and ended the year at 1.25-1.50%. This is a substantial increase that boosts potential growth tremendously at many banks and insurance companies alike.
We expect each of our financial holdings to benefit from the prevailing environment. The Charles Schwab Corp’s (NASDAQ: SCHW) earnings are the most sensitive to interest rates and will continue to grow well into the double digits. Envestnet Corp’s (NYSE: ENV) (technically an Information Technology, not Financial company) earnings are influenced by asset valuations, therefore rising markets will be a powerful tailwind to revenues, with earnings leverage in the coming year. JP Morgan (NYSE: JPM) stands to benefit from easing capital standards which should result in a better Return on Equity and a higher payout ratio, supporting strong dividend growth. The situation in Europe is perhaps even more advantageous on some of these fronts, where ING Groep (NYSE: ING) should be able to pay a considerable special dividend, expunging the excess capital regulators required during the crisis period and leading to a step-change in ROE. Meanwhile our insurers—Markel Corp (NYSE: MKL) and Exor (BIT: EXO)—will benefit from investing the bond portion of their float in higher-yielding securities, while the equity side benefits from alpha-generating investment management continuing to beat the S&P.
What do we own?
2017 was a strong year, with the vast majority of our holdings ending in the green. Of the three laggards below, only one remains a current position and we have increased our allocation to it considerably during 2017—Walgreens Boots Alliance. We covered Walgreens in our Q3 2017 commentary[10] and on January 12th, Elliot gave a detailed presentation on Walgreens at Best Ideas 2018, Hosted by MOI Global.[11] You can find his slides at the following link for our full thesis. Total returns are indicated based on the stock’s performance during our holding period within 2017 and are denominated in the US dollar.
The Leaders:
IAC/InterActiveCorp (NYSE: IAC) +88.73%
Trupanion (NASDAQ: TRUP) +88.6%
PayPal Holdings, Inc. (NASDAQ: PYPL) +86.52%
The Laggards:
Under Armour, Inc. (NYSE: UA) -24.95%
Walgreens Boots Alliance, Inc. (NASDAQ: WBA) -12.25%
AmerisourceBergen (NYSE: ABC) -9.10%
Best books we read in 2017:
The Structure of Everyday Life: Civilization and Capitalism, 15th-18th Century Volume 1 by Fernand Braudel – A far-reaching study of what daily life would look like for an average person in each region of the world covering diet, work, household, possessions and relationships and their respective evolutions across the covered time period.
Scale: The Universal Laws of Growth, Innovation, Sustainability, and the Pace of Life in Organisms, Cities, Economies and Companies by Geoffrey West – Scale offers several powerful mental models with broad applicability across the social sciences.
The Attention Merchants: The Epic Scramble to Get Inside Our Heads by Tim Wu – A fascinating look at the news, media and entertainment industry over the past century and its quest to capture increasingly large swaths of our attention. The historical templates offered in the book for the rise of nascent industries and the detailed color on the tactics used by information predators to capture our attention or insightful.
Merchants of Grain: The Power and Profits of the Five Giant Companies at the Center of the World’s Food Supply by Dan Morgan – The intersection of history at the industry and global level is a captivating perspective on how cornerstone industries become enmeshed in some of the most important geopolitical events of any epoch.
Adaptive Markets: Financial Evolution at the Speed of Thought by Andrew Lo – Lo offers an entirely new economic paradigm incorporating the efficient market theory, behavioral economies and the collective lessons of the financial crisis. The work is ambitious, but accessible and a worthwhile read for anyone interested in finance and how it impacts society and touches our lives.
Thank you for your trust and confidence, and for selecting us to be your advisor of choice. Please call us directly to discuss this commentary in more detail – we are always happy to address any specific questions you may have. You can reach Jason or Elliot directly at 516-665-1945. Alternatively, we’ve included our direct dial numbers with our names, below.
Jason Gilbert, CPA/PFS, CFF, CGMA
Managing Director
O: (516) 665-1940
M: (917) 536-3066
Elliot Turner, CFA
Managing Director
O: (516) 665-1942
M: (516) 729-5174
[1] http://www.rgaia.com/december-2013-investment-commentary-our-2014-outlook/
[2] West, Geoffrey. Scale: The Universal Laws of Growth, Innovation, Sustainability, and the Pace of Life in Organisms, Cities, Economies and Companies. Pages 414-416.
[3] http://www.wired.co.uk/article/how-much-energy-does-bitcoin-mining-really-use
[4] http://compoundingmyinterests.com/compounding-the-blog/2013/11/11/the-rise-and-inevitable-fall-of-bitcoin-1.html
[5] http://www.rgaia.com/april-2015-investment-commentary-etf-fund-flows/
[6] Ibid
[7] http://www.kkr.com/global-perspectives/publications/outlook_for_2018_you_can_get_what_you_need#.WlgbCjQabu8.twitter
[8] http://www.rgaia.com/october-2013-investment-commentary-our-actively-passive-investment-strategy/
[9] http://www.rgaia.com/q217-investment-commentary/
[10] http://www.rgaia.com/q317-investment-commentary/
[11] http://www.rgaia.com/walgreens-boots-alliance-owner-operator-run-pharmacy-retail-leader/
Past performance is not necessarily indicative of future results. The views expressed above are those of RGA Investment Advisors LLC (RGA). These views are subject to change at any time based on market and other conditions, and RGA disclaims any responsibility to update such views. Past performance is no guarantee of future results. No forecasts can be guaranteed. These views may not be relied upon as investment advice. The investment process may change over time. The characteristics set forth above are intended as a general illustration of some of the criteria the team considers in selecting securities for the portfolio. Not all investments meet such criteria. In the event that a recommendation for the purchase or sale of any security is presented herein, RGA shall furnish to any person upon request a tabular presentation of: (i) The total number of shares or other units of the security held by RGA or its investment adviser representatives for its own account or for the account of officers, directors, trustees, partners or affiliates of RGA or for discretionary accounts of RGA or its investment adviser representatives, as maintained for clients. (ii) The price or price range at which the securities listed.
Article by RGA Investment Advisors


