Open Square Capital letter to partners for the fourth quarter ended December 31, 2017.

Dear Limited Partners,
“When the well is dry, we know the worth of water.” - Benjamin Franklin
We are on the cusp of the next oil super cycle. Period. Full stop. Almost every data point that we’ve collected and analyzed this year points to the fact that as inventories draw further, oil prices will inflect sharply before production can or will recover. We’ve said that underinvestment in the face of low oil prices will inevitably lead to a reckoning, and 2017 proved that to be correct. This was a historic year, where in the history of oil data tracking as we know it (encompassing three decades), inventories have never declined as much as this year, and the rate of that decline continued unabated as we ended the year. Despite the pundits, the market experts and the noise, we’ve held firm because “lower for longer” is proving as shallow of an analysis as “this time is different.”
Guess what? This time isn’t different. In the market, this time is almost never different because people act and react the same. More importantly, the incentives that drive them rarely changes. Have capital and generous lending terms? Drill baby drill. Lose money amidst low prices? Restrict liquidity and tout “value over volume.” Lower prices have sown the seeds of its own demise, and just as the remarkable decline of oil prices from $100 to $26/barrel became untethered from reality, the rise of energy prices will follow a similar path. A rationally based, fundamentally induced, price increase will give way to an emotionally driven rally when oil crosses the threshold from a supply shortage to an inventory shortage. World thy name is scarcity . . . get acquainted.
Our Q4
While we benchmark ourselves against the S&P 500, our energy concentration is driving our overall performance. Where energy prices go, we’ll likely go, and for most of 2017 that was sharply lower. Fortunately, we were able to salvage the year by finishing slightly positive.
Regardless, the broader market raced ahead and we failed to keep up given our concentration of energy holdings. Energy finished the year as one of the worst performing sectors, and for comparison the basket of oil producers (i.e., the ETF:XOP) ended the year down 9.3%. Even as oil prices rose, energy stock prices decoupled from the underlying commodity and the gap never closed. Despite these headwinds, our minor gains were thanks to some prescient portfolio reallocation heading into year-end. Much of our focus in Q4 has been priming and positioning ourselves to participate in the inevitable rise, and we can now do so without having to recapture significant losses.
Ultimately though, we benchmark against the S&P 500. Our goal is to outperform the index, and we believe taking this contrarian investment thesis can achieve stellar returns. We’ve been patient, but we’re ready, it’s time to ride the wave in 2018 because our time is now.
Energy in the New Year
Oil inventories have been drawing since mid-2016, and fell off a cliff in 2017. Make no mistake, this will continue absent a dislocation in the global economy. The material drawdown in oil inventories has shifted the burden of proof. We were one of the few funds to publicly make the case that today’s oil prices are unsustainable, and inventory levels have proven us correct. We no longer need to prove if there will be a shortage, that scenario is already upon us. The question now shifts to how soon can producers increase production to mitigate the decline, and how high will oil prices rise in the meantime.
Riding a Wave of Liquidity
While our fund focuses on the fundamentals (i.e., earnings, return on capital, etc.), it doesn’t mean we ignore liquidity. Here’s a quote from the famous investor Stanley Druckenmiller, founder of Duquesne Capital Management:
“[E]arnings don’t move the overall market . . . focus on the movement of liquidity . . . most people in the market are looking for earnings and conventional measures. It’s liquidity that moves markets.”
Liquidity is capital flow, it’s the wave of capital that can inundate and run-up the price of assets to once unthinkable levels (look no further than everything bitcoin related). It can also retreat, leaving abandoned assets and crestfallen investors when it recedes. As we described in our Q1 2016 letter
“Investors will push and pull capital in an attempt to maximize risk-adjusted returns. They direct it to asset classes that exhibit stronger growth, which usually translates to higher demand, increasing prices and healthier returns. So when so much capital flows from one asset class to another chasing returns, it builds momentum like a wave.”
Most fundamental investors ignore liquidity mostly because it’s the focus of traders, but in reality, whether liquidity (or the flow of capital) returns to a distressed asset will spell the difference between investing an an undervalued assets that recovers or a value trap. For us, we use fundamentals to preposition like surfers for the next wave. We’ll paddle to where we think the liquidity wave will form. Sometimes we’ll be there too early and have to paddle hard just to stay in place, but if we’re reading things correctly, we’re about to ride a monster one.
In the energy space, the flight of capital explains why energy asset prices have yet to recover, and the decoupling we noted above. The initial energy wave we caught in late-2016 turned into whitewash. As investors rushed into energy following the OPEC/Non-OPEC agreement to curtail production, high inventories prevented oil prices from climbing. For reasons we detailed in our prior letters (OPEC destocking leading to a Q1 build, investors sentiment, and US shale production growth), persistently high inventories took time to bleed down, and in a rising stock market, patience became the rarer of
commodities.
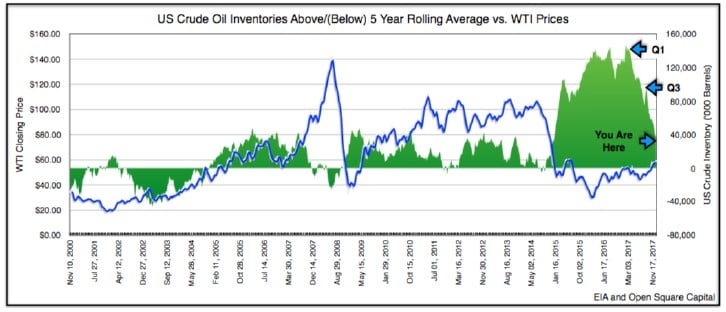
Energy investments are still a very deeply contrarian investment. According to the Wall Street Journal, about $800M flowed out of energy-focused equity funds last year through November. Numerous energy and commodity funds closed, which exacerbated the declines in 2017, leaving few specialists to bid up the price of these assets and reduce the outflow of capital. We previously showed this chart last quarter, but we’ve updated it here to the year-end.

The top line represents oil prices (WTI) and the bottom line the ETF XOP (the basket of oil producers). The gap between how energy prices have performed vs. energy stocks remains significant, but it will eventually close when investors look for assets to play rising oil prices. Improving oil fundamentals begets higher oil prices and higher oil prices begets rising asset prices. This chain of events is inextricably linked, which is why we’ve stayed with our thesis despite our results.
Our Chain
The first link in our chain has already been cast. Oil inventories are falling precipitously. Last year the world reduced excess inventories by close to 240M barrels, or almost 650K barrels per day (“bpd”). As of October, approximately 125M barrels remained and almost 70% of that was stored in the US. More recent US data indicates that even this 70% has fallen by over 20M barrels, which indicates that worldwide excess inventories are now below 100M barrels.
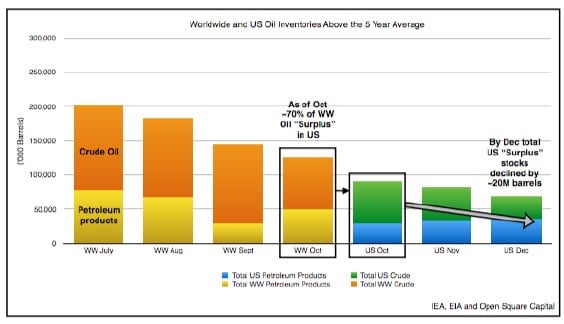
Undoubtedly, the global supply shortage will make short work of that in 2018, and the market will be rebalanced. Today, US inventories represents the last bastion of storage, and it’s running on fumes. Here’s another updated chart that shows the decline of excess crude inventories in the US.
See the full PDF below.


