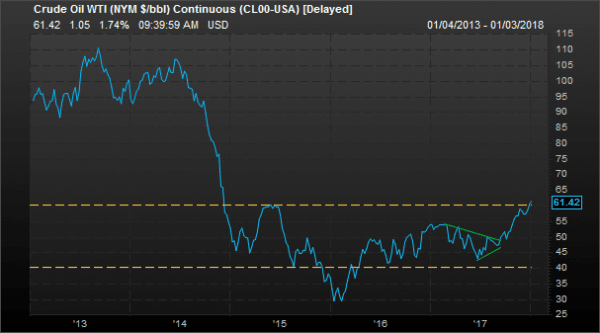
2018 has so far brought in the highest price of crude oil since late 2014 (chart 1), but we shouldn’t be surprised by the price action. Indeed, ignoring geopolitics for a moment, the fundamental picture for the crude markets haven’t been this favorable in years. As we will see, from inventory levels, to the US dollar, to economic growth, to the setup in the futures markets, most signs are pointing to higher oil prices ahead.
[REITs]One of the main drivers of oil prices is the relationship between production, consumption and inventory levels. As chart 2 shows, crude production in the US has recovered to mid-2016 highs, which in and of itself would be bearish for crude prices. But, the total inventory of crude has been falling over that period and now stands at the lowest level in 2.5 years. Chart three depicts total crude inventories (ex the strategic petroleum reserve) plotted with the blue line on the left, inverted axis, overlaid on the price of oil on the right axis (red line). Furthermore, oil consumption has remained strong too. The combination of lower stocks and growing demand has caused the days supply of oil to drop from 34 a year ago to just 25 now. Chart four shows the price of crude on the left axis (blue line) overlaid on the days supply of oil on the right, inverted axis (red line). These two series are highly inversely correlated, so a contracting days supply should result in higher prices. As we will see later, a continuation of this trend is likely.

This next chart shows the price of crude oil (blue line, left axis) overlaid on the US dollar spot index (red line, right axis, inverted). The -82% correlation between these two series isn’t a surprise given that oil is priced in US dollars. A falling dollar should result in higher prices of global commodities priced in dollars, all else equal. And a falling dollar is just what we expect in 2018 as a result of central bank policy convergence, the continued overvaluation of the US dollar relative to other major currencies, and expanding budget deficits in the US.
Another tailwind is stronger economic growth here in the US and abroad, which will have the effect on raising demand for crude products. The next chart shows the ISM manufacturing new orders index (red line, right axis), a gauge of future manufacturing expectations, overlaid on the price of oil (blue line, left axis). The breakout of the ISM new orders index to a level not seen since 2004 is a strong indication that oil demand will remain robust or even accelerate in the quarters ahead.
Finally, the commodity futures curve for crude oil has dramatically changed in recent months and has altered the incentives of players in the futures markets. The chart below shows the current WTI futures curve (orange line) and the futures curve from six months ago (green line). The current curve is downward sloping, meaning futures prices in out years are lower than the current spot price. In this state of backwardation, holders of futures contracts expect the futures price to move upward to converge with the spot price at the contract’s expiration, which makes holding futures contracts, as opposed to crude oil inventory, profitable. Conversely, six months ago the WTI futures curve was in a state of contango, meaning that out years futures prices were higher than spot prices. When a futures curve is in a state of contango, it’s profitable for investors to hold inventory of the underlying and sell it forward in the futures market at a higher price. In other words, six months ago it paid for investors to hold physical stockpiles of crude oil. Today, investors are better off selling their physical stockpiles and buying cheaper futures contracts. The result should be further pressure on crude oil inventories, which as we saw earlier would be bullish crude prices in general.
Article by Knowledge Leaders Capital


