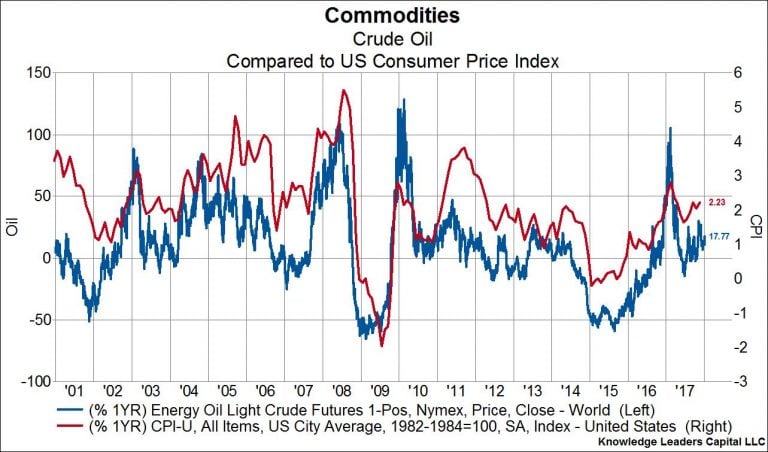
It’s no secrete that fluctuations in oil prices can lead to dramatic swings in headline price inflation, as chart 1 below shows. After all, not only does oil fuel the vast majority of transportation needs, it’s also a critical raw material used in consumer products far and wide, and much of the price swings in oil are passed on to consumers. With oil moving higher compared to year-ago prices, we should naturally expect a transitory boost to headline CPI as a result. In fact, if WTI crude prices stay flat through June, the year-over-year price increase would be 45%. But because oil market fundamentals are so strong currently, we think it a high likelihood that oil prices move higher from current levels. This would mean the year-over-year increase oil prices could be substantially higher than 45% by June, and that the headline CPI could be closer to 3% than the current 2.2%.
[REITs]Wouldn’t a big increase in inflation driven by oil prices result in much higher long-term interest rates? Not necessarily.
It’s important to remember that long-term nominal interest rates are a function of three variables: growth expectations, inflation expectations, and term premium. Treasury Inflation Protected Securities (TIPS) rates, are the sum of growth expectations and the term premium (the added yield investors require to hold longer dated bonds). Because nominal treasury rates and TIPS rates are observable in the marketplace, we can infer what inflation expectations are by subtracting the TIPS rate from the nominal bond rate. In other words, if nominal 10-year bond yields are 2.5% and TIPS yields .5%, then market implied inflation expectations would be 2%.
The scatterplot below shows the relationship between changes in crude oil prices and changes in inflation expectations priced into the bond market. The positive sloping linear trendline means that higher oil prices result in higher inflation expectations, as is logical. To be specific, for every $10 that oil prices rise compared to year-ago levels, inflation expectations will rise by 10bps. So far so good.

This next chart is a scatterplot showing the relationship between changes in crude oil prices and changes in TIPS rates. The negative sloping linear trendline means that higher oil prices result in lower TIPS rates, which as we mentioned earlier are the sum of growth expectations and the term premium. To be specific, for every $10 that oil prices rise compared to year-ago levels, TIPS rates fall by 10bps. Now, we’ll be the first to admit that this model isn’t perfect (the dots aren’t uniformly distributed around the trendline), but it is representative of the path TIPS rates generally take when oil prices rise or fall considerably. Indeed, the dots get a lot closer to the line when oil moves up or down by $20 or more on a year-over-year basis.
The mechanism that causes lower TIPS rates when oil prices rise a lot is the added tax on consumers higher oil prices bring. Said differently, when oil prices rise a lot it slows down economic growth. So, even though inflation rises with higher oil prices, the lower economic growth that results can partially or wholly offset any rise in inflation such that long-term nominal bond yields may not be affected much at all. That is to say, even if oil prices take off this year and headline inflation approaches 3%, nominal 10-year treasury yields may not move much at all, and TIPS yields may fall a lot.
Article by Bryce Coward, CFA – Knowledge Leaders Capital


