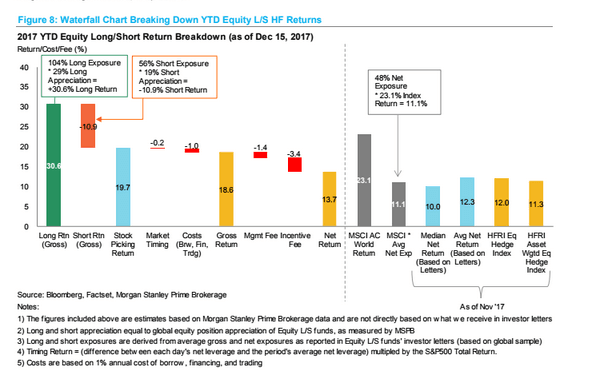
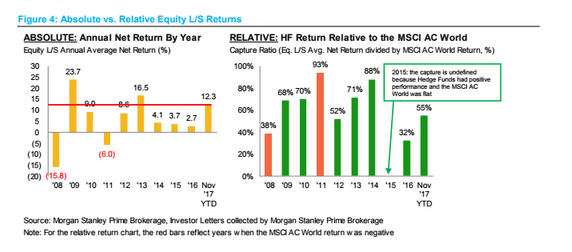
With all major asset classes up year-end, market expectations for 2017 were far exceeded from market participants across the globe. Leading the pack was Long/ Short (L/S) Equity funds – reporting a performance of up 12.3% year to date into November.1 Recent research from Morgan Stanley Prime Brokerage unit indicated that the median net return into November for Equity L/S funds was +10.0%, with an average return of 12.3%. This has been a welcome return to double digit territory – with only lacklustre performance to be had since 2013. In addition, the research indicates that the capture ratio gained significant ground in 2017, reaching 55%. (Capture Ratio: L/S returns expressed as a proportion of MSCI AC World Index returns).1

At the other end of the spectrum Discretionary Macro funds failed to deliver and were the black sheep of active investing – delivering ‐1.9% over the same timeframe. Event Driven strategies outperformed the low expectations investors were preparing for in 2017 while Quant strategies failed to live up to high expectations.
Volumes - Picking Up into Year End
A feature of effective L/S equity strategies is the ability to rebalance periodically. For 2017, we saw volumes and turnover reach peak levels only into year end for US equites – with sector rotations from hedge funds driving turnover volumes in November and December, partly in response to tax reform legislation. For the rest of 2017 turnover was subdued and as such volatility remained low. This muted response is most likely a consequence of the turmoil 2016 presented with Brexit in the UK/Europe and the presidential election across the pond.
Net Leverage - Positioning into 2018
Net leverage was seen to be going up across a broad range of strategies as we progressed into the end 2017. US L/S funds (compared against a global median net leverage level) were operating at levels below average for most of 2017. However, that changed in the last 2 months of the year. Specifically, the US hedge fund strategies were operating at or above long-term average net leverage levels in November and December – most likely seeking to ramp up exposures into 2018.
Lacklustre Volatility – Driving Gross Leverage Higher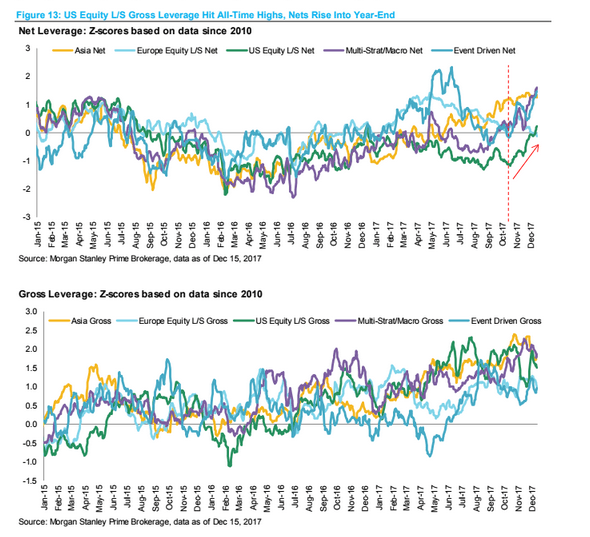
While net leverage has been drifting higher, gross leverage ticked very moderately lower into the tail end of the year, but not to any meaningful extent. This drift lower was in step with seasonal trend expectations with hedge funds taking steps to reduce gross leverage in to year end – reducing longs and more importantly covering shorts. This repositioning further contributed to the rise in net leverage over the same period. Earlier in the year gross leverage peaked to its highest level since the GFC - with meek market volatility and hedge funds increasing exposure in the tech sector driving the increased gross leverage levels. Specifically, the average VIX level for 2017 was approximately 11 - far lower than the average level of 15/16 that we have experienced over the past two years.1
Lacklustre Volatility – Inflating Beta Risks
The slump in volatility has led to inflated betas in the average stock holding relative to the market – due to the low volatility of the underlying index. Tech stocks, with their typically higher betas, have been the focus of hedge funds in 2017 and this has pushed both beta‐adjusted gross leverage and beta‐adjusted net leverage higher.
With higher betas, lower volatility and increased leverage it looks like 2018 is going to be a more risk-on environment for US equities, especially for L/S strategies.
Source:
1Morgan Stanley, 2017 Year-End Hedge Fund Recap, Dec 22, 2017


