Article by RCM Alternatives
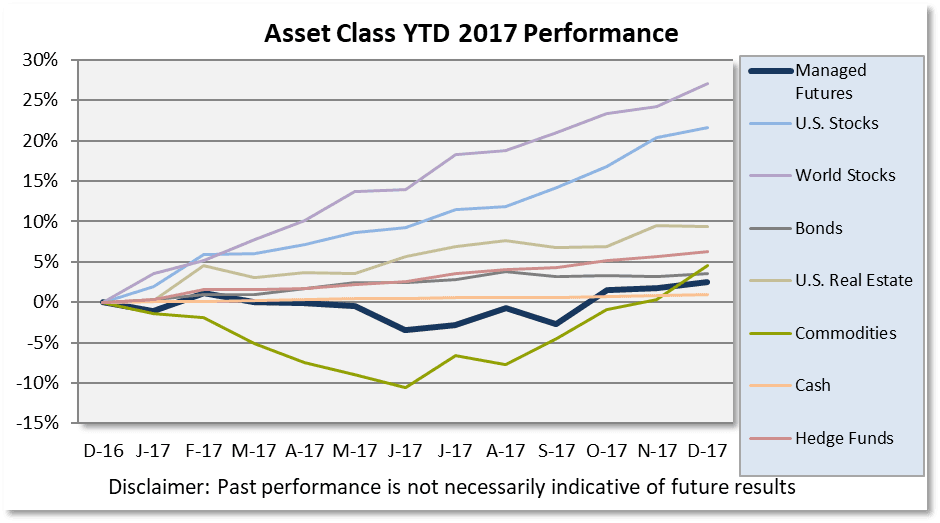
2017 is in the books and all of the asset classes we track made money; granted there’s a large margin between the top and bottom performers in 2107 (26%!). Stocks and World Stocks crushed it, with +20% performances. Maybe it’s the contrarian in us, but we will say if World Stocks were labeled as a Hedge Fund, it’s almost decade long drawdown would definitely be played up in databases and the media despite its 2017 gains.

Real Estate proves to be a top leader year after year, while Hedge Funds, and Bonds gave OK performances. Long Only Commodities spent the entire year in the negative, but was able to squeak out a positive performance on the year with a good December. Finally, Managed Futures finished up 2.48% for a year that did have much to offer in trends or volatility in the futures markets. This is Managed Futures first real up year since 2014.
Be on the lookout for our Managed Futures 2017 Strategy Review in the coming days to go over what happened and why!
Source: All ETF performance data from Morningstar.com
Sources: Managed Futures = SocGen CTA Index, Cash = 13 week T-Bill rate,
Bonds = Vanguard Total Bond Market ETF (BND),
edge Funds= IQ Hedge Multi-Strategy (QAI)
Commodities = iShares GSCI ETF (GSG);
Real Estate = iShares DJ Real Estate ETF (IYR);
World Stocks = iShares MSCI ACWI ex US Index Fund ETF (ACWX);
S Stocks = SPDR S&P 500 ETF (SPY)


