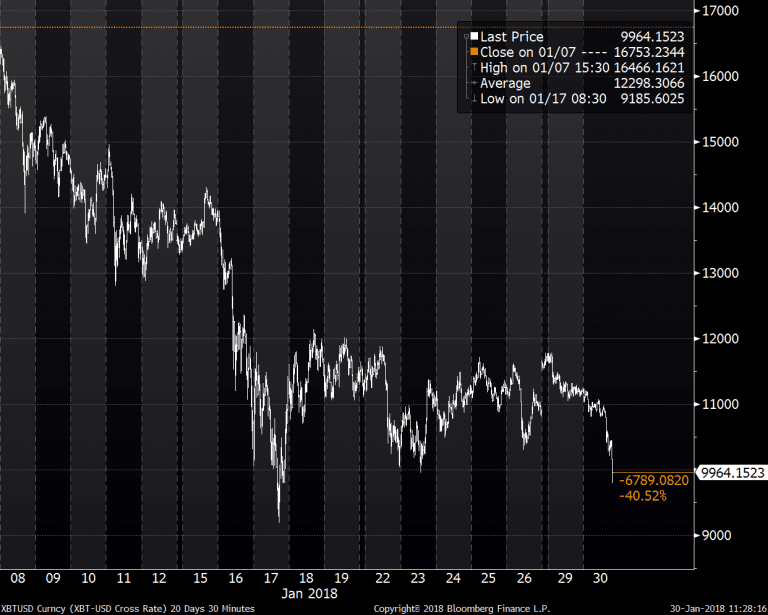
On January 17, I wrote a blog titled “Crypto-Crash” (link) where I speculated that the next stop for Bitcoin would be $8,000. On that day Bitcoin touched $9,100 and then bounced back to $12,000. It has since been range bound between $10,000 and $12,000… until today. Minutes ago, Bitcoin broke below the $10,000 support.

Why is this important? In addition to a strong inverse correlation to gold that I discussed in the earlier blog, Bitcoin appears to have a reasonable correlation to stocks also. In the chart below, I compared Bitcoin to the Dow Jones Industrial Average, the DJA lagged by 45 days. Bitcoin had its melt-up in December and stocks have, until today, had their melt-up in January. Is the speculative peak in Bitcoin something stock investors should take notice of?
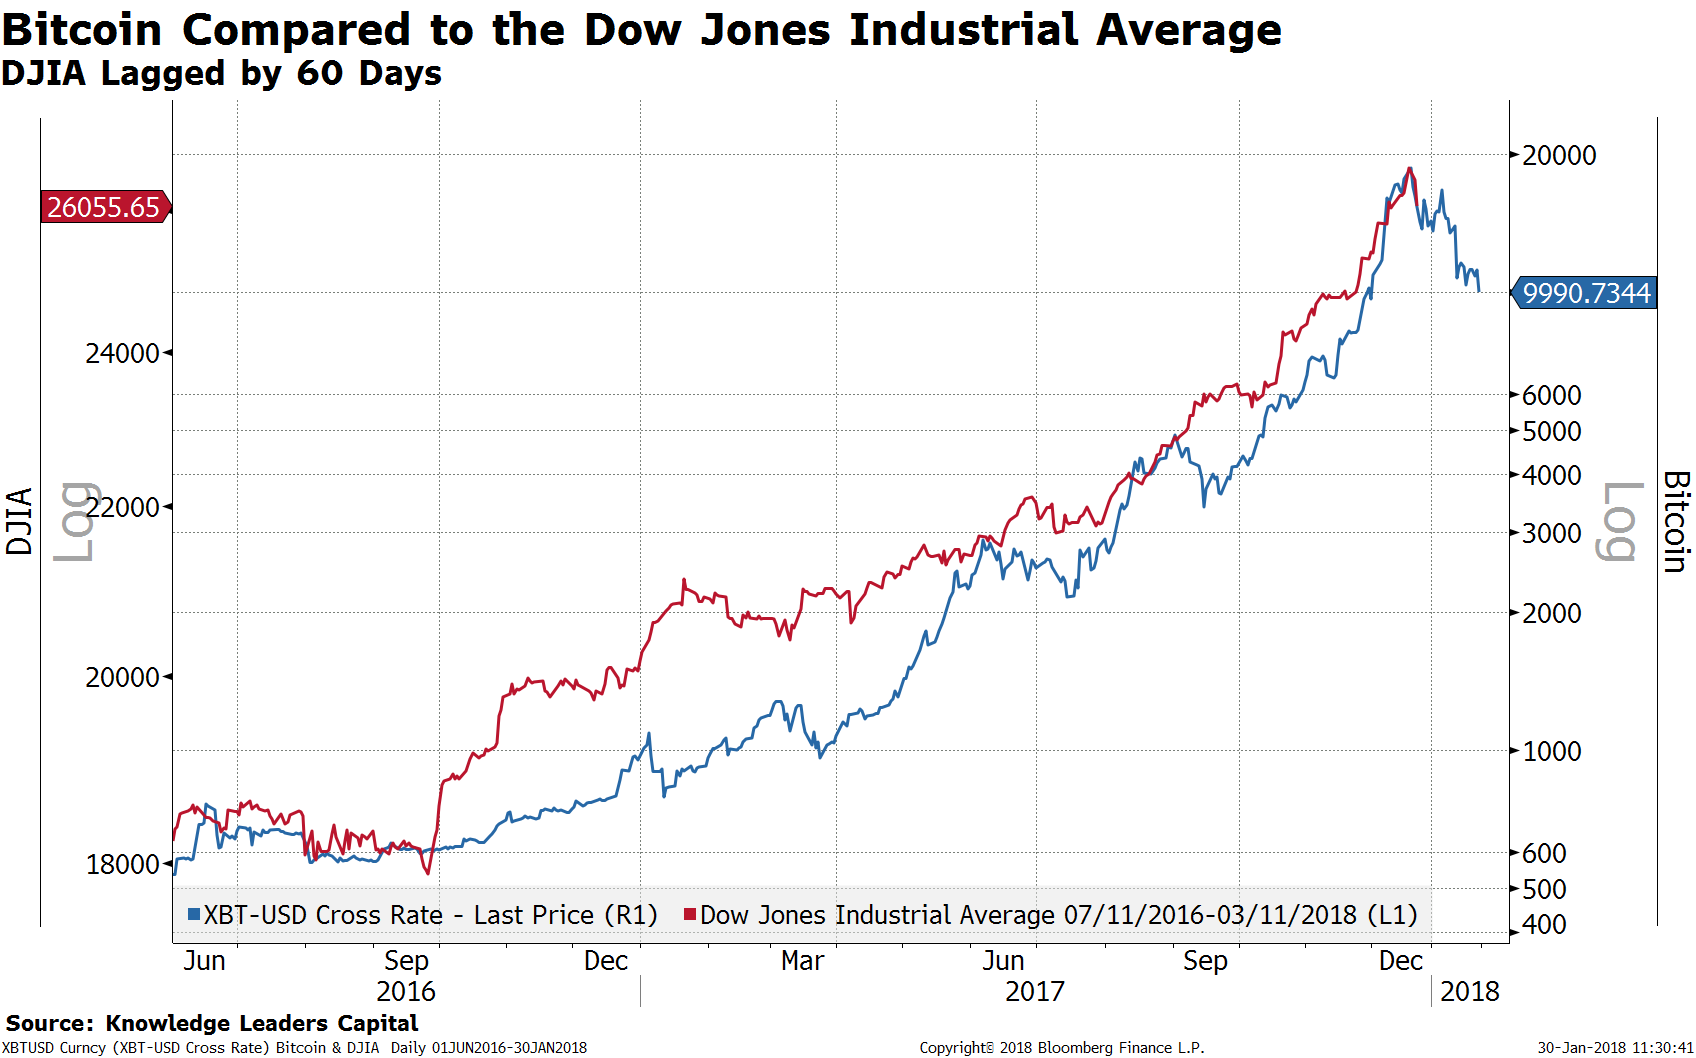
The $20,000 blow-off top reached on December 17 has now given way to a 50% peak-to-present decline. Does this relationship prove durable and telegraph a 10% decline in stocks? If so, the recent melt-up in stocks may be at risk.
Article by Knowledge Leaders Capital


