
Over the last 20 days, the US equity is showing early signs of exhaustion, and momentum is beginning to weaken. In the following charts, we’ll highlight the various technical measures we calculate each day to illustrate the early turn in momentum. Our KLSU DM Americas Index represents the top 85% market-cap of the US and Canada.

First, after peaking near 80% above the moving average a month ago, now 55% of stocks are above their own 20-day moving average.
Second, the number of new 20-day lows is picking up. A month ago, only about 2% of North American stocks were making new 20-day lows. Now, the figure is 19%.

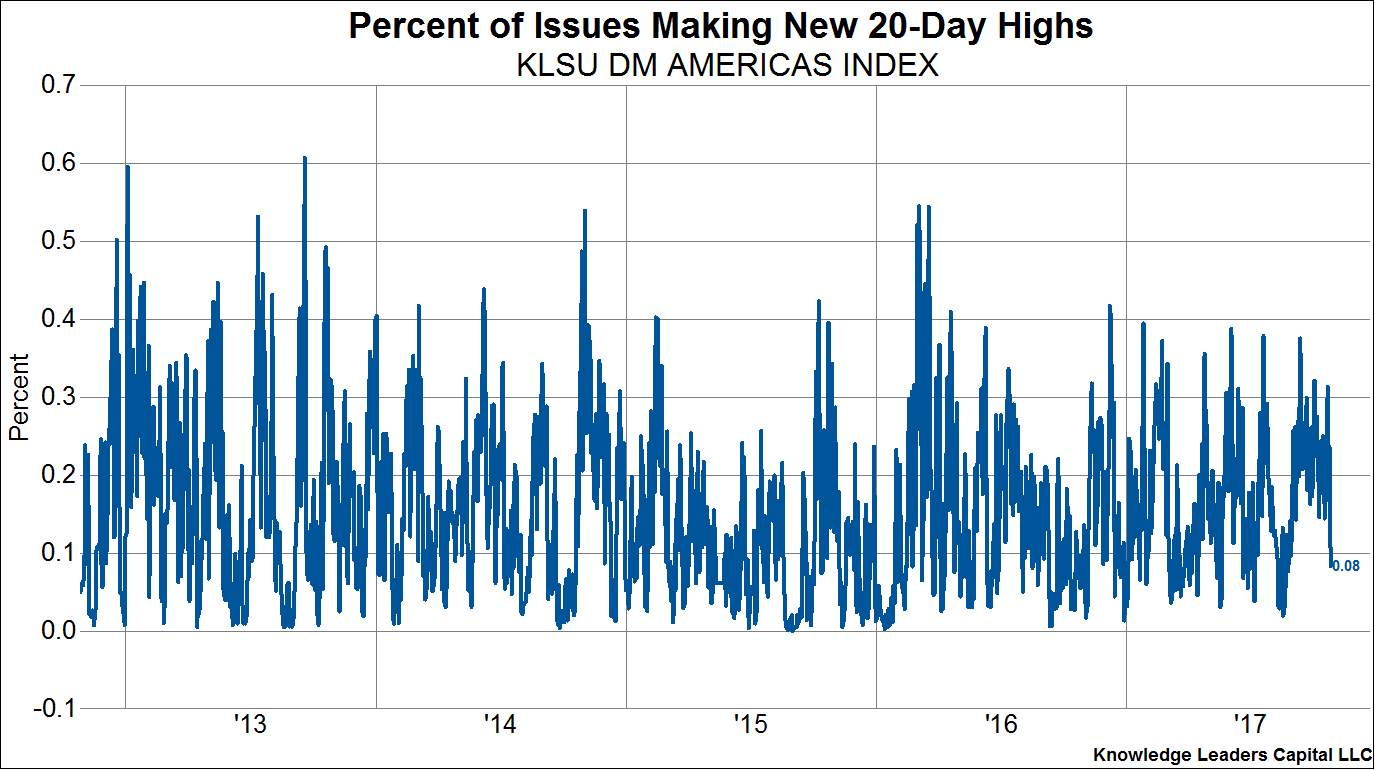
Similarly, a month ago 30% of North American stocks were making new 20-day highs. As of yesterday, only 8% are now making new 20-day highs.
Third, we measure the advance/decline ratio on a daily basis. The A/D ratio for North American equities has deteriorated from about 1.75 a month ago to about 1.31 currently.

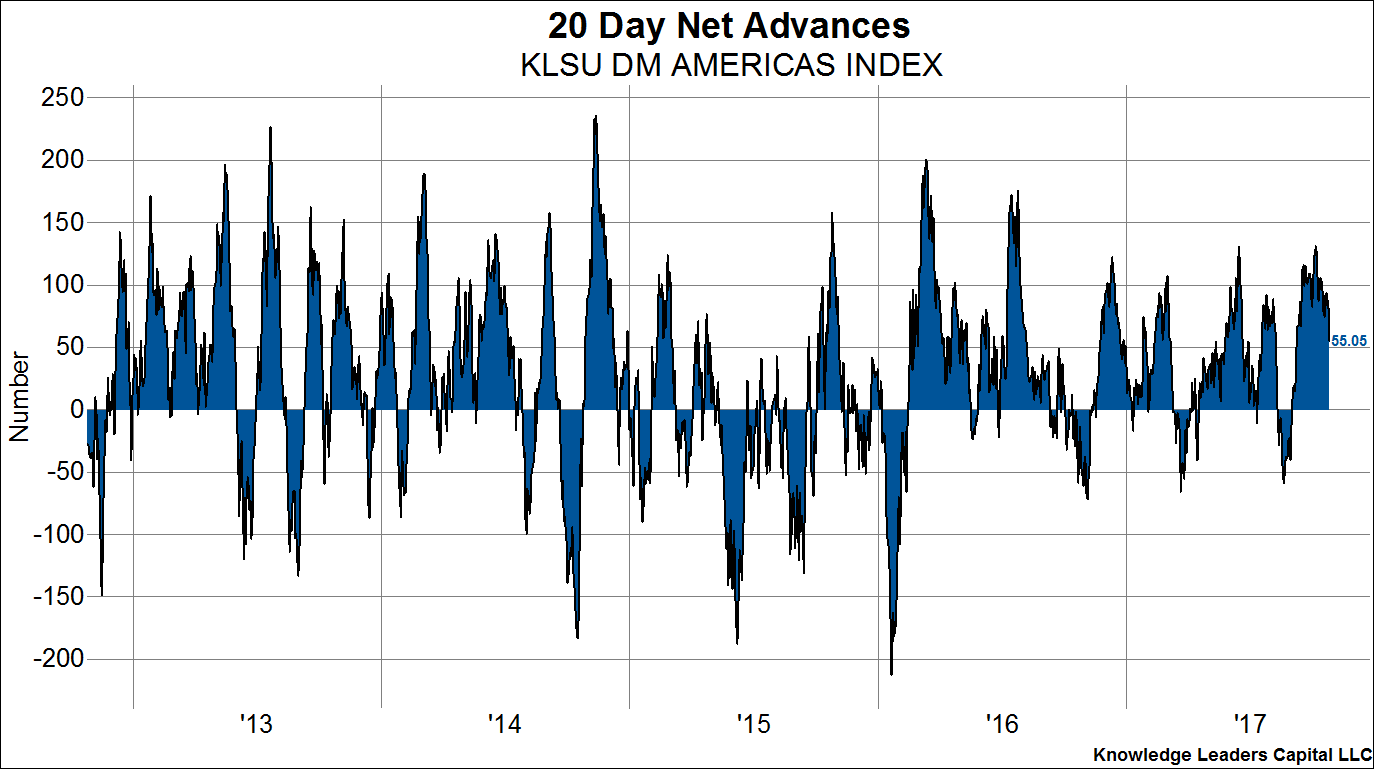
Fourth, we measure the number of net advancing stocks. We take the number of stocks up in a day and subtract the number of stocks down. A month ago, net advances were a bit over 100 for the trailing 20 days. We have slid to 55 net advances as of yesterday.
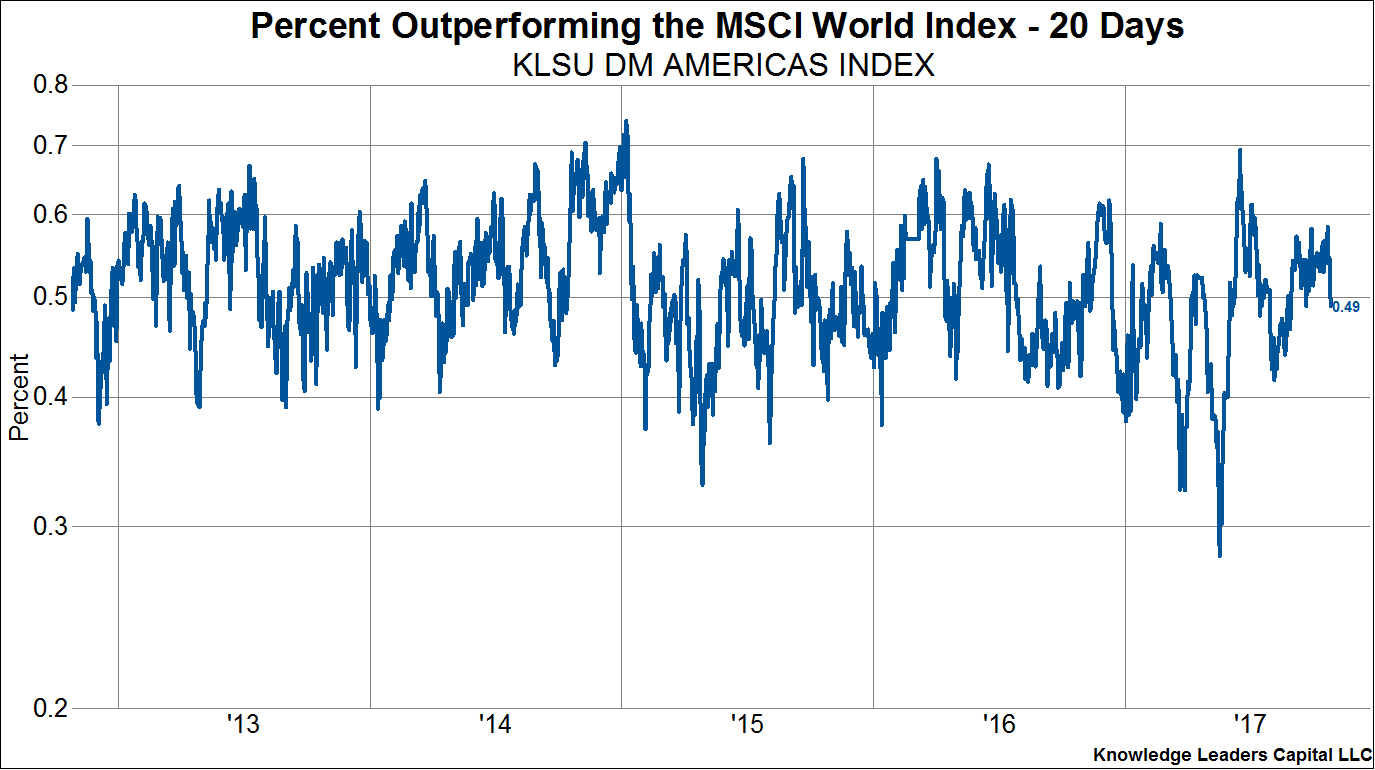
Fifth, we calculate the percent of stocks that are outperforming the MSCI World Index. A month ago just under 60% of all North American stocks had outperformed over the previous 20-day period. As of yesterday, only 49%, less than half the constituents, have outperformed the MSCI World Index over the last 20 days.
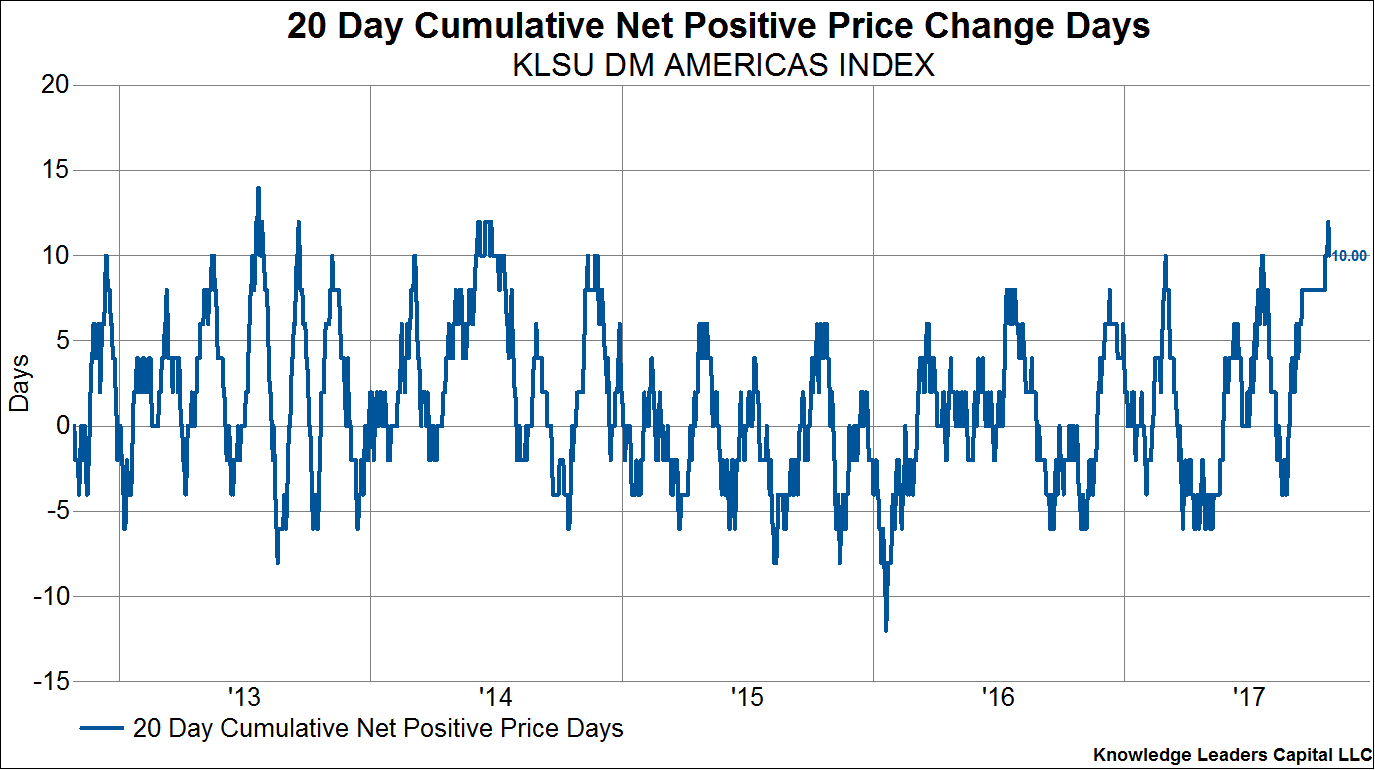
Sixth, we calculate the number of days stocks are up and the number of days stocks are down over a given period. As of Tuesday, the 20-day cumulative net positive price change days was 12, meaning 16 of the preceding 20 days were up days. As of yesterday, it has backtracked to 10. While still a high reading, given the mean reversion to this data series, it would not be unusual if the recent run turns into a statistical slump, with more down days than up in the near future.
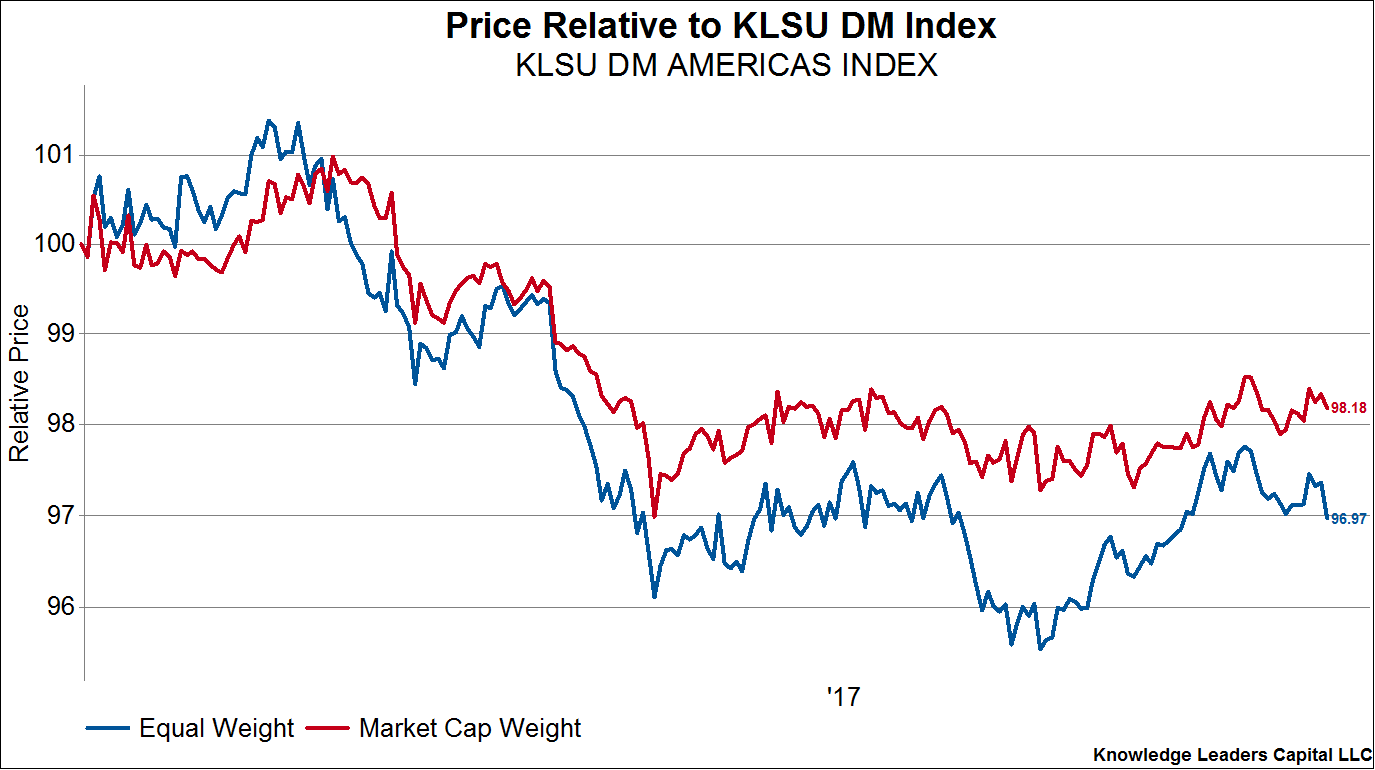
While this isn’t yet super bearish stuff, the deterioration in breadth should be considered alongside the fact that the equal weighted KLSU North America has underperformed the market-cap weighted version all year, suggesting a somewhat narrow market. And most importantly, both versions have underperformed the global equity markets YTD.
Article by Steven Vannelli, CFA - Knowledge Leaders Capital


