
We think the main attribute of the next crisis will be severe liquidity disruptions resulting from market developments since the last crisis.”
– Marko Kolanovic, Ph.D.,
Head of Quantitative and Derivatives Strategy,
JP Morgan Chase & Co. (Source: The Telegraph)
Yet this is not the mood in which bull markets typically end. Central banks around the world have purchased approximately $15 trillion of financial assets since the great crisis. Outside of the U.S., the BOJ and ECB are still buying.
Kolanovic is calling it “the great liquidity crisis.” It may stick. “The timing will largely be determined by the pace of central bank normalization, business cycle dynamics and various idiosyncratic events, and hence cannot be known accurately,” he added.
October marks the beginning of the Fed’s balance sheet unwind. Yellen promises it will be slow “like watching paint dry.” Central bankers are walking on thin ice. No one knows how this is going to go. I’m rooting for “like watching paint dry” but suspect the challenges are far more global than what Janet feels she and her teammates can control.
As a kid, my siblings and I would regularly watch “Lost in Space.” When trouble was near, the robot would swing his arms wildly and shout “Danger, Will Robinson, Danger!” The robot was Will’s protector and best friend. Well, let’s just keep our lights on.
Our advisor relationships are telling us their clients are pushing for more equity exposure. Behaviorally, that makes perfect sense. The animal spirits are heating up again. And for now I believe those clients may be right. As you’ll see again this week in Trade Signals, the weight of evidence points bullish. The great Sir John Templeton said, “Bull markets are born on pessimism, grow on skepticism, mature on optimism and die on euphoria.”
Individual investors are almost always the last to the party. I’m sensing “euphoria.”
I remember shouting to my team in 2008, “Who the hell keeps buying this stuff?” Despite unsound fundamentals and low yields, HY bond prices kept advancing. Yields pressed even lower. It was all out risk-on. It was a seemingly endless sea of liquidity engineered in the derivative departments of the big banks. They creatively sliced and diced subprime mortgages and repackaged into structured products in a way that provided higher yields to investors and a AAA rating to boot. Turned out that junk was really just junk.
So when the head of derivatives strategy at the world’s largest financial product-creating sausage factory warns of coming liquidity crisis, we should take note.
Today the “who the hell is buying this stuff” just dumbfounds my free market mind. Take a close look at this next chart courtesy of the WSJ’s “Daily Shot.” In 2011, the Bank of Japan owned roughly 0% of the total Japanese ETF market. Today they own 60%.

Source: Deutsche Bank, Balyasny Asset Management LP (BAM) via WSJ
Does the BOJ care about value and future earnings? What kind of moral hazard are they enabling? Does the ECB care about which bonds it’s buying up at $80 billion per month? Where is that liquidity going?
The S&P has closed at a record high six straight days through yesterday, its longest such run since 1997, and has also chalked up an eight-session win streak, its longest in more than four years. If the index were to rise for a ninth straight day, it would have its longest win streak since November 2004. (Source: CNBC.)
And there is no apparent concern for risk. This from Josh Brown (note small red dash far right of chart):
A sell when everyone is buying moment?
And just to remind ourselves of times past, individual investors tend to buy and sell at the wrong time. Note in the next chart the low percentage of money market as a percentage of assets under management in Bank of America Merrill Lynch client accounts in April 2007. Then note the high money market balance at the peak in February 2009. The market bottomed on March 6, 2009.
Now, I’d argue that in 2007, considering the percentage of household assets in stocks was 37% (according to research from Ned Davis Research) and it dropped to 20% by February 2009 that some of that decline was due to the market crash. And if money market as a percentage of total market value increased from 12.74% (see next chart courtesy of NDR) to 46.91%, it got there because people were panicking. The best time to get out was at the “Trough” in cash as a % of AUM, not the “Peak.”
NDR has a great chart that measures money market fund assets as a percentage of total stock market value. Similar to the Merrill Lynch data above, the current 9.9% percentage number below is lower than it was in 2007 and at the lowest level since 1987. Animal spirits indeed.
As you’ll see in the Trade Signals post below, the equity market signals I favor most remain bullish. Central bank liquidity? Hope for tax cuts? The repatriation of $2 trillion in offshore corporate cash? Right now, there are more buyers than sellers and the trend is up. And that’s good news for the equity portion of your portfolios.
At the beginning of each month I like to look at the most recent valuation statistics. Let’s take a pass on that this week. The market remains richly priced.
But I do want to share with you just a few more interesting charts. I loved this next chart because it puts into perspective the nature of an investor’s experience over time. For example:
Did you know that since 1900, the DJIA has spent over 75% of the time either “Falling” (34.35% of the time) or “Recovering From A Loss” (41.52% of the time) and just 24.23% of the time “Making New Wealth?” It looks like this:
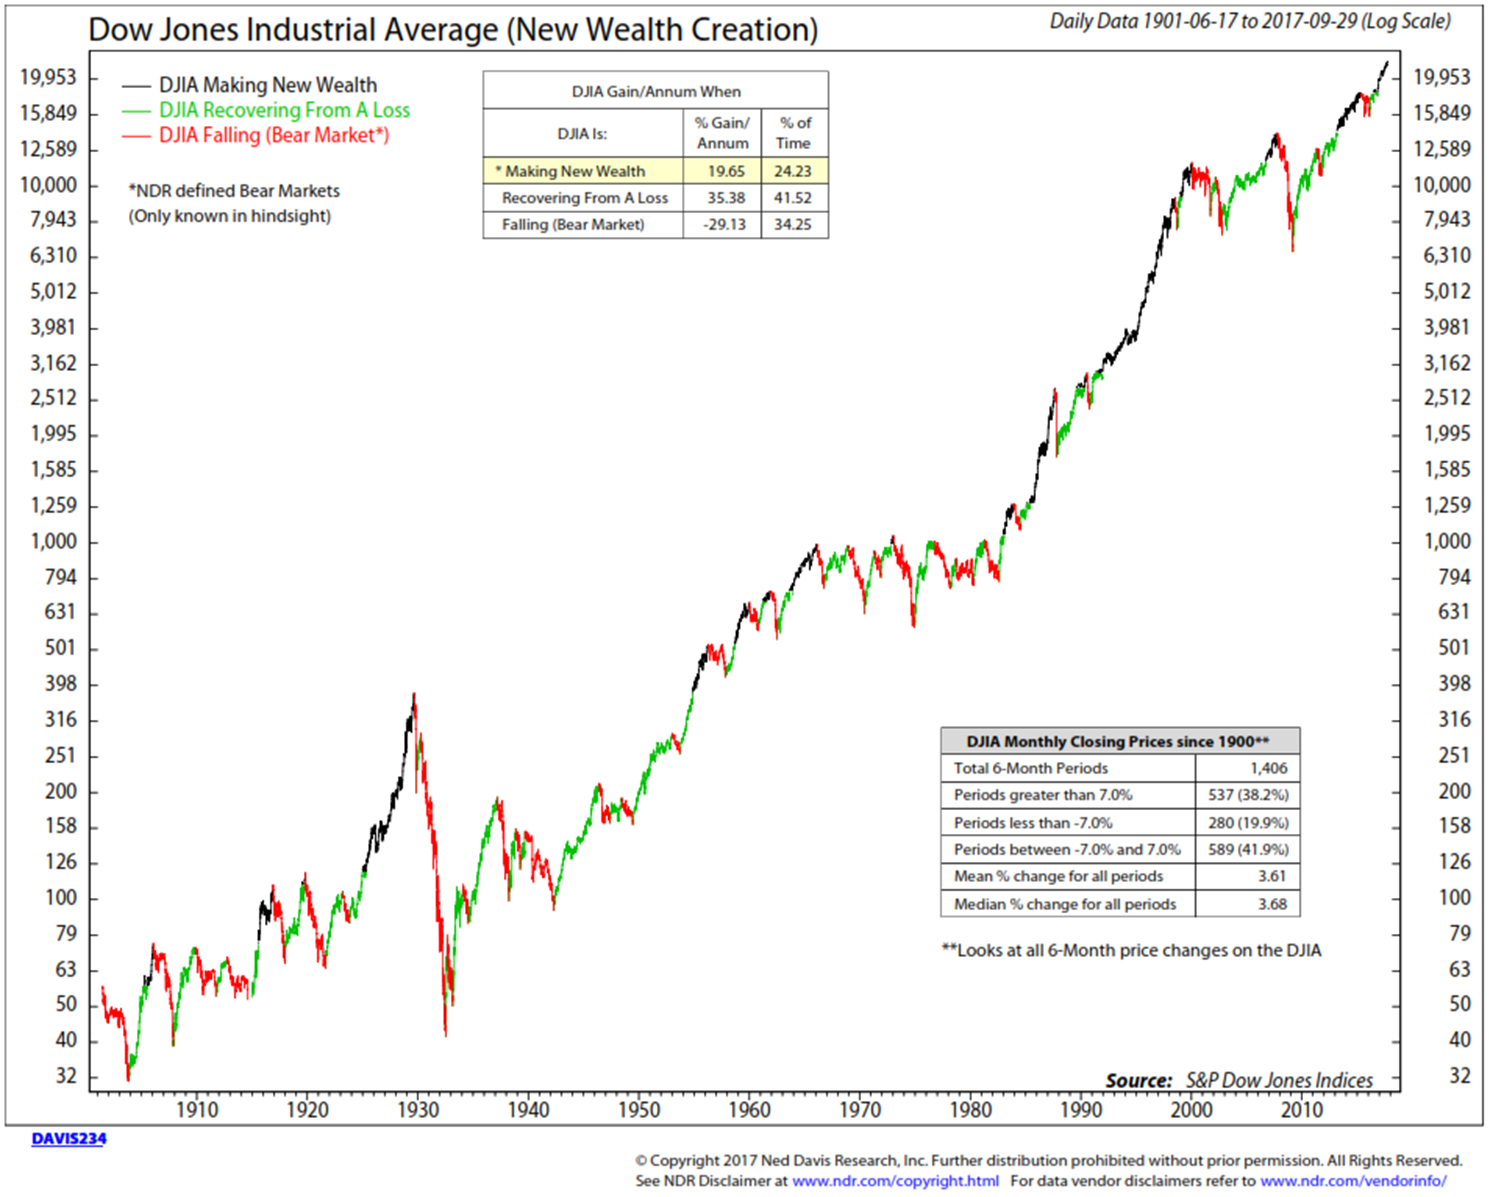
The current regime is highlighted in yellow (upper data box). Interestingly, the best gains per annum come when the market is recovering from a loss. It’s pretty clear that when it comes to long-term investing, as Mick Jagger sings,
Time is on my side, yes it is.
Time is on my side, yes it is.
– The Rolling Stones, “Time Is On My Side”
However, thirty-plus years in the business on the front lines dealing with individual investors has taught me, and I say with conviction to my children, the majority of individual investors are ruled by fear and greed. And my experience tells me that the next bear market correction will prove behaviorally no different. I’m sure not you, but probably your neighbor and probably your brother-in-law.
When you look again at the above chart, zero in on the 1966-1982 period. I was a young Merrill Lynch financial consultant in 1984. Young and inexperienced, management told to sell the Merrill Lynch Basic Value Fund. Not easy to do. Every prospect or client I called said, “The only way to make money in the market is to trade the market.” Well, except a few, one client named Paul Cohen bought the fund for his kids’ accounts. Years later, I was amazed at the gains in Paul’s kids’ accounts. But look at his timing (1985). He caught the greatest bull market in history.
I wrote a white paper for VanEck that I’ll share with you next week. It begins with a quote from Ned Davis, “Investors need to invest differently in bull markets than they do in bear markets.” I believe investors can handle risk, limit loss and avoid the big mistakes. Part of it is diversification and part of it is ongoing risk management. Right now it’s bull market. We’ll get a bear. Invest different? Yes…It’s in the math.
- It takes a 25% return to overcome a 20% decline. Not a problem.
- It takes a 43%% return to overcome a 30% decline. Harder.
- It takes a 67% return to overcome a 40% decline. Problem.
- It takes a 100% return to overcome a 50% decline. Big problem.
When you click the On My Radar link below, you’ll find one more chart showing nominal and real market returns since 2000. Do take a look and feel free to share the chart with your clients. How many years did it take for the DJIA, S&P 500 Index and NASDAQ to get back to break even? 11 for the DJIA, 13 for the S&P 500 and 16 for the NASDAQ. My concern today is for pre-retirees and retirees.
My kids and yours are going to start dollar cost averaging into a new bull market to come. They have the runway. Many don’t. “Time is on my side, yes it is.” Unfortunately, for Mick and many baby boomers, unless John Mauldin is right about biotech and extending life expectancies, the time to recover from another possible -50% doesn’t exist.
As a smart advisor friend said to me today, “If you are a pre-retiree or retiree, time is not on your side so let us pray that luck is.” I’m praying Mauldin’s right.
For now, the trend evidence remains bullish, valuations are high and we are near the other side of QE. With the Fed raising rates and exiting QE, I don’t believe we can expect the same outcome yet we really have no idea as to how this will play forward. Time ahead may just find us back into full blown QE. We don’t know.
Message today: when the head of derivatives from the largest bank in the world signals concern, we should take note.
Keep to the plan. Participate and protect and do your very best to avoid the big mistakes. Think diversification and risk management. I hope the charts I share with you today help you and prove helpful in your work with your clients.
Follow me on Twitter @SBlumenthalCMG.
Included in this week’s On My Radar:
- Dow, S&P 500 and NASDAQ Since 2000
- Mauldin – Santelli on CNBC “The Future of the Global Economy”
- Trade Signals – Looking Good and Feeling Good (Extreme Investor Optimism Once Again, Yet Trend Trumps Sentiment)
- Personal Note
Dow, S&P 500 and NASDAQ Since 2000
When I look back at performance, I too find myself getting caught up in the most recent market returns. But in order to take in the full picture of what the investment markets might bring, I find it helpful to go farther back. While the above chart in the intro section goes back to 1900, let’s take a look at what most of your clients can relate to. This next chart looks at the nominal returns since the 2000 market top.
- The point is that we are seeing the same animal spirits we witnessed in 1999 (maybe not just yet at that euphoric extreme) and 2007.
- The point is the returns since 2000 have been nothing special and the amount of time it took to get back to even and begin to make some money again (if one was a buy-and-holder) was long and frustrating, and
- The point is the population is much older and most of the money in the hands of pre-retirees and retirees…
- The point is… ok, you get the point.
When you view the next chart, keep in mind the following stats:
- The S&P 500 is up 91.1% over 17¾ years. Over the 17¾ years, that’s roughly 5% per year.
- The S&P 500 is up 64.9% since 2000. Over the 17¾ years, that’s roughly 3.65% per year.
- The NASDAQ is up 28.7% since 2000. Over the 17¾ years, that’s roughly 1.60% per year.
Also:
- Sixteen years later, a period that included a 75% decline and two difficult bear market corrections, the NASDAQ finally got back to break even and began to make money (see red line – 2016/2017).
Source: dshort.com
After inflation, the numbers are materially lower. We invest to gain a return above inflation so our money can work for us in retirement (or for whatever needs we may have).
Point is that we should be aware of inflation and this chart presents a more realistic picture of what happened relative to what your money can buy in today’s dollars.
Source: dshort.com; Advisor Perspectives
Mauldin – Santelli on CNBC “The Future of the Global Economy”
This is short and I believe worthwhile. I’ll be with John later this month and really want to pin him down on his views on how the central banks might evaporate the debt… and what that means to the markets. I’m going to buy a powerful little camera called Mevo that lets me do short video podcasts and post. Stay tuned. Here is the Mauldin – Santelli piece. It left me wanting to know more. It’s worth the short three minutes:
Trade Signals — Looking Good and Feeling Good (Extreme Investor Optimism Once Again, Yet Trend Trumps Sentiment)
S&P 500 Index — 2,539 (10-04-2017)
Notable this week:
Equity bull trend signals remain across the board. Take a look at the Volume Demand vs. Volume Supply chart when you click through. Specifically, Ned Davis Research (NDR) looks at the total volume of declining stocks versus the total volume of advancing stocks. In simple terms, they add up the total volume of shares traded for stocks that traded up on price and they add up the total volume of shares traded for stocks that traded down in price. Think more buyers than sellers or more sellers than buyers. Note in the bottom section of the chart (gray shaded areas) how the S&P 500 Index has performed when advancing volume is better than declining volume. Clearly, markets do better when there are more buyers than sellers, as is the case today.
Click here for the latest Trade Signals.
Important note: Not a recommendation for you to buy or sell any security. For information purposes only. Please talk with your advisor about needs, goals, time horizon and risk tolerances.
Personal Note
Last weekend was great fun for me. I went to Penn State, connected with family and celebrated with some very good old friends. Pictured below are my sons Kyle (#22) and Matt (#37), Cousin Dan (Hockey jersey), stepson Tyler (shorts), his friend Chase (American hat) and good friend Jack. We were treated to good food and a nice victory for the home team.
The weather and the seats were pretty darn good. Hat tip to Charlie “Chuckles” Dent:
And reuniting with my 1980 pledge class and other fraternity brothers… priceless:

Call up an old friend and tell him or her you’re thinking about them. It sure felt good for me last weekend. I’m going to try to stay in better touch with my buddies.
I’m in DC next Wednesday through Friday. My good friend and fraternity brother/roommate is Congressman Charlie Dent. Dinner with Charlie is planned just prior to the start of a two day conference. We spent some quality time together at the football game, but I do have a few political questions on my mind. Like, just how broken is this thing? He’s a good man and as honest as they come and I know he’ll share with me what he can.
Dallas and Charleston, SC follow later in the month. Ok, that was a lot about me. Thanks for indulging me. Please know I’m grateful for you and the time you spend with me each week. Wishing you and your family the very best. And do call a friend…and toast to life!
Have a great weekend!
With kind regards,
Steve
Stephen B. Blumenthal
Executive Chairman & CIO
CMG Capital Management Group, Inc.


