
There’s been a lot of talk about the so-called FAANG stocks and parallels being drawn against the 2000’s dot com bubble. With S&P500 valuations steadily pushing higher vs history and relative to global equities, it’s somewhat understandable.
But this ain’t dot com. Not by a long shot.

I explored this issue alongside a broader look at market capitalization representation and earnings share across sectors of the S&P500 in the latest weekly report.
Here's one of the standout charts from the analysis:
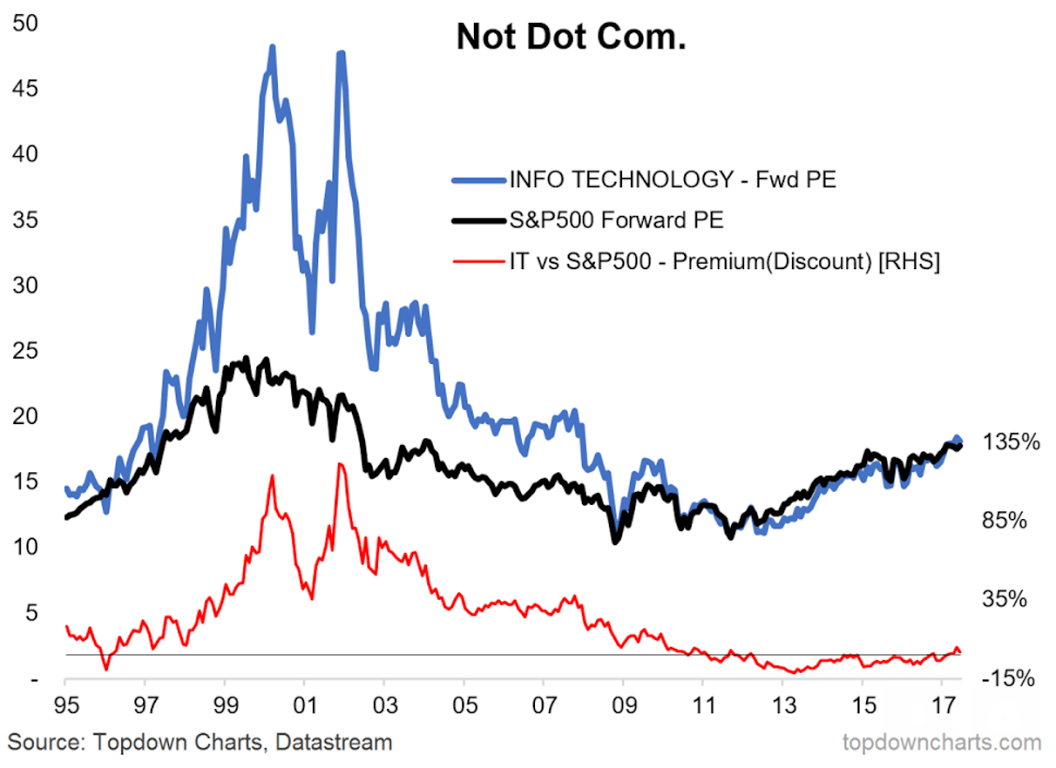
The chart shows absolute and relative valuations for the Information Technology GICS sector of the S&P500. Even just looking at absolute valuations you can see a stark difference between now vs then on forward PE ratios.
On relative valuations (the red line) you can see that recently the IT sector moved to a very small premium versus the S&P 500, but it's simply immaterial compared to the extreme valuation premium priced during the height of the dot com mania.
Simply put it's not dot com.
While not shown here, there is also a substantial difference in market cap representation (it was over 30% at the peak, and around 20-25% now... and earnings share was about 15% at the peak vs consistently above 20% now).
So while it's tempting to look at one or two extreme examples and exceptions and reminisce about the wild euphoria that characterized the dot com bubble. On many angles it's simply not dot com.
This article originally appeared as a submission at See It Market


