
As reported by Chain Reaction Research, the palm oil industry’s transformation towards sustainability gained traction in 2013 when major purchaser Unilever engaged SE Asian refiners and traders to embrace ‘No Deforestation’ policies. As a result, in 2013, Wilmar was the first SE Asian refiner or trader to adopt a No Deforestation, No Peat, No Exploitation (NDPE) policy. Many other trading companies in SE Asia, Europe, U.S., and Latin America followed suit. Currently, most large international palm oil traders and refiners have NDPE policies.
However, a segment of the market continues to produce or purchase palm oil from recently deforested plantations and cleared peatlands, creating a ‘leakage market’ for unsustainable palm oil. Leakage is defined as any activity in the palm oil industry, production, trade and/or consumption, that is not compliant with NDPE policy requirements. Leakage creates an unlevel playing field and slows and dilutes industry transformation, thereby incurring various financial and reputational risks. The history of Sawit Sumbermas Sarana (SSMS) is instructive.
Key Findings
- Due to non-compliance with its buyers’ NDPE policies, Sawit Sumbermas Sarana (SSMS) lost 81 percent of its customer base in 2014 to 2015. Nonetheless, it has been able to continue operations and marginal profitability. SSMS restructured contested land bank assets while securing new clients in the ‘leakage market’.
- Unilever is among SSMS’ new buyers, and its importance has grown in Q1 2017. Unilever awaits the outcomes of an independent review on sourcing policy compliance to decide on next steps following SSMS’s alleged continuing deforestation and peatland. Next steps could include suspension of sourcing, posing further material risks to SSMS. Unilever’s trading relationship with SSMS commenced after large SE Asian palm oil traders suspended SSMS for non-compliance with their NDPE policies. Notwithstanding the outcomes of the independent review, Unilever’s trading relation might damage its sustainability reputation.
- SSMS transition to supplying the ‘leakage market’ resulted in substantial losses for its shareholders. Chain Reaction Research analysis points to a 17 to 20 percent underperformance versus peers from May 2015 to April 2017. Although SSMS has been able to recover the loss in sales and EBIT from buyers’ suspensions, this recovery was substantially exceeded by the negative impact from SSMS resulting higher net debt due to portfolio changes and increasing capex to finance the ‘leakage market’.
- SSMS’ valuation premium versus peers has declined, but remains above its peers. If SSMS lose Unilever as a customer, further underperformance of SSMS shares might occur. Risks to shareholders remain high.
| Related plantation companies | Land bank (NASDAQ:HA) |
| PT Sawit Mandiri Lestari (PT SML) | 27,000 |
| PT Ahmad Saleh Perkasa (PT ASP) | 10,700 |
| PT Citra Borneo Indah (PT CBI) | 1,000 |
| Total | 38,700 |
| SSMS Directly Owned Plantation Companies | Land Bank |
| PT Sawit Sumbermas Sarana (SSMS) | 22,700 |
| PT Kalimantan Sawit Abadi (PT KSA) | 7,300 |
| PT Tanjung Sawit Abadi (PT TSA) | 14,900 |
| PT Sawit Multi Utama (PT SMU) | 17,400 |
| PT Mitra Mendawai Sejati (PT MMS) | 10,400 |
| PT Mirza Pratama Putra (PT MPP) | 6,400 |
| PT Menteng Kencana Mas (PT MKM) | 15,600 |
| Total | 94,700 |
Sawit Sumbermas Sarana: December 2016 USD 450 Million Loan from Bank Negara Indonesia to refinance debt
PT Sawit Sumbermas Sarana (SSMS) is a medium market cap Indonesian palm oil company with 19 oil palm estates, six palm oil mills, and one palm kernel mill. Through seven concession companies, it operates a total area of 95,770 hectares in Central Kalimantan. 73 percent of their concession area has been planted. SSMS has been listed on the Indonesian Stock Exchange since its December 12, 2013 IPO. SSMS is controlled through parent company Citra Borneo Indah Group (NYSE:CBI). CBI’s ultimate owners include Jemmy Adriyanor and Jery Borneo Putra, both sons of Abdul Rasyid. SSMS has a 26.7% free float.
On December 14, 2016, SSMS announced its aim to expand its landbank to 150,000 ha within five years. January 16, 2017 SSMS received a USD 450 million (IDR 6 trillion) loan from Bank Negara Indonesia to refinance its debt. The loan might also be used for land bank expansion as SSMS wants to expand by 10,000 ha in 2017.
SSMS and Affiliated Companies: Material Deforestation Risks
In December 2013 when initiating coverage, Chain Reaction Research reported that over 95 percent of SSMS land bank was contested because SSMS lacked Government of Indonesia regulatory approvals for forestland development. While some SSMS subsidiaries had applied for Government of Indonesia permits based on Regulation No. 60/2012 but as of May 15, 2017, the matter has yet to be resolved. Subsequent assessments showed that SSMS subsidiaries continued to also deforest land and clear peatland despite SSMS’ downstream buyers suspending purchases from SSMS because of SSMS deforestation and peatland practices.
Chain Reaction Research initial coverage also showed that SSMS was investing SSMS assets in associated companies. In Q4 2016, SSMS restructured two subsidiaries with contested land. While these two subsidiaries no longer form part of the SSMS, they continue to be owned and operated by SSMS affiliated individuals. These two SSMS affiliated companies are:
- PT Sawit Mandiri Lamandau (PT SML) – 27,700 ha. PT SML’s land cover comprises mature lowland tropical forest. PT SML concession includes orangutan habitat.
- PT Ahmad Salleh Perkasa (PT ASP) – 10,700 ha. PT ASP’s land cover includes undeveloped peat land with remnant forests. PT ASP concession also includes orangutan habitat.

Figure 1: SSMS plantation companies in Central Kalimantan, Indonesia.
Previously, in 2015, SSMS acquired land held by four other companies. As shown in Figure 1 (above), these companies are:
- PT Mirza Pratama Putra (PT MPP) – 6,400 ha.
- PT Menteng Kencana Mas (PT MKM) – 15,600 ha.
- PT Tanjung Sawit Abadi (PT TSA) – 14,900 ha.
- PT Sawit Multi Utama (PT SMU) – 17,400 ha.
Currently, two of SSMS’ palm oil mills are RSPO certified. SSMS RSPO-certified land bank totals 19,843 ha., or 21 percent of the company’s land bank. Its RSPO-certified land bank includes PT Mitra Mendawai Sejati (10,400 ha).
But SSMS has done little to diminish its buyers’ material concerns about the company’s deforestation practices. To the contrary, as shown in Figures 2, 3, 4, and 5 (below), as of April, 2017, SSMS continued to be associated with deforestation and peatland clearance.
To explain in detail, previously, in December 2015, SSMS spun off its subsidiary PT SML to PT Metro Jaya Lestari. Before the spin-off, both this subsidiary and SSMS were subject to an RSPO complaint filed in 2015. After the spin-off, the RSPO complaint was closed due to ‘ the transition process of PT SML to the new owner (non-RSPO member)‘.
However, PT SML corporate filings shows that PT SML is still owned by companies and individuals affiliated with SSMS.
For example, PT SML corporate filings lists the same company address as PT SSMS and PT CBI. PT SML director is Ramzi Sastra. Sastra is also a PT SSMS director.
PT SML continued to deforest after the RSPO complaint was filed, as shown in Figures 2, 3, 4, and 5 (below). PT SML deforested 3,425 ha from June 2015 to April 2017.
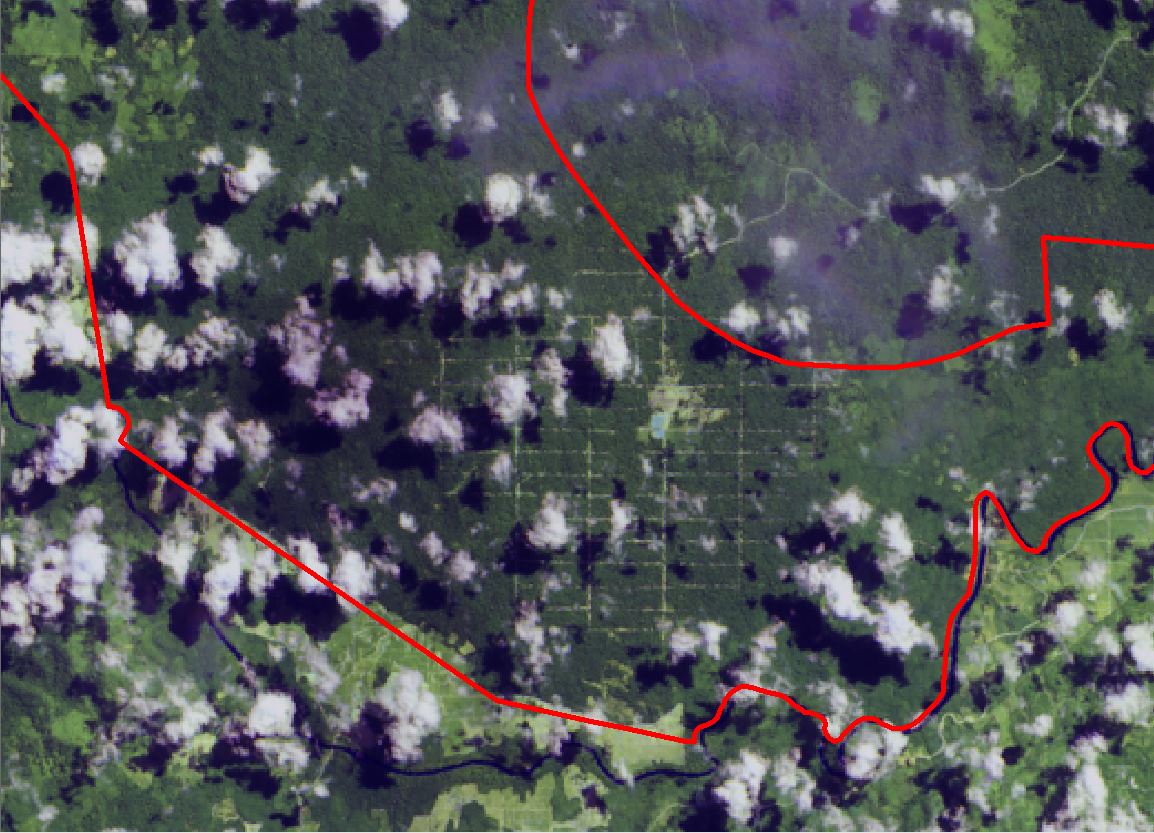 |
Figure 2: PT SML’s deforestation, June 2015.
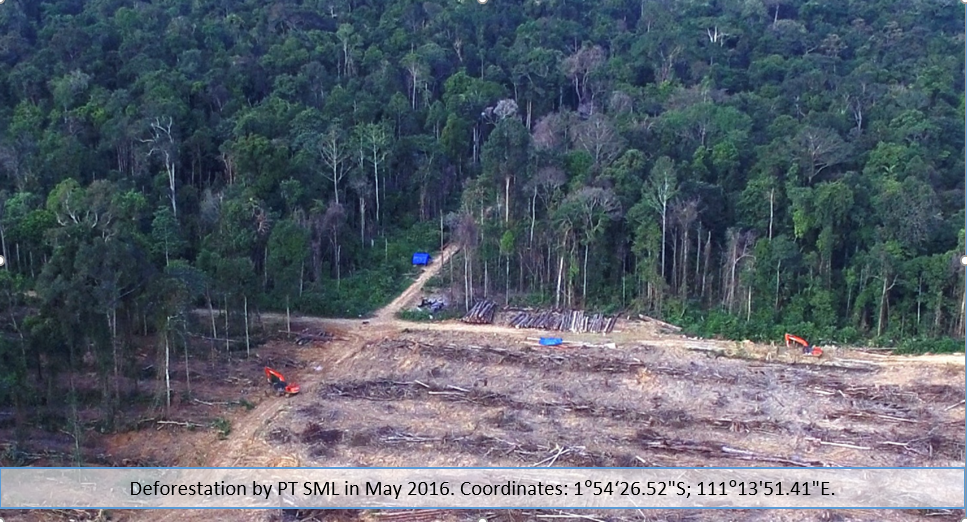
Figure 3: PT SML’s deforestation, May 2016.
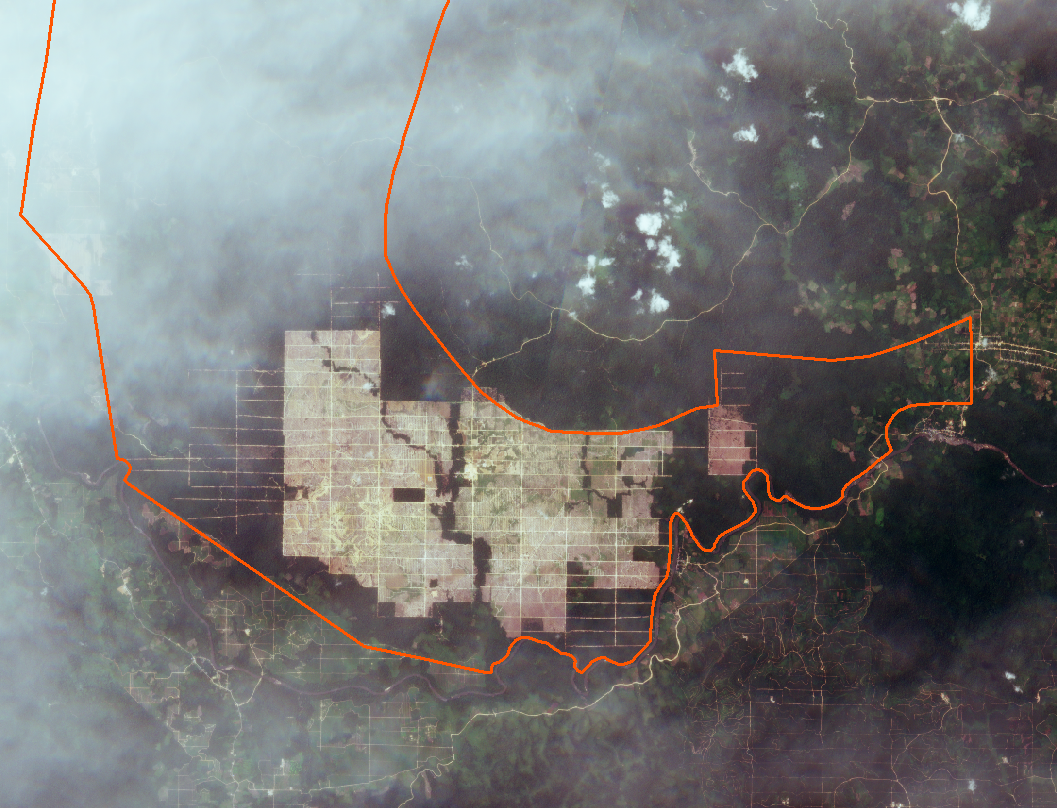 |
Figure 4: PT SML’s deforestation, February 2017.
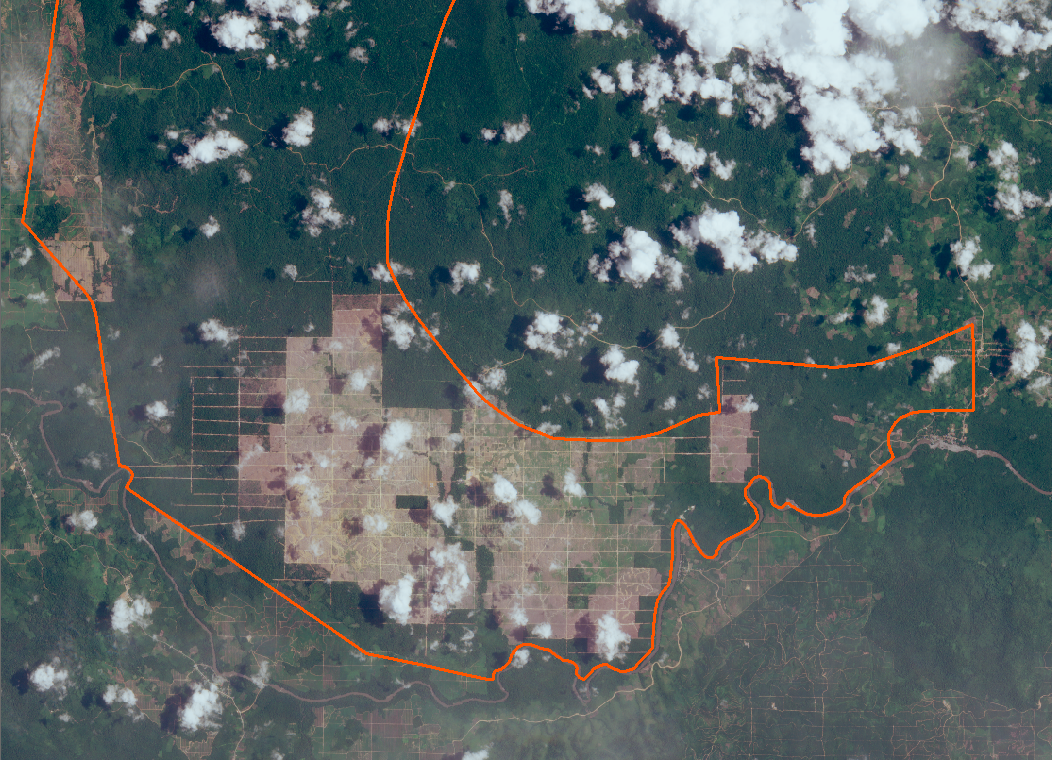
Figure 5: PT SML’s deforestation, April 2017.
Furthermore, in 2016, other SSMS’ subsidiaries also continued SSMS deforestation and peatland clearance:
- PT Mirza Pratama Putra: Deforested 500 ha (estimate) of potential High Carbon Stock (HCS) forest in 2016. PT MPP did not release a New Planting Procedure (NPP) notification as required by RSPO in 2016.
- PT Sawit Muli Utama: Deforested 200 ha from June 2015 to December 2016.
- PT Tanjung Sawit Abadi: Deforested 400 ha from June 2015 to December 2016.
- PT Menteng Kencana Mas: Cleared 700 ha of peatland from August to October 2015.
SSMS: Sustainability Policy Not Compliant with Buyers’ Policies
The NY Times stated April 25, 2017 that SSMS is reportedly supporting an orangutan sanctuary and has a reforestation program with the aim of planting 1 million trees by 2024. SSMS has published some commitments to sustainability in its daily operations. These commitments include a policy on no burning and zero waste, and a policy to conduct High Conservation Value (HCV) assessments. However, as shown below, SSMS’ sustainability policy is weak compared to industry standard NDPE policies.
- SSMS has not announced policies to follow the High Carbon Stock approach.
- SSMS has not announced policies to recognize rights of local communities to Free, Prior and Informed Consent (NASDAQ:FPIC) regarding new plantation developments.
- SSMS has not stated if they intend, to comply with the basic conventions of the International Labour Organisation (ILO).
- SSMS has not said if they will apply the United Nations Guiding Principles on Business and Human Rights.
SSMS: Supplying the Palm Oil Leakage Market
In 2014 and 2015, Wilmar, Golden Agri-Resources, and Apical all suspended purchases of palm oil from SSMS because SSMS violated their NDPE purchasing policies. These three clients accounted for 79 percent, 81 percent, and 53 percent of SSMS’ sales in 2013, 2014, and 2015 respectively. Several other smaller buyers also stopped buying from SSMS for the same reason. Given SSMS ongoing deforestation and peatland clearance potentially in violation of some of their clients’ NDPE policies, current SSMS clients maybe contributing to the leakage of unsustainable palm oil. SSMS current clients are shown in Figure 6 (below).
| SSMS Customers | Parent Company | |
| More than 10 percent of SSMS total sales | ||
| PT Karya Indah Alam Semesta | Wings Group | |
| PT Synergy Oil Nusantara | FELDA IFFCO /Tabung Haji | |
| PT Panca Nabati Prakarsa | Panca Nabati Prakarsa | |
| Less than 10 percent of SSMS total sales | ||
| PT Royal Industries Indonesia | Royal Industries Indonesia | |
| KGV Pte Ltd. | n.a. | |
| PT Global Interinti Industry | Global Interinti Industry | |
| PT Budi Nabati Perkasa | Sungai Budi Group | |
| PT Palm Mas Asri | Palm Mas Asri | |
| PT Bukit Palem | Bukit Palem | |
| PT Hasil Abadi Perdana | Hasil Abadi Perdana | |
| Pt Graha Inti Jaya | Julong Group | |
| PT Unilever Oleochemical Indonesia | Unile ver | |
| PT Multi Usaha Abadi | Multi Usaha Abadi | |
| Just Oil & Grain Pte Ltd | Just Oil & Grain | |
| Riya International Pte Ltd | Riya International | |
| PT Sinar Alam Permai | Wilmar International | |
| PT Techno Dua Indonesia | Teck Guan | |
| PT Sinarjaya Inti Mulya | Sinarjaya Inti Mulya | |
Figure 6: SSMS current clients.
As a result of SSMS losing it clients with NDPE policies in 2014 and 2015, SSMS’s largest new clients are mostly companies that have weak or nonexistent NDPE policies. This means that SSMS new clients are the traders and refiners that facilitate the trade in palm oil from non-compliant sources, which is called leakage.
Leakage is problematic because it prevents a level playing field. SSMS client Unilever was the primary promoter of a level playing field when its CEO Paul Polman reached out to all SE Asian palm oil traders and refiners in 2013. Polman successfully convinced them to adopt and implement NDPE purchasing policies.
In 2016, SSMS’s largest new clients were:
- PT Karya Indah Alam Semesta, a Wings Group subsidiary (13 percent of SSMS total sales). Wings Group products are mainly sold in Indonesia. The company also exports products to countries in the Middle East and the Philippines.
- PT Synergy Oil Nusantara (PT SON), a FELDA IFFCO and TH Plantations joint venture (13 percent of SSMS total sales). FELDA IFFCO, which is a separate joint venture between Felda Global Ventures (FGV) and IFFCO Holdings, integrates the entire value chain from oil palm cultivation to milling, refining, and processing. It has markets in China, Indonesia, United States, South Africa, Turkey, Middle East, India, Bangladesh, and Malaysia. TH Plantations Berhad is the publicly-listed subsidiary of Lembaga Tabung Haji, the Malaysian hajj pilgrims fund board. TH Plantations is engaged in the business of oil palm and rubber plantations in Malaysia, with a total landbank greater than 100,000 ha in Indonesia and Malaysia. FGV launched its own NDPE-policy in August 2016. But FGVs policy is currently in question following Chain Reaction Research disclosing FGV’s subsidiary allegedly clearing peatland in April 2017 in West Kalimantan.
- PT Panca Nabati Prakarsa, a medium-sized Indonesian company that processes vegetables oils into cooking oils, stearin, and palm fatty acid distillate (12 percent of SSMS total sales). The company produces mainly for the Indonesian market, including cooking oil brands Cemara, Majuan, and Minyakita.
- Royal Industries Indonesia is an integrated private company with its headquarters in Indonesia with an export network in more than 23 countries (8 percent of SSMS total sales). The company is owned by the Asif family.
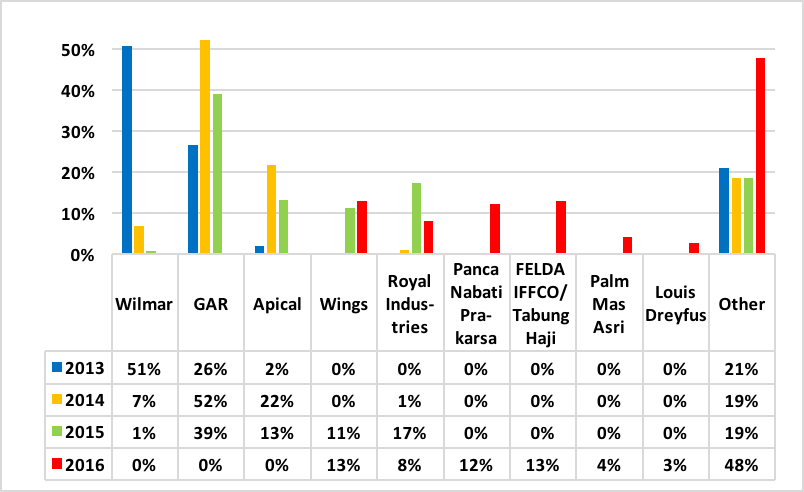
Figure 7: SSMS’ client percent revenue changes per year, 2013-2016.
Shown in Figure 7 (above), Wilmar, Golden Agri-Resources, and Apical stopped purchases from SSMS in 2016, but they have not severed all business relations with SSMS.
For example, Wilmar continues to supply SSMS with agricultural chemicals through its subsidiary PT Wilmar Chemical Indonesia. While not a violation of Wilmar’s NDPE purchasing policy as it applies only to Wilmar’s palm oil purchases, this relationship illustrates the limited scope of Wilmar’s NDPE policy.
Unilever: Does SSMS Ongoing Deforestation and Peatland Clearance Violate Unilever’s Sustainable Palm Oil Policy?
While Unilever has pushed SE Asian traders and refiners since 2013 to adopt NDPE policies and level the playing field, Unilever’s new palm oil refinery in North Sumatra, PT Unilever Oleochemical Indonesia, continues to purchase palm oil products from SSMS.
It appears that SSMS is continuing its deforestation and peatland clearance despite Unilever’s 2016 Sustainable Palm Oil Policy that covers its PT Unilever Oleochemical Indonesia refinery. Unilever’s policy states on p. 1:
The Policy applies to all of the palm oil Unilever buys, including crude palm oil, palm kernel oil, derivatives and fractions. It applies throughout Unilever’s global operations, including our investments in plantations and refining, and to all our suppliers and their entire operations, including traders and their third parties. The Policy is designed to drive sustainable market transformation, through collaboration beyond our own supply chains with key suppliers, governments, NGOs and the broader industry on the implementation of our five key principles.
This Policy is effective immediately, and we require suppliers to comply with our Principles for Sustainable Palm Oil throughout their operations.
Unilever was alerted to concerns related to SSMS deforestation and peatland clearance. In May 2017, a Unilever spokesperson indicated to a Dutch newspaper that the company is “highly concerned over the NGO accusations against SSMS and that it has set a deadline for SSMS to resolve a number of issues.” On June 2, 2017 Unilever issued a public statement in response to allegations it faces from buying palm oil from SSMS. Unilever’s statement in full states:
We have recently been made aware of allegations against palm oil supplier Sawit Sumbermas Sarana (SSMS) which we take extremely seriously. We expect the highest standards from all of our suppliers and strict adherence to the Unilever Sustainable Palm Oil Policy which mandates no deforestation, no new development on peat and no exploitation of peoples and communities.
We have urgently sought a response from SSMS. They have confirmed they are committed to comply with Unilever’s Sustainable Palm Oil Sourcing Policy and have established an independent verification process with Daemeter to review the allegations. The review is due to be completed in June and we will decide Unilever’s next steps based on the outcomes of the review.
We firmly believe that working in collaboration with suppliers and partners is the most responsible and effective means for us to address issues in our palm oil supply chain when they are raised. However, if SSMS is unwilling or unable of complying with our standards in a transparent and time-bound manner, we will be forced to suspend sourcing from them.
A Unilever decision about SSMS is reportedly forthcoming in June 2017. Unilever’s continued purchases from SSMS poses risks to both parties. Unilever faces potential reputational risk, regardless of the outcome of the independent review.
SSMS: Financial Risk Analysis
In order to analyze whether SSMS shareholders were affected by the company’s switch to the leakage market, Chain Reaction Research employed the following methodology:
- Has there been a change in the trend in SSMS revenue per ton and SSMS volumes versus the crude palm oil (CPO) market? How has operating profit trends change? Were there changes in ratios including receivables/sales and net working capital/sales
- How has SSMS compared to its peer group in net sales and operating profit?
- How has SSMS equity performed versus its peer group?
SSMS: Buyers NDPE Impact vs P&L, Balance Sheet and Revenue/CPO 2015-16
After a revenue decline of 9.3 percent to IDR 2,371 billion (USD 178 million) in 2015, revenues recovered by 14.8 percent to IDR 2,723 billion (USD 204 million) in 2016. Similarly, after a 7.9 percent decline in operating profit in 2015, operating profit recovered by 9.2 percent in 2016 to IDR 982 billion (USD 74 million).
Due to lower financial results (e.g. higher interest costs), higher tax rate and third party interest, SSMS’ net profit in 2016 did not recover from its 2014 bottom. It was 19.6 percent lower at IDR 592 billion. From 2014 to 2016, SSMS net debt increased 44x – from IDR 64 billion to IDR 2,870 billion. This 44x net debt increase is mainly due to investments and acquisitions. In Q1 2017, improving sales and profits trends continued, but SSMS net debt position continued to increase to IDR 3,462 billion, now 54x 2014 net debt levels.
Figure 8 (below) shows SSMS year-over-year (YoY) revenue growth per quarter 2015 to 2016. SSMS experienced a material decline starting in Q2 2015 which continued until Q1 2016. From Q2 2016, revenue recovered. Besides Q2 2016 volumes and the CPO price increases, both acquisitions and divestments had a positive impact.
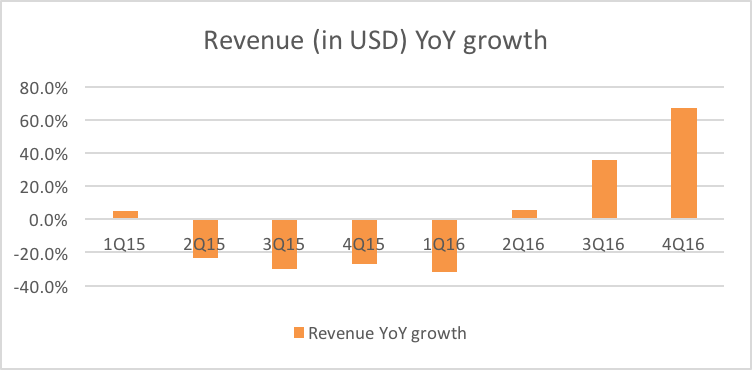
Figure 8: SSMS revenue (NYSEARCA:USD) year-over-year growth, 2015-2016.
As shown in Figure 9 (below), SSMS revenue/sales weakness from Q2 2015 onwards came from both weaker global CPO prices and weaker volumes. After SSMS had lost its three major buyers in H2 2015, it had to find substitute buyers in Q3 2015. Q2 2015 Wilmar and Apical represented 16 percent and 12 percent of SSMS revenue. Sales to PT Sinar Mas Agro Resources and Technology Tbk (SMART), generating 30 percent of SSMS revenue, also decreased to 3 percent. As shown in Figure 9 (below), it took SSMS one quarter to secure Royal Industries Indonesia and Wings Group as replacement buyers. By Q4 2015, SSMS sourced 28 percent of its revenue from them.
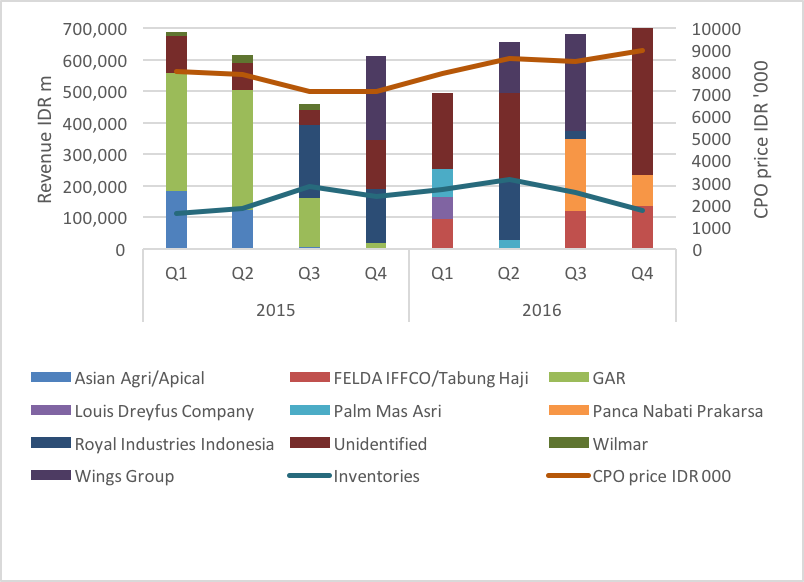
Figure 9: SSMS Quarterly revenue, customer base, CPO price and inventory, 2015-2016.
Did this ‘leakage switch’ have an impact on the revenues per ton? Chain Reaction Research compared the spot market CPO price with the net revenue per ton for SSMS, see below in Figure 9. Analysis concluded that there is not much difference between both prices in the period before and after the suspensions. SSMS new clients do not seem to have received discounts in order to incentivize them to buy SSMS non-complaint NDPE CPO.
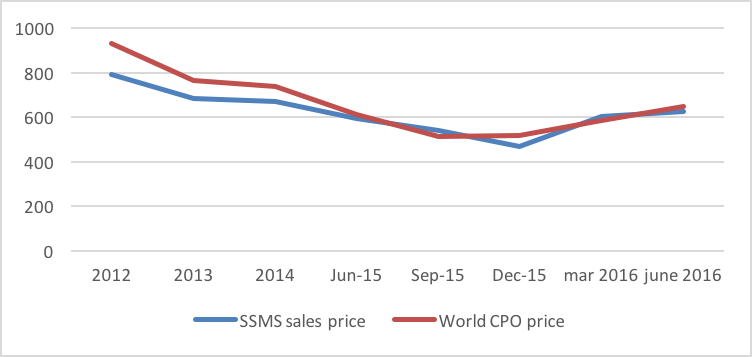
Figure 10: World CPO price per ton versus SSMS sales price per ton (in USD), 2012-H1 2016.
Net working capital remained mostly unchanged. Net debt increased by USD 240 million in 2015-2016 related to higher capital expenditures and both acquisitions and divestments. This represents 17 percent of the total enterprise value. SSMS net debt / EBITDA ratio grew to 2.3x from 0.0x in 2014.
SSMS: Revenues Saw Recent Recovery
As stated above, SSMS revenues have recovered since Q3 2016. Many factors have played their role in this development. These include market demand, growth and yield driven by hydrological cycles and temperatures, exchange rates and portfolio changes. In order to eliminate these external factors, Chain Reaction Research analyzed SSMS relative revenue performance versus its Indonesian peer group. This analysis was also done for the operating profit, which has also showed recovered since Q3 2016.
From Q4 2014 to Q4 2016, SSMS showed a higher growth in revenue, operating profit and margin than the average of nine companies (see Figure 11 below). In the first part of the period, Q4 2014 to Q4 2015, SSMS performed worse than the peer group. This is probably due to the fact that SSMS lost clients after Q2 2015. In the second part of the period, Q4 2015 until Q4 2016 (third column below) SSMS revenue, profit and margin growth has outpaced its competitors.
These outcomes suggest that SSMS two-part strategy has been successful from a revenue and operating profit point of view. They found new buyers for their non-NDPE compliant CPO and they acquired and divested concessions. In total, the recovery exceeded the losses during the previous period, relative to their Indonesian peer group. Their 6 percent out-performance in operating profit equals USD 5 million. Applying a discounted cash flow valuation model, this equals USD 32 million. Note that this is relatively small increase versus their large USD 240 million increase in net debt. Theoretically, the net impact equals 14 percent of EV – or USD 208 million. This is a first indication of a material impact of the ‘leakage’ switch.
| Q4 ’14 –
Q4 ’16 |
Q4 ’14 –
Q4 ’15 |
Q4 ’15 –
Q4 ’16 |
|
| Total revenue growth | 19.9% | -0.7% | 26.8% |
| Total operating profit growth | 6.1% | -13.3% | 61.3% |
| Change in operating margin (%-points) | 2.3% | -2.0% | 5.0% |
Figure 11: Percentage point difference of SSMS growth versus Indonesian peer group. Indonesian peer group consists of 10 companies: Eagle High Plantations, Dharma Satya Nusantara, Tunas Baru Lampung, Salim Ivomas Pratama, Sampoerna Agro, Austindo Nusantara Jaya, Sinar Mas Agro Resources and Technology, Astra Agro Lestari, Bakrie Sumatera Plantations and SSMS.
SSMS: Leakage Pricing Model Forecasts SSMS Share Price
SSMS ‘leakage switch’ had a positive impact on SSMS’ relative performance in revenues and operating profit, but its net debt increased by USD 240 million. This was partly related to capital expenditures and portfolio changes. On balance, the EV impact could have been a negative USD 208 million, or 14 percent of the EV. The theoretical impact is negative 17 percent on the current market capitalization of USD 1.2 billion.
One Important question is whether this theoretical impact is confirmed by the real impact on the market capitalization. Have equity investors really been hurt?
As shown in Figure 12 (below), Chain Reaction Research compared SSMS’ share price movement versus their peer group and several relevant palm oil indices from May 27, 2015 – the day of SSMS peak share price – until April 28, 2017. The average of the benchmark/peer groups is negative 4.7 percent, while SSMS performed materially worse, i.e. negative 25.1 percent. The difference is nearly 20 percentage points. This 20 percent underperformance in SSMS share price is broadly in line with Chain Reaction Research’s forecast of negative 17 percent.
| Total return 5/27/15 to 4/28/17 | |
| Peer group of 10 | -0.1% |
| Peer group excluding high/low | -11.7% |
| FTSE Bursa Malaysia Palm Oil Plantation Index | -5.1% |
| Jakarta Stock Exchange Agricultural Index | -1.8% |
| Average | -4.7% |
| SSMS | -25.1% |
Figure 12: SSMS share price and index development in IDR. Same Indonesian peer group as in Figure 11.
As shown in Figure 13 (below), despite SSMS underperformance, SSMS is still valued higher versus its peers. However, versus a two-year average, the premium in P/E, in P/BV and in EV/Revenue has slightly declined.
| May 2, 2017 | P/E (NYSE:X) | EV/EBIT | P/BV | EV/Rev |
| SSMS | 18.5 | 14.1 | 4.7 | 5.4 |
| Peer group | 13.5 | 10.1 | 1.9 | 1.7 |
| SSMS premium vs peer group | 38% | 40% | 145% | 224% |
| SSMS 2-year average premium | 55% | 36% | 168% | 256% |
Figure 13: Key valuation ratios 2017/18E versus peer group. Same Indonesian peer group as in Figure 11.
This underperformance may be explained by shareholders moving out of the stock. Since the Chain Reaction Research 2013 SSMS report, its 0.3 percent foreign shareholders base has declined further. This may not have impacted its valuation. While SSMS equity is still valued materially greater than its peer group, its valuation has devalued since its 2015 NDPE buyers’ suspension.
Unilever’s Financial Impact: Key SSMS Customer
How financially material is Unilever as a key SSMS customer?
In Q1 2017, trade receivables to Unilever Oleochemicals Indonesia amounted to IDR 57.6 billion (USD 4.3 million) – a 41x increase over Q4 2016 trade receivables of IDR 1.4 billion (USD 105 thousand). In Q1 2017, Unilever’s IDR 57.6 billion (USD 4.3 million) trades payable was 61 percent of SSMS’ receivables to third parties. Additionally, Unilever Oleochemicals Q1 2017 unearned revenue was IDR 19.2 billion (USD 1.4 million) compared with zero Q4 2016.
Analysis suggests Unilever role as SSMS’ key client has further increased. However, Unilever still does not belong to the group of large customers who contributed each more than 10 percent to SSMS’ sales in Q1 2017.
However, looking to a historical receivables / sales ratio of 10 percent but assuming that Unilever is paying later in the accounts payable cycle than SSMS’ customers – assuming a 20 percent ratio for Unilever, SSMS’ annual sales to Unilever might be IDR 285 billion (USD 21.4 million) which is approaching the 10 percent threshold where SSMS would recognize Unilever as a major client.
The implication of this is that an exit of Unilever as a customer, based on the results of the independent review, might have a material impact on SSMS’ future sales and earnings.
Conclusions: Future SSMS Customer and Revenue Losses
While SSMS in the first 12 months after its NDPE suspension saw a decrease in its revenues and operating profit, the combination of new non-NDPE customers and portfolio changes has led to a financial recovery over the following 12-months. However, this was at the expense of much higher net debt.
During this period, SSMS’ market capitalization and valuation also underperformed versus its peers.
As shown before, SSMS has been hurt by its buyers’ suspensions since 2015. The specific issue of Unilever Oleochemicals Indonesia as an increasingly important customer is a material reputation risk to Unilever’s shareholders and a material financial risk to SSMS shareholders. SSMS current premium valuation holds material risk for shareholder value’ destruction, in particular related to Unilever’s increasing importance as a client.
If you have any questions, comments, or suggestions for the authors, please contact Gabriel Thoumi, CFA, FRM.
Disclaimer: This report and the information therein is derived from selected public sources. Chain Reaction Research is an unincorporated project of Aidenvironment, Climate Advisers, and Profundo (individually and together, the “Sponsors”). The Sponsors believe the information in this report comes from reliable sources, but they do not guarantee the accuracy or completeness of this information, which is subject to change without notice, and nothing in this document shall be construed as such a guarantee. The statements reflect the current judgment of the authors of the relevant articles or features, and do not necessarily reflect the opinion of the Sponsors. The Sponsors disclaim any liability, joint or severable, arising from use of this document and its contents. Nothing herein shall constitute or be construed as an offering of financial instruments or as investment advice or recommendations by the Sponsors of an investment or other strategy (e.g., whether or not to “buy”, “sell”, or “hold” an investment). Employees of the Sponsors may hold positions in the companies, projects or investments covered by this report. No aspect of this report is based on the consideration of an investor or potential investor’s individual circumstances. You should determine on your own whether you agree with the content of this document and any information or data provided by the Sponsors.


