
“We tend to hang onto our views too long simply because we spent time and effort coming up with those views in the first place.
This leads to confirmation bias and an anchoring to strongly held beliefs even if the evidence fails to support them anymore.”
– James Montier, The Little Book of Behavioral Investing
“The key to money management. It’s making a lot of money when you’re right and minimizing it when you’re wrong.”
– Stan Druckenmiller
One of the charts I like to keep an eye on looks at inflation and its impact on stock prices. In rising inflationary periods, stocks tend to struggle. When inflation is falling, stocks tend to perform well.
Trend following can help signal what cycle we are in. When I saw the following chart earlier this month I took note. I shared it with my team and share it with you today. In short, it shows that rising inflation is not good for stocks. A “sell” signal for stocks. Here is how to read it:
- The bottom section plots the consumer price index “CPI” (red price trend line) and also the average price of that line over the last six months. The idea is to see if the current price is above the smoothed six-month average trend line or below. Up-trend or down-trend.
- The CPI is calculated by the Bureau of Labor Statistics and comes out monthly. The index includes a variety of goods, such as food, clothing, automobiles, homes, household furnishings, household supplies, fuel, drugs, recreational goods, doctor fees, lawyer fees, rent, repair costs, transportation fares, public utility rates, federal, state and local taxes.
- By smoothing the average price we can see what the general trend in consumer price inflation looks like. Moving higher? Moving lower?
- When the CPI rises above its six-month average price by more than 0.6%, a sell signal is triggered for the stock market. The indication is a period of rising inflation. The theory and reality is that when the costs of things rise, corporate profits are less, earnings are less and stock prices are negatively impacted. Plus your money and mine just doesn’t go as far when the price of things we must buy goes up.
- The reverse is true when inflation declines. When the CPI declines below its six-month average, a “buy” signal for stocks is generated.
- Up arrows mark the “buy” signals, down arrows mark the “sell” signals.
- The most recent signal occurred on 12-31-2016: a sell signal, which suggests rising inflation risk and a more challenging period for stocks.

Source: Ned Davis Research
Take a look at the upper left-hand section of the chart. Following this process increased annual gains by 50% over a buy-and-hold approach. This is a good example of a simple “trend following” approach to investment management.
It is not perfect and there are times it outperforms and times when it underperforms, but it did, over the entire period, beat buy-and-hold by more than 50%. Note too it did a good job of avoiding the 1987 crash, the challenges in 1992 and most of the 2007/08 financial crisis. It did not help in 2000-2002. But 50% improvement over buy-and-hold over many years is pretty good. Avoiding large drawdowns is key.
Looking just at inflation, next is the NDR Inflation Timing Model chart. I’ll continue to share it with you from time to time. The model measures the year-over-year rate of change in inflation. The model consists of 22 indicators that primarily measure the various rates of change of such indicators as commodity prices, consumer prices, producer prices and industrial production. Inflation is on the rise.
Here is how you read the chart:
- The model totals all the indicator readings and provides a score ranging from +22 (strong inflationary pressures) to -22 (strong disinflationary pressures) – red line in the bottom section of the chart.
- High inflationary pressures are signaled when the model rises to +6 or above.
- Low inflationary pressures are indicated when the model falls to zero or less.
- Signals are marked with up and down arrows in the upper section of the chart.
- Current forecast is signaling rising inflation.
Source: Ned Davis Research
I wrote a short paper some time ago called “Trend Following Works!” Listed are numerous academic studies that look at individual stock as well as asset class price momentum that found trend following to be one of just a few investment factors that works consistently over time.
As a trading strategy, trend following is exceedingly effective and profitable over time. Most strategies are straightforward in methodology and there are many individuals, past and present, famous or obscure, who have used trend following to success and riches. Paul Tudor Jones and John William Henry II and his turtles come to mind.
But trend following requires, above all else, discipline, sound process and patience from the investor/trader/money manager. Like the inflation process described above, the technical aspect of trend following is in fact quite simple and may produce a statistically significant 71% profitable signals that also means that 29% were not. I’ll take the 50% long-term bet and the smoother ride to that win but that’s the point… stay with it.
A quick note on chart #1 above: the data in the chart does not include the reinvestment of dividends, so add in roughly 3% more to both sides of the return. Same conclusion… trend following works. *I don’t personally trade the inflation trend following process though it does help inform my work. Another quick note, my fundamental view is that inflation may rise a bit and the debt bubble will bring inflation back down. Hard to have inflation in a deleveraging world. But my fundamental view could prove to be wrong. I find it easier to follow a simple rules-based trend process.
I do see the potential, as Ray Dalio might say, for a “beautiful” way out of this debt mess. Perhaps our world leaders can come together, hold hands, pinky promise never to do it again and forgive the debt. Click. Gone. It would require strict agreement on currency controls so one country doesn’t cheat the others. Could it happen? Maybe… Likely? I have my doubts.
Might it work? Not sure but the existing alternative is not so good either. The movement towards protectionism is real so I’m not so sure the mood is right just now. Anyway… we are currently seeing signs of inflation and the above model just signaled sell. Keep it on your radar.
How do you size the above (should you favor that approach) and other processes into your clients’ portfolios? Consider creating a core allocation that diversifies to a handful of trading strategies. Perhaps 20% to 60% of your total portfolio. You decide. Do some analytics and see how it impacts your portfolios.
Why? Equity market valuations are the second highest in history. Why? We are near 5,000-year lows in interest rates. The 35-year bull market in bonds likely ended last July when the 10-year yield bottomed at 1.37%. Bonds just can’t help our portfolios like they did in the past. Why? Global central bankers have experimented with the system in ways never witnessed before.
Why? Global debt remains extreme here, there and pretty much everywhere. Why? Pension promises are not going to be able to be met. Why? Risk remains elevated. Why? Because, like the tech bubble before it, money is herding into low-fee passive index products.
And maybe the biggest why of all? Nearly 75 percent of investable assets in the U.S. will soon be in the self-directed hands of pre-retirees and retirees who simply can’t risk another 50% decline. Because if your $100,000 nest egg drops to $50,000, you will need a 100% return just to get back to even. Perhaps that is the single most important reason why.
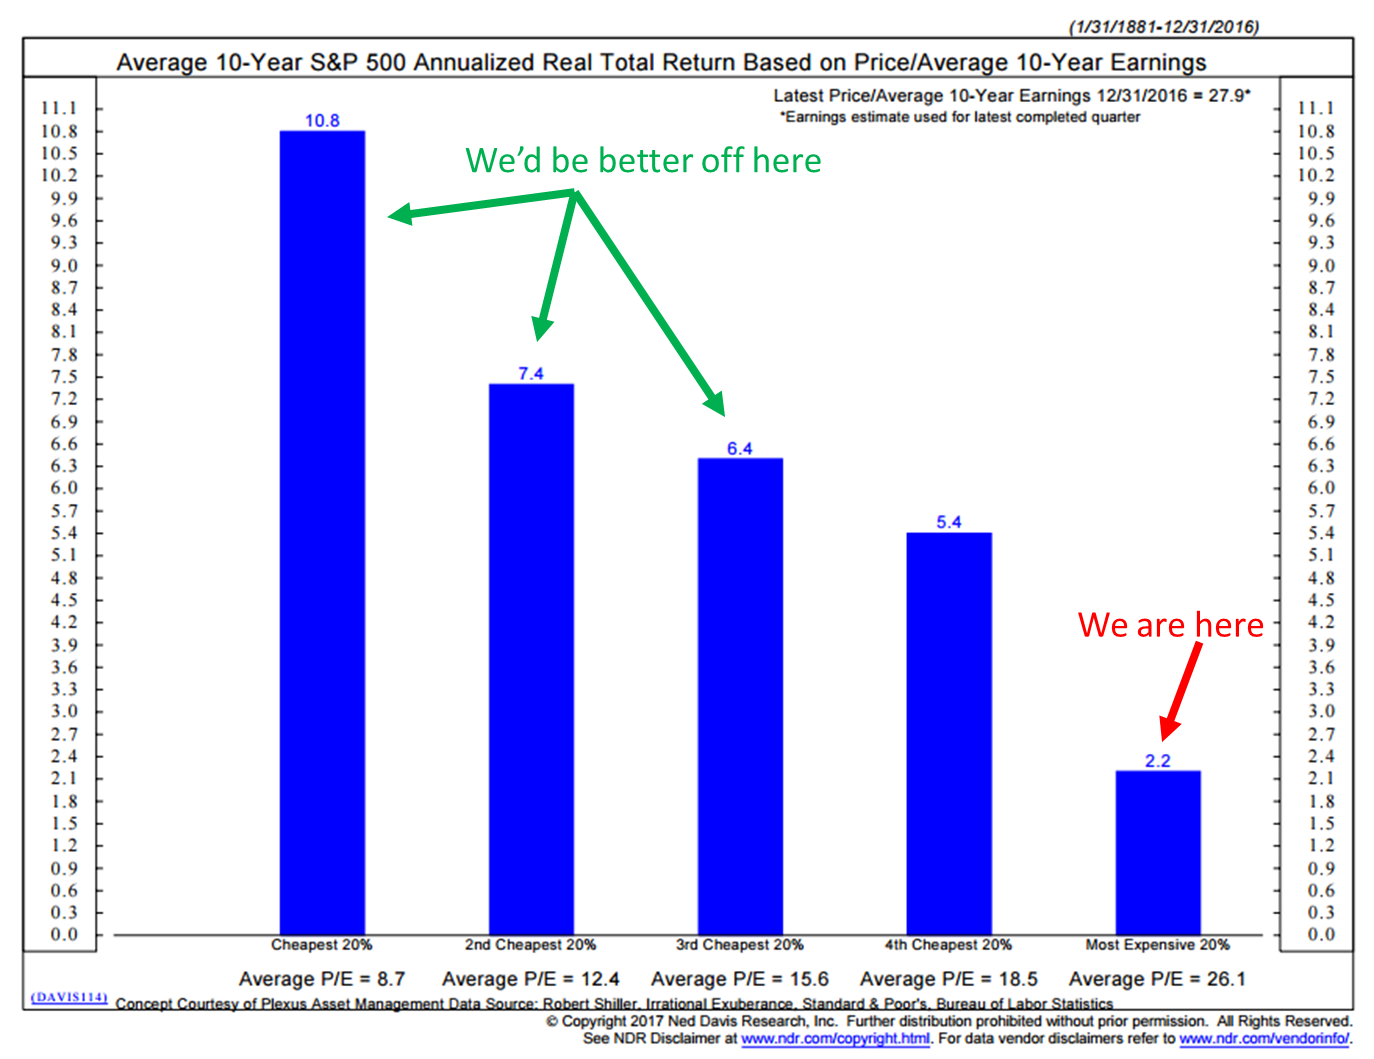
We have to figure this out and we have no idea what the remedy will be. We can watch it without emotion and I believe we can get to a good place no matter what happens. As I shared last week, as it relates to potential 10-year forward equity market returns, “we are here” but “we’d be better off here.” Let’s be smart on our way to better long-term opportunity.
Source: Ned Davis Research
I’m just back from the 10th Annual Inside ETFs Conference in Hollywood, Florida. I presented my views on how to use trend following to trade gold ETFs. You’ll find those charts below in the Trade Signals section (you’ll need to click the link to get to the charts).
As I walked through the exhibit hall, I was amazed at the number of new ETFs both from existing providers and newcomers. There is always a bull market somewhere they say. The tools exist for all investors like never before. Most of them are new in just the last five years. That’s pretty cool and good news for you and me.
I tweeted this out during the conference. For me, even cooler.
BTW, you can follow me on Twitter here or via LinkedIn here. When I read something on the economy and investing that I believe is meaningful and worthy of your review, I often share the links via Twitter and LinkedIn.
Below, you’ll find a link to Jeremy Grantham’s just released quarterly letter and a summary of this week’s Trade Signals (most are trend following based). So grab a coffee and find your favorite chair.
? If you are not signed up to receive my weekly On My Radar e-newsletter, you can subscribe here. ?
Included in this week’s On My Radar:
- GMO’s Quarterly Letter — The Road to Trumpsville: The Long, Long Mistreatment of the American Working Class
- Trade Signals – Equity Trend Remains Bullish, Sentiment Remains Excessively Bullish, Bond Trend Bearish – 01-25-2017
GMO’s Quarterly Letter – The Road to Trumpsville: The Long, Long Mistreatment of the American Working Class
Jeremy Grantham is one of my favorite thinkers. I’m of the view that we have reached a period of peak government. That may or may not be a good thing depending upon your view. I think it’s a good thing, but I feel there is much to fix. Let’s start with campaign finance reform and eliminate it!
I also believe we are on the path to a better place. That is not an endorsement of President Trump. His loose behavior troubles me, but I hold a positive vision that we humans can do right and will do right. Balance, compassion, love and kindness. Let’s start there. That’s my prayer.
Jeremy does a great job expressing where we are today and touches a little bit on how we got here. We’ve got work to do. The piece is well worth the read.
Click here. Jump to page nine.
Trade Signals – Equity Trend Remains Bullish, Sentiment Remains Excessively Bullish, Bond Trend Bearish
S&P 500 Index — 2,280 (1-25-2017)
CMG Tactical Index Summary:
CMG TREND Series of Portfolios. See important disclosures below.
The CMG Tactical Fixed Income Index, CMG Tactical All Asset Index, CMG Tactical Equity Index and CMG Beta Rotation Index are rules-based indexes that re?ect the theoretical performance an investor would have obtained had it invested in the manner shown and do not represent actual returns, as investors cannot invest directly in the Indexes. Additionally, as noted, returns are gross of any fees and trading costs.
Trade Signals — Dashboard
Equity Trade Signals (Green is Bullish, Orange is Neutral and Red is Bearish):
- CMG Ned Davis Research (NDR) Large Cap Momentum Index-Active Trend: Buy Signal – Bullish for Equities
- Long-term Trend (13/34-Week EMA) on the S&P 500 Index: Buy Signal – Bullish Cyclical Trend for Equities
- Volume Demand (buyers) vs. Volume Supply (sellers): Buy Signal – S/T Bullish for Equities
- NDR Big Mo: See note below (active signal: Buy Signal on March 4, 2016 at 1999.99)
- Don’t Fight the Tape or the Fed: Indicator Reading = -1 (Neutral for Equities)
Investor Sentiment Indicators:
- NDR Crowd Sentiment Poll: Extreme Optimism (S/T Bearish for Equities)
- Daily Trading Sentiment Composite: Extreme Optimism (S/T Bearish for Equities)
Fixed Income Trade Signals:
- Zweig Bond Model: Sell Signal
- CMG Managed High Yield Bond Program: Buy Signal
- CMG Tactical Fixed Income Index: JNK & BIL (HY Bonds and Treasury Bills)
Economic Indicators:
- Global Recession Watch Indicator – Low Global Recession Risk
- Recession Watch Indicator – Low U.S. Recession Risk
- Inflation Watch – High Inflation Risk. The focus has shifted from deflation to inflation.
Gold:
- 13-week vs. 34-week exponential moving average: Sell Signal
- Daily Gold Diffusion Model: Buy Signal
- Daily Gold Model: Buy Signal
Important: Not a recommendation to buy or sell any security. For information and discussion purposes only. Consult your investment adviser regarding investment objectives, suitability and risk tolerance.
I hope you find the information helpful in your work. For informational purposes only… Not a recommendation to buy or sell any security. The weight of equity trend evidence remains bullish. The trend in interest rate trend, as measured by the Zweig Bond Model, remains bearish for high quality bonds. High yield bonds and gold remain in short-term trend buy signals. The CMG Tactical All Asset Index remains largely invested in equities (risk on). Keep a close eye on Don’t Fight the Tape or the Fed chart below. Especially the Fed.
Click here for the charts and explanations.
Personal Note
I will be in Dallas on February 1 for the S&P Index Conference. If you are in the Dallas area, the agenda for the S&P Conference is here. Meetings in Salt Lake City follow February 8-10. My skis are coming with me! I’ll be presenting at a meeting in Kansas City on February 23.
Can you believe January is almost behind us? Blink. Gone. It’s been warm here in the Northeast but not as nice as the weather in Florida. Tomorrow, I’m watching my son Matthew compete in a freestyle ski event. That should be really fun. I do love the short business trips, but it is so nice to be home.
Here are a few photos from the conference. I particularly like the sunrise.
Have a wonderful weekend! Wishing you and your family the very best.


