“Davidson” submits:
The question of the season “Is there anything behind the rise in market prices since the election?”
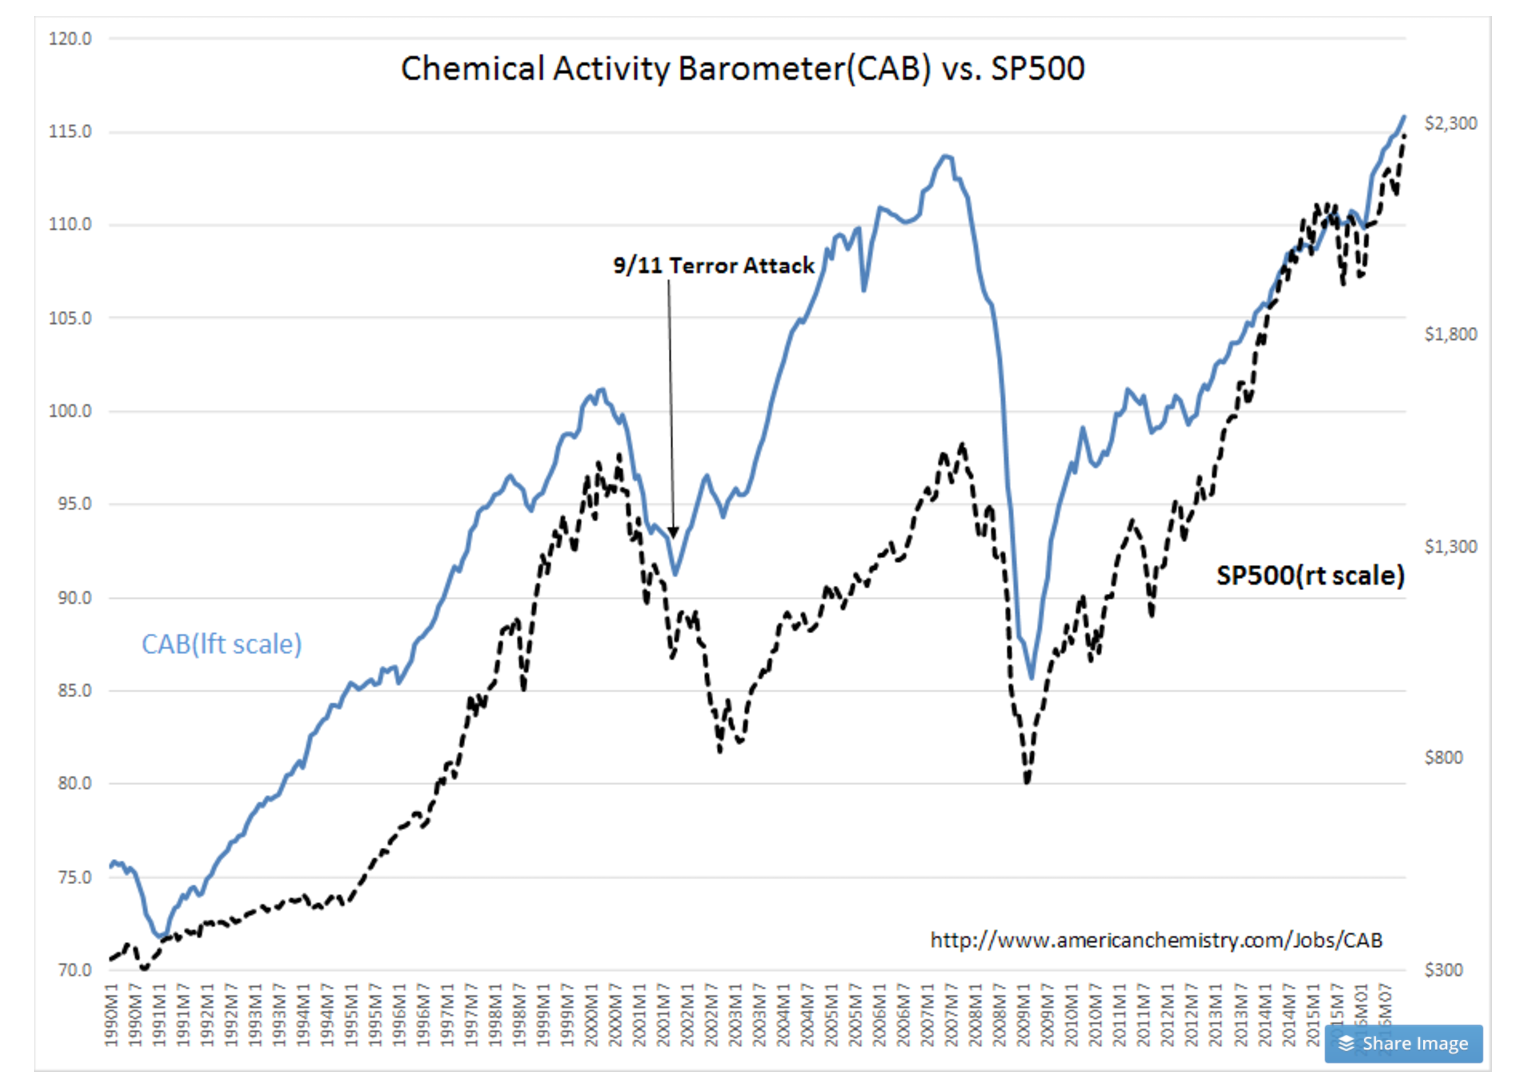
The answer lies in measures of economic activity. The answer is very a definite, “Yes!”. The Chemical Activity Barometer (CAB) has been tabulated back to 1919. It was first introduced June 2012. It is one of the more useful economic indicators. It is a composite of diverse economic data capturing economic activity in the US chemical production. It includes rail car loadings, hours worked in the industry and tons of product produced. The CAB is often signaling the economic trend when the investment markets are in confusion. The CAB has a strong correlation with the SP500 and has a history of forecasting economic cycles and equity markets by ~6mos. It shows the impact of the US$ strength in Dec 2014-March 2016. US$ strength has hurt commodity prices and production as well as construction/mining equipment exports of high value industrial goods. We had the equivalent of an industrial recession. Since March 2016, it appears that we have worked through a period of adjustment and the economy has continued its expansion.
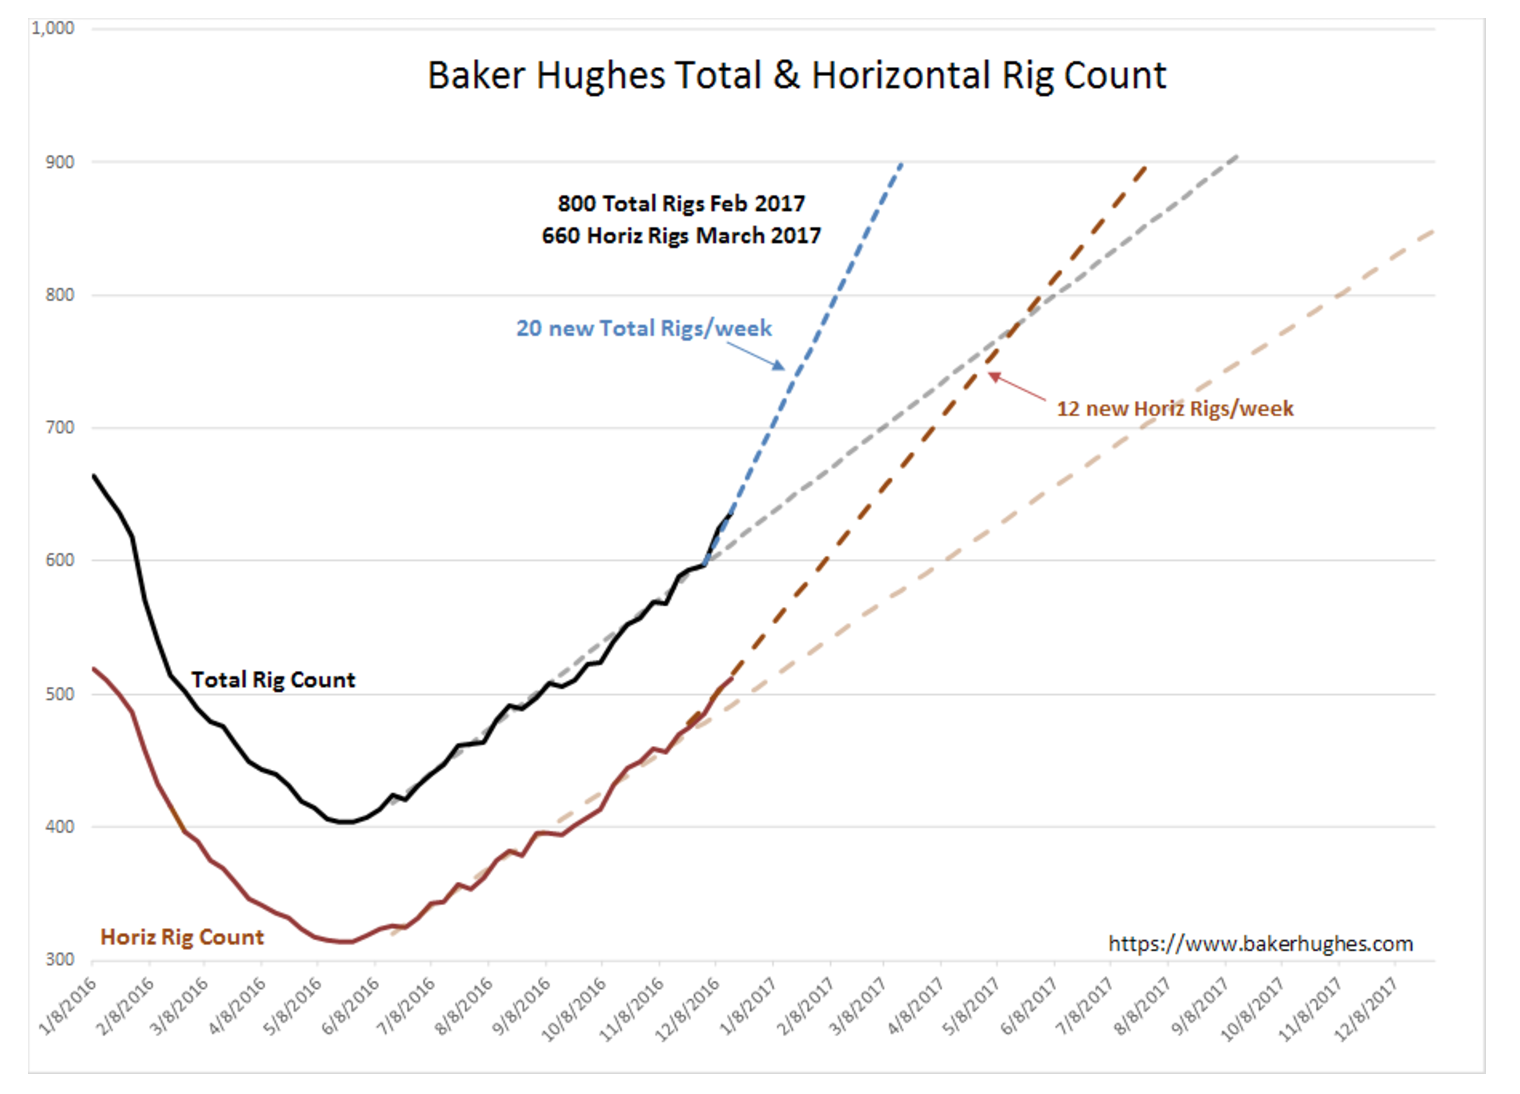
Even though the US$ has remained elevated with the “Trump Rally”, orders for industrial goods are reported to have begun turning higher. Importantly, the Baker Hughes Rig count reflects improvement in oil/gas exploration industry since May 2016. The US energy industry is a user of chemicals and industrial equipment. Since the election, the Baker Hughes Rig Count rose at an accelerated pace. It is impossible to predict if this new pace will be maintained, but the acceleration reflects a more optimistic outlook for this industry. If the current pace holds, we could see 800 Total Rigs by Feb 2017 and 660 Horizontal Rigs by March 2017. 100% gain in 12mos. This should result in higher employment levels and prove beneficial for Retail Sales and Home Sales..
Single-Family Housing Starts jump on election as did Mtg Credit Avail Index and HMI. The “Trump Rally” being dismissed as” delusional” by many has solid financial backing with the increase in Single-Family Starts and the sharp improvement in Mortgage Credit Availability Index.
The HMI is a sentiment index which means it is determined by market psychology. Market psychology is always something to be distrusted if it is not backed by economic fundamentals. We have that support for the HMI in MCAI and Single-Fam Starts.
There is much to like in these reports. It is data like this which indicate that an acceleration in economic activity supports the rise in equity prices we are seeing.