
Where you want to be is always in control, never wishing, always trading, and always, first and foremost protecting your butt.”
“I believe the very best money is made at the market turns.
Everyone says you get killed trying to pick tops and bottoms and you make all your money by playing the trend in the middle.
Well, for twelve years, I have been missing the meat in the middle but I have made a lot of money at tops and bottoms.”
“At the end of the day, the most important thing is how good are you at risk control.”
“The whole trick in investing is: “How do I keep from losing everything?”
— Paul Tudor Jones
[drizzle]Early each month, I like to look at valuation metrics. They remain high. Today, you’ll find the most recent charts (Buffett’s favorite, median P/E, and a few other interesting links when you click the orange On My Radar link below.
We’ll also take a look at what valuations are telling us about probable 7- and 10-year forward returns. I believe risk is most when we feel it least and the risk is least when we feel it most. Today, we feel it least.
I believe there are several bubbles in place today: one is in fixed income (a debt mess here, there and everywhere – it will require restructuring) and another is in passive equity investing. My friends at 720Global call it “Passive Negligence.” You’ll find some thoughts around that thinking as well.
We humans are herd beings. In 1999, it was tech. Now it’s bonds, high yield debt and passive index funds. What I find concerning, and you may as well, is that 75% of all the money will be in the self-directed hands of pre-retirees and retirees (by 2020, according to BlackRock).
My kids have time to dollar cost average over many years. So what if forward returns over the coming seven years (as you’ll see today) are a negative -3.10%. That means a big sell-off, which is big opportunity for dollar cost averaging. At 55, I have less time, but for my friends on the front-end of the baby boomer curve, well, they just don’t have the years it will take to overcome another 50% hit.
Can you imagine the panic that will ensue when the next recession right-hook hits stocks square in the mouth? Behavior will not change. The majority of investors will flee to safety. They’ll sell when they should be buying and they’ll buy when they should be selling.
You don’t need to take that hit…
Tony Robbins interviewed one of the best traders of all time, Paul Tudor Jones.
I teach an undergrad class at the University of Virginia, and I tell my students, “I’m going to save you from going to business school. Here, you’re getting a $100k class, and I’m going to give it to you in two thoughts, okay? You don’t need to go to business school; you’ve only got to remember two things. The first is, you always want to be with whatever the predominant trend is.
My metric for everything I look at is the 200-day moving average of closing prices. I’ve seen too many things go to zero, stocks and commodities. The whole trick in investing is: “How do I keep from losing everything?” If you use the 200-day moving average rule, then you get out. You play defense, and you get out.”
Tony then asked Paul, “Since asset allocation is so important, let me ask you: If you couldn’t pass on any of your money to your kids, but only a specific portfolio and a set of principles to guide them, what would it be?”
Paul answered, “I get very nervous about the retail investor, the average investor, because it’s really, really hard. If this was easy, if there was one formula, one way to do it, we’d all be zillionaires. One principle for sure would get out of anything that falls below the 200-day moving average.”
Learn how trend following strategies can help you participate and protect.
Ned Davis Research (NDR) looked at optimal moving average (“MA”) data since 1901. NDR found that the 200-day MA was most optimal over the entire period, but the 100-day MA was the better moving average in the period that ended in 1981. OK – use something and stick to it.

Source: Ned Davis Research
As you can see in the next chart, by and large, you catch the majority of the trend and avoid the majority of the downtrend.
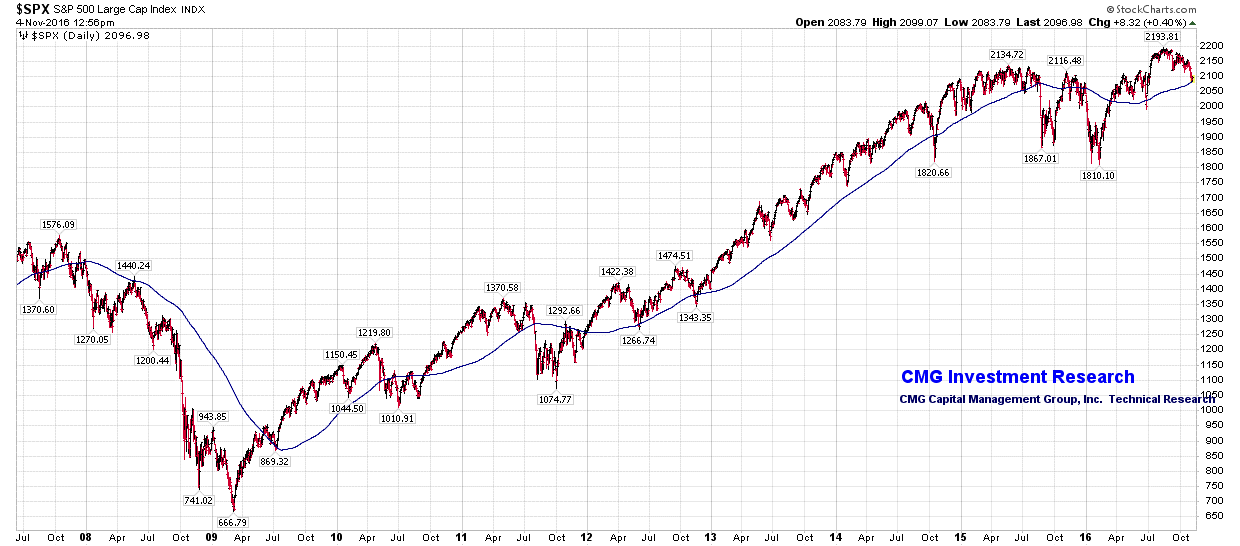
The point is you can put in place a process that can work. The key is finding processes you can have the conviction and discipline to stick to.
As a quick aside: At CMG, we run trend following trading strategies. If you are an advisor client of ours, please understand that the weekly OMR is about global macro-economic issues. The intent is to stimulate ideas and to present ideas and commentary in a way that can help you educate your clients. I know you know this material. OMR sets the base case for the importance of risk management. Our strategy material, available to you separately, can better explain our strategies and where they might fit in your client portfolios.
My strongest advice is to diversify to a handful of trend following trading strategies. This goes for both the equity markets and fixed income markets. Mohamed El-Erian is telling you to raise some cash. I think El-Erian is spot on.
I’m sure you have many clients with equity positions they have held for years and they intend to hold for many more. For such positions, consider out-of-the money put options to hedge against declines of greater than 20%. Overcoming a 20% decline takes a 25% subsequent return. Overcoming 50% takes a 100% return. And that -75% post-tech bubble wreak? 300%. It’s all in the math:
Source: Crestmont Research
Click here for an education piece we wrote titled, The Merciless Math of Loss
I’m on record calling for a 40% to 60% market correction. Best guess is within 12-18 months. The problem? Valuations, the lowest yields in history, record high debt, near record high margin debt and an aged economic cycle. Recessions come one or two times a decade. The last one was eight years ago. If you think the Fed is all powerful, just remember what Greenspan was saying post-2008. His data was “flawed.” Right!
To get to the other side of the next dislocation, you need to overweight to strategies that can play defense and get out. Investing is about compounding over time. Minus 50 torpedoes the math. If you do nothing else, listen to Paul Tudor Jones. The 200-day moving average rule isn’t perfect but it’s pretty darn good. It helps you systematically raise cash and put you in an enviable positon to buy the bargains the next correction will present to you.
Let’s look at valuations. You’ll also find a great chart from Morgan Stanley showing how low forward returns are likely to be (based on current high valuations). We’ve done similar work and I think you’ll like how they show their data. I hope you find this week’s post helpful.
Included in this week’s On My Radar:
- Valuation Charts and Comments
- Passive Negligence – from 720Global
- Government Pension Plans are Heading for Disaster
- Trade Signals – Pessimism Rising, Gold Cyclical Bull Remains, Fixed Income Sell Signals – 11-2-2016
Valuation Charts and Comments
Median P/E – 21.9 (lower than a month ago): Median means 250 of the 500 stocks have a higher P/E and 250 a lower P/E. Think of it as the P/E in the middle. I like it because we can then look at historical, actual reported, and see what the market return averaged the subsequent 10 years. More on that follows.
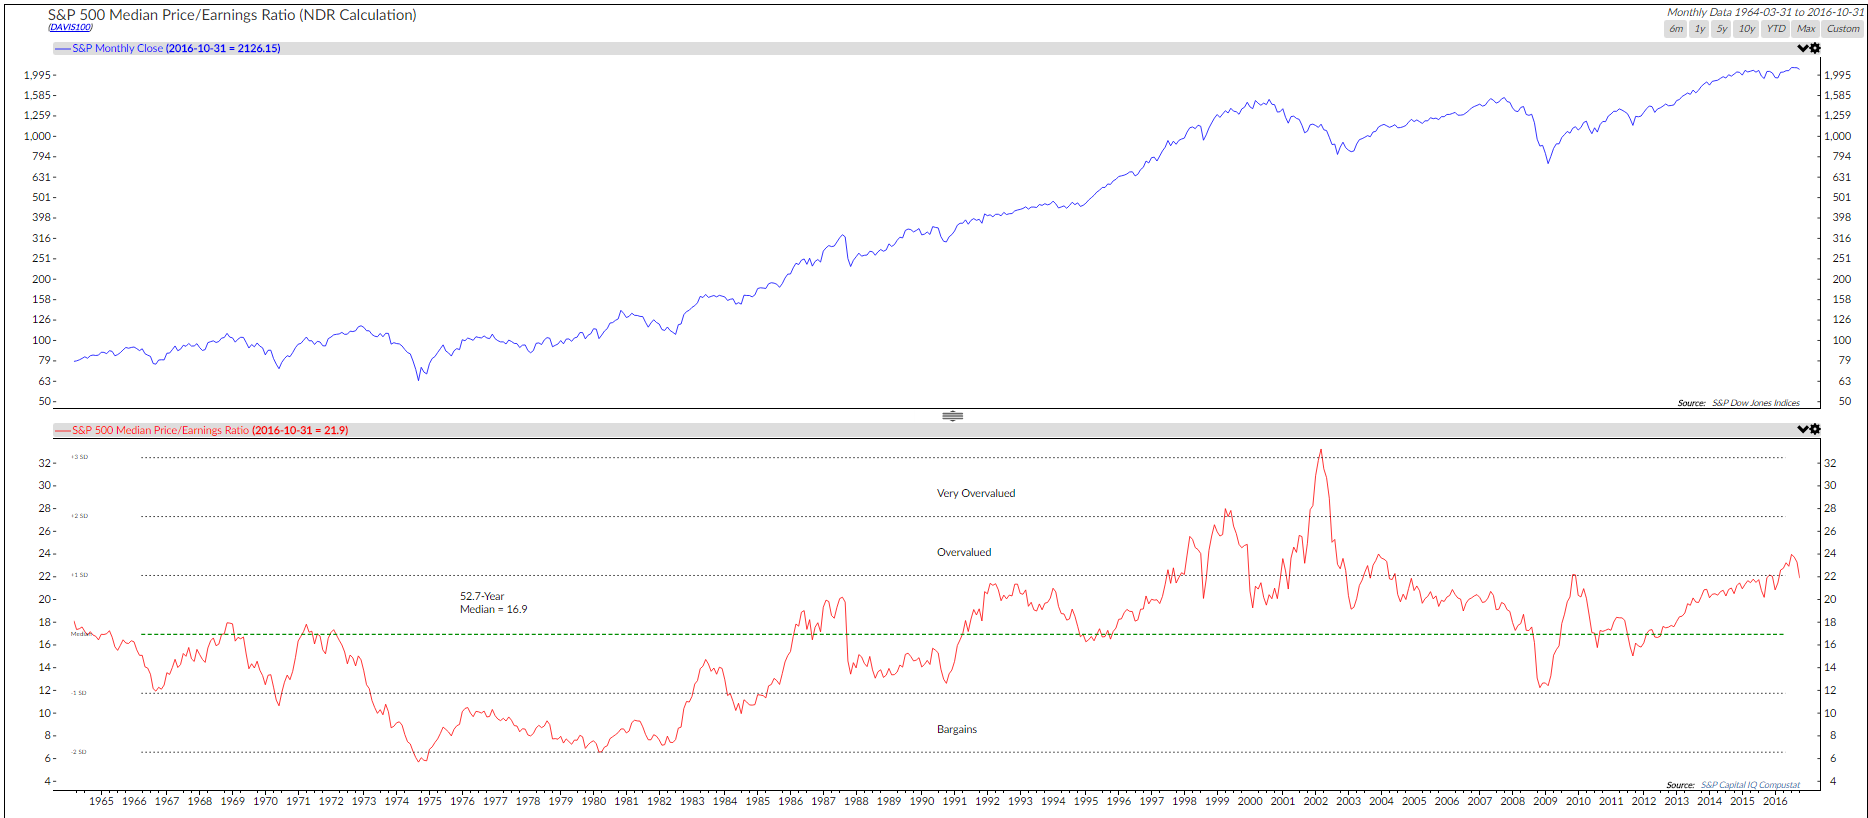
Median P/E is telling us that the market needs to decline 22.6% to get us to “Median Fair Value.”
Median is high but not as high as it was just a few months ago. I’d handicap the market as 2,149.54 as the upside range and 1,645.64 as the downside target. It will be all-out panic that might take us to 1,141.74 (undervalued).
This from dShort:
Here is a summary of the four market valuation indicators we update on a monthly basis.
– The Crestmont Research P/E Ratio (more)
– The cyclical P/E ratio using the trailing 10-year earnings as the divisor (more)
– The Q Ratio, which is the total price of the market divided by its replacement cost (more)
– The relationship of the S&P Composite price to a regression trendline (more)
To facilitate comparisons, we’ve adjusted the two P/E ratios and Q Ratio to their arithmetic means and the inflation-adjusted S&P Composite to its exponential regression. Thus the percentages on the vertical axis show the over/undervaluation as a percent above mean value, which we’re using as a surrogate for fair value. Based on the latest S&P 500 monthly data, the market is overvalued somewhere in the range of 45% to 93%, depending on the indicator, down from the previous month’s 48% to 95%.
We’ve plotted the S&P regression data as an area chart type rather than a line to make the comparisons a bit easier to read. It also reinforces the difference between the line charts — which are simple ratios — and the regression series, which measures the distance from an exponential regression on a log chart.
Source: dshort.com
The Average of the Four Valuation Indicators
The next chart gives a simplified summary of valuations by plotting the average of the four arithmetic series (the first chart above) along with the standard deviations above and below the mean.
At the end of last month, the average of the four was 71% — off its interim peak of 78% in February of 2015.
Source: dshort.com
Bottom line: the market remains overvalued.
Next is the Buffett indicator: Market Cap-to-GDP is a long-term valuation indicator that has become popular in recent years, thanks to the Oracle of Omaha. Back in 2001, Buffet remarked in a Fortune interview that “it is probably the best single measure of where valuations stand at any given moment.”
Source: dshort.com
This from an outstanding Morgan Stanley 2014 research piece titled, “Portfolio Strategy – P/E-Based Horizon Returns.”
The MS research used Shiller P/E. Currently at 25.97. Note in the next chart that P/Es greater than 17 showed the worst returns for the subsequent one to 10 years.
MS Chart: Annualized Equity Return Using Initial Trailing P/Es (1950 – 2014)
And next is GMO’s “7-Year Asset Class Real Returns Forecasts”
Note U.S. Large Caps at -3.1% as in each year for seven years. Show this to your client expecting 10%.
One last note – the S&P 500 is up 6% over the trailing 24 months.
Passive Negligence, by 720Global
I share a few highlights to give you a sense of where the authors are going and encourage you to read the full piece if you feel inclined. Passive Negligence, by 720Global.
Here is the gist of the piece:
One of the consequences of a “managed” economy, such as the one the Fed has created, is that the normal functions of a capitalistic society erode. Capital is misallocated in a behavioral response to policy, and asset price inflation emerges in a divergence from economic fundamentals. One of the manifestations of this reaction by investors is the recent rise in popularity of passive equity investing. This mindless style of investing has implications that few investors appear to consider. It is important for investment managers to understand the consequences of passive investing. The sizeable and growing source of demand for equities due to interest in passive strategies may generate a short?term boost to valuations, which helps explain the cheerleading, but the intermediate to longer?term effects seem destined to be quite damaging.
Here is their conclusion:
- As the appeal of passive index funds increases and such funds garner a larger portion of investors’ dollars, the distortions to valuations and cost of capital will intensify. A quote from a Wall Street Journal article sends a stern warning. “It is time to acknowledge the truth,” said a March shareholder letter from Cohen & Steers Inc., manager of real estate and other specialized active funds.
- Stock picking in its current form “is no longer a growth industry.” Active fund firms that don’t “position themselves for the sea change” will be “relegated to the dustbin of history.” That quote appears to be a startling endorsement in support of investor negligence.
- Nobody is going to ring a bell at the top of a market, but there are plenty of warped investment strategies and narratives from history that serve the same purpose ?? remember internet companies with no earnings and sub?prime CDOs to name two.
- Investors need to be cognizant of them and understand why the chorus of arguments in favor are shortsighted and flawed. The meteoric rise in passive investing is one such “strategy” sending an important and timely warning.
Important points. A hat tip to our friends at 720Global.
Government Pension Plans are Heading for Disaster
Keep an eye on the looming pension crisis. This from Mises.org: Government Pension Plans are Heading for Disaster.
Trade Signals – Pessimism Rising, Gold Cyclical Bull Remains, Fixed Income Sell Signals (11-02-2016)
S&P 500 Index — 2,110 (11-02-16)
Posted each Wednesday, Trade Signals looks at several of my favorite stock, investor sentiment and bond market indicators. It is my weekly risk management dashboard, designed to keep me better in sync with the major technical trends. I hope you find the information helpful in your work.
Click here for the most recent Trade Signals blog.
Concluding Thought
“Every day I assume every position I have is wrong.”
– Paul Tudor Jones
Investing is more marathon than sprint. Our high yield trend following strategy moved to cash (T-Bills) on Tuesday. The trend turned down. I’ve been trend trading HY since the early 1990s. Is this the big warning? I have no idea, but there is a lot of bad debt that is going to run headfirst into the next recession. Defaults will spike and set records. Generally, very good news for the strategy.
The Zweig Bond Model moved to a sell signal several weeks ago. So far, both trades look good. Some signs of inflation and the high probability of a Fed December rate increase have unnerved the bond markets. For now, the trade to T-Bills looks good.
I personally believe a rate increase is a big mistake. Global growth is signaling there is a structural problem. The trend in GDP growth, despite the curious recent spike in soybean exports, remains in the 1.5% to 2% range. Global trade is not strong. I remain in the “interest rates-are-lower-for-longer” camp. But who knows… others see higher rates.
Look to the information that is embedded in price. All buyers and sellers meet at price. Trend following doesn’t predict, it reacts. When valuations reset lower, we can jump back in with confidence of mid-teen percentage returns. Not now. Risk is high and something just doesn’t smell right.
Personal Note

6:00 am, favorite chair, coffee near and new best friend seeming interested in today’s On My Radar. Susan took this picture when I wasn’t looking. Unfortunately, now you know what I look like fresh out of bed. I think the kitten is saying, “oh sh*t, look at that pension problem.” I’m thinking I’m looking more and more like my old man by the minute.
With the coming ski season on our minds, last Sunday, Susan, I and the boys went to our favorite ski shop. The owners’ cats and dogs roam the store and we’ve always found that kind of fun. We found the boys playing with two kittens and the owner offered us one. One snowboard and a pair of skis later, we found ourselves driving home with a six-week-old kitten. Daks, short for Kodak (no idea how the boys picked that name), joins dog Shiloh and Miles the cat, five boys, one girl and Susan and me. Lucky man!
A trip to Boston is planned for November 14. Chicago follows on December 7-8 and I’ll be speaking at the Inside ETFs Conference in Hollywood, Florida, sharing ideas on trend following and gold ETFs, in late January.
Hey, speaking of Chicago, a big congratulations to the Chicago Cubs, fans and my Cubs friends. Game seven – extra innings – 8 to 7. Exciting game!
I came across the following fun facts in a piece penned by friend Chris Hempstead from KCG and share it with you. He noted, looking back to the Cubs last world championship 108 years ago in 1908:
- The average wage was 22 cents per hour
- The average life expectancy was 47 years
- There were only 144 miles of paved roads
- The U.S. had 230 murders
- Las Vegas population was 30
I wonder what they will say 108 years from now about life in 2016? Maybe something like, what a bizarro election. I’ll steer clear of sharing my personal views in print as the subject tends to get polarizing, but I find myself waking up each morning looking to see what new bombshell dropped overnight.
What’s the stock market telling us about who will win?
“Going back to World War II,” notes Sam Stovall, chief investment strategist at CFRA, “the S&P 500 performance between July 31 and October 31 has accurately predicted a challenger victory 86% of the time when the stock market performance has been negative…. And the crystal ball’s showing a Trump win…”
It looks like we are heading for a photo finish. If Hillary wins, there is a probability of impeachment. Can you say President Tim Kaine? You just can’t make this stuff up.
Hug your family, hug your friends and do something really fun for you this weekend.
If you find the On My Radar weekly research letter helpful, please tell a friend … also note the social media links below. I often share articles and charts via Twitter that I feel may be worth your time. You can follow me @SBlumenthalCMG.
? If you are not signed up to receive my weekly On My Radar e-newsletter, you can subscribe here. ?
Wishing you and your family the very best!
Steve
Stephen B. Blumenthal
Chairman & CEO
CMG Capital Management Group, Inc.


